 Open Access Article
Electrochemical migration behavior of moldy printed circuit boards in a 10 mT magnetic field
Xuan Liua,
Ziheng Baia,
Qianqian Liua,
Yali Fenga,
Chaofang Dong a,
Lin Lua,
Hong Luo*a,
Jirui Wangb,
Shiwen Zouc and
Kui Xiao
 *a
*a
aInstitute of Advanced Materials and Technology, National Materials Corrosion and Protection Data Center, University of Science and Technology Beijing, Beijing 100083, P. R. China. E-mail: xiaokui@ustb.edu.cn; luohong@ustb.edu.cn; Fax: +86-1062334005; Tel: +86-1062333975 ext. 509
bSichuan Chendu Soil Environmental Material Corrosion National Observation and Research Station, Chendu 610062, China
cAerospace Research Institute of Materials & Processing Technology, Beijing 100076, China
First published on 20th August 2021
Abstract
In the electrochemical migration behavior (ECM) of printed circuit boards containing mold under a static magnetic field (SMF), the role of the field perpendicular to the electrodes is discussed; the B field inhibits the growth and metabolism of mold, while controlling electrochemical diffusion and nucleation. The field indirectly affects the function of mold as a transmission bridge between two electrodes. In this work, the water drop test was used to simulate the adhesion and growth of mold on the circuit board in a humid and hot environment; confocal laser scanning microscopy, scanning electron microscopy, energy dispersive spectroscopy, Raman spectra, and a scanning Kelvin probe were used to analyze the mechanism of static magnetic field and mold on the electrochemical migration.
1 Introduction
In recent years, due to the rise of 5G, the construction of various 5G base stations has spawned the further development of the electronics manufacturing industry. However, it is worth noting that the environmental adaptability and reliability of internal printed circuit boards (PCB) of electronic devices that are in service are still facing huge challenges.1,2In a high humidity environment, electronic components may be in an unstable state.3–5 In this case, the metal electrodes feedback the applied voltage through electrochemical ionization and ion migration with the conductive liquid membrane. This will cause a short circuit of the component circuit, which is known as electrochemical migration (ECM).5 ECM generally has several processes: the adsorption of electrolytes and formation of a thin liquid film, electrochemical reaction, and the growth of metal dendrites. Metal ions preferentially form electrodeposits at high-energy sites on the cathode, which eventually bridge the two electrodes after continuous accumulation.6–9
Previous work has shown that the influencing factors involved in ECM and electronic equipment corrosion include ionic pollutants, temperature, humidity, electric field strength, liquid film thickness, etc.10–12 According to the findings, various microorganisms exist in the atmosphere, once they adhere to the surface of the device, their continued growth and metabolism created an acidic environment that could cause corrosion.13–15 It has also been demonstrated that microorganisms bridged the circuit and formed ion channels, which promoted the ECM process and aggravated the short-circuit failure.16,17
The electrochemical reaction is usually affected by mass transport. For examples, the magnetic field generates convection in the electrochemical reaction through the magnetohydrodynamic effect,18,19 i.e., the interaction of the external magnetic field and the local current induces a flow that helps reduce the thickness of the diffusion layer and enhance mass transport.20–22 This effect is the most common and earliest research on the combination of magnetic field and electrochemistry, which is known as the Lorentz force. Also, the magnetic field affects the nucleation of the metal in the solution, and it was often found that in the presence of a magnetic field, the number of nucleation sites increased, regardless of the direction of the field, and the nucleation rate of Zn and Ni was controlled by the magnetic flux density.23,24 For more rapid nucleation of copper in the electrochemical deposition, some authors have attributed the effect to the Lorentz force acting on the microscale diffusion layer, the MHD (magnetohydrodynamic) effect;25 or the B field effects on the surface diffusion of ad-atoms.26 Until recently, there is still a lack of knowledge about the physical explanation for the influence of magnetic fields on electrocrystallization nucleation of copper or other metals.
Electronic components and integrated circuits extensively work in a magnetic field environment and the dust with mold in the air is very easy to be attached on electronic equipment, so their service life and performance will be affected.27,28 However, limited work has been reported on the failure behavior of ECM under an external magnetic field, in particular, the corrosion mechanism of ECM behavior with mold is inclusive. Therefore, in this work, stereo microscope, scanning electron microscope, Raman spectroscopy, and scanning Kelvin probe technology were used to study the ECM behavior of PCB with mold under the action of an external static magnetic field (SMF). The electrochemical migration behavior and mechanism were discussed. This research will provide support to improve the reliability of electronic components, especially the complex electromagnetic environment.
2 Experimental
2.1 Sample preparation
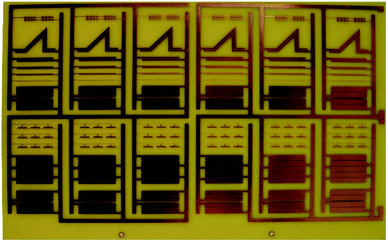
In this work, a wild strain was firstly screened by ITS (Internal Transcribed Spacer) sequence gene alignment, and the test results showed 99% similarity with Aspergillus versicolor. The ITS rDNA sequence of the wild fungus isolated in this study has been uploaded to the GenBank nucleic acid sequence database of NCBI (National Center for Biotechnology Information), and the accession number is MW077051.Next, a 1/5 potato dextrose broth (Table 1) was used to prepare a mold spore suspension, and 200 μL of suspension was dropped on PCB-Cu with the following basic parameters: a 0.8 mm-thick substrate made of FR-4 epoxy glass cloth laminate, a 25–30 μm thick Cu base, and the distance between two neighboring plates was 100 μm. The materials studied in the present work are PCB-Cu samples, as shown in Fig. 1. Before all the tests, the samples were washed with deionized water and absolute ethanol for 5 min, respectively.
| Ingredient | Standard concentration formula | 1/5 standard concentration formula |
|---|---|---|
| Potato dipping powder | 5 g | 1 g |
| Glucose | 15 g | 3 g |
| Peptone | 10 g | 2 g |
| NaCl | 5 g | 1 g |
| Distilled water | 1000 mL | 200 mL |
2.2 Exposure experiment
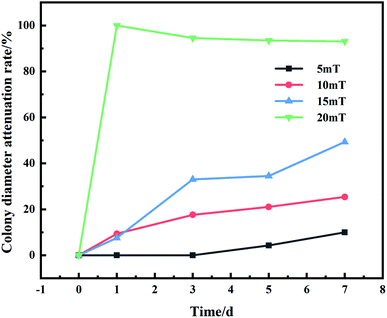
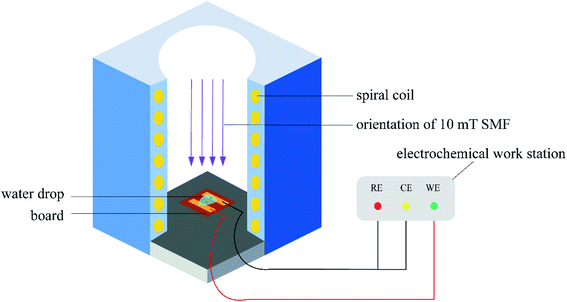
After inoculating the spore suspension, samples were put into a homemade magnetic device: Solenoid was energized to produce a constant static magnetic field perpendicular to the PCB-Cu surface. Fig. 2 shows the growth of mold in 5–20 mT static magnetic field measured by the cross method, which is used to detect the adaptability of the strains isolated in the field to the magnetic environment. We found that Aspergillus versicolor is partially inhibited in a 10 mT magnetic field, and the magnetic field equipment is in a relatively controllable temperature and humidity environment that is more favorable for the growth of microorganisms. Therefore, we applied a 10 mT magnetic field to PCB-Cu through the solenoid coil. Moreover, 12 V direct current (DC) bias was applied between two electrodes. The magnetic experimental setup was shown in Fig. 3. The exposure experiment was conducted at 25 °C and 60% RH in the laboratory for 24 h, 72 h, 120 h, and 168 h, respectively. We divided the samples into the following groups: PCB-Cu with mold, 12 V DC bias as group E1, PCB-Cu with mold, 12 V DC bias, and 10 mT SMF as the group E2; moreover, to clarify the influence of static magnetic field on mold, we set PCB-Cu with mold only as group M1, and PCB-Cu with mold and 10 mT SMF as group M2, detailed information is listed in Table 2.| Experimental group | Conditions |
|---|---|
| E1 | Mold + 12 V DC bias |
| E2 | Mold + 10 mT SMF + 12 V DC bias |
| M1 | Mold |
| M2 | Mold + 10 mT SMF |
2.3 Corrosion analysis method
The morphology of the samples after exposure was observed by a Keyence VK-X200 3D confocal microscope and a FEI Quanta 250 environmental scanning electron microscope. The composition of corrosion products was analyzed by energy-dispersive X-ray spectroscopy (EDS) and Raman spectroscopies with a wavelength of 732 nm.Surface potential tests were performed using SKP (M370) with work distance and amplitude is 100 ± 2 μm and 30 μm. In the formula (1) below, the corrosion potential Ecorr of the working electrode (measured object) in the air is proportional to the Kelvin potential EKP measured by SKP. The change in EKP reflects the variation of the corrosion state in the working electrode in the air. Gaussian fitting shown in formula (2) can further measure the Kelvin potential distribution on the sample surface.
 | (1) |
 | (2) |
3 Results
3.1 Electrochemical migration experiments
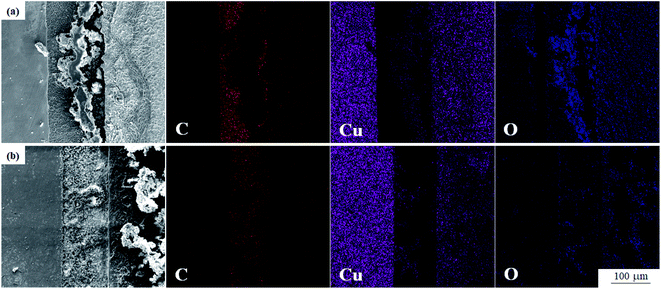 | ||
| Fig. 5 SEM and elemental mapping images of spacing after 72 h test. (a) Group E1; (b) group E2 (left: cathode plate, right: anode plate). | ||
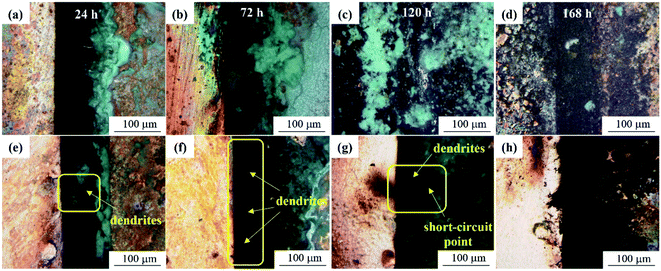
It can be seen from Fig. 6 that the mold can grow normally under 12 V DC bias and 10 mT SMF. In group E1, granular Aspergillus versicolor spores began to grow in clusters at 24 h and gathered on the edge of the dissolved anode. The Cu layer on the surface swelled locally and then ruptured due to corrosion. At 168 h, the anode surface far from the plate spacing peeled and curled, and flocculent corrosion products were distributed on it. The cathode plate was mainly corroded by mold in the experiment. At 24 h, the globular conidia grew up independently, no obvious hyphae were observed, and a small number of fouling substances adhered to the surface around the mycelium. Until 168 h, the mold swelled and became larger and contacted each other into larger colonies, and the surface around the area where the colonies grew was slightly corroded. In general, no matter whether a 10 mT SMF was applied or not, the corrosion of the cathode and anode plates was significantly different. The surface of the cathode plate remained relatively intact; the anode plate cracked and peeled off, but the strains could grow well on both plates. It is worth noting that the growth rate and number of mold spores on cathode plates of group E2 (Fig. 6c1 and d1) were lower than that of group E1, so the corrosion was also alleviated. The composition of the corrosion products will be determined by following test methods.
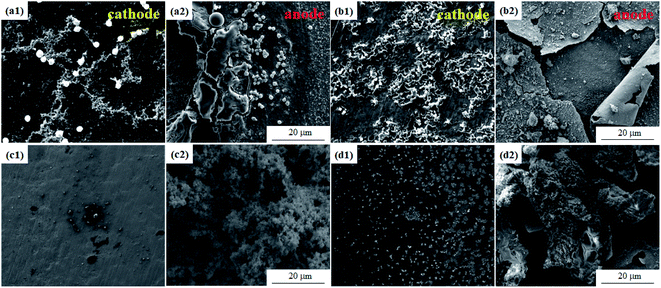 | ||
| Fig. 6 SEM morphologies of the PCB-Cu exposed in the experimental environment for 24 h (a and c) and 168 h (b and d). (a and b) Group E1; (c and d) group E2. | ||
The literature shows the symmetry of the lattice is destroyed due to the presence of defects, so that the peak of the Raman spectrum vibration frequency of the same material is slightly different in the experiment.29–31 The Raman spectrum shows that all curves have peaks near wavenumbers of 125, 146, 215, 410, 490, 525, and 623 cm−1, which indicate the presence of CuO or Cu2O. Among them, 410 and 490 are unique characteristic peaks of Cu2O. Also, there are peaks at 270, 355, 1020, 1140, and 1580 in four curves. These peaks all represent basic copper carbonate, that is, the characteristic peak of CuCO3Cu(OH)2, so each group of samples contains a certain amount of basic copper carbonate. In terms of the relative peak intensity, the characteristic peak intensity of the cathode and anode curves of group E2 is significantly higher, reflecting that the content of basic copper carbonate in group E2 is more than that in group E1.
We can also see that cathodes of the two groups have obvious peaks at 1320 (Fig. 7, zone A and C), and anodes have obvious peaks at 884 and 928 (Fig. 7, zone B and D). Among them, the contrast of the peak intensity of group E2 is higher than group E1. The data reported here suggest that the sample formed a substance with a characteristic peak of 1320 at cathodes, and another substance with a characteristic peak of 884 at anodes. Simultaneously, the magnetic field accelerated the formation of these two substances. In line with pieces of literature, the peaks 884 and 928 match the characteristic peaks of dicopper chloride trihydroxide (Cu2(OH)3Cl). Therefore, it was confirmed that the anode formed basic copper chloride, which is consistent with the fact that Cl was detected at the anode in EDS.
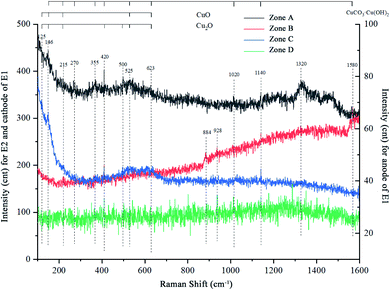 | ||
| Fig. 7 Raman spectra of samples after 72 h test. Group E1: zone-C and D correspond to the cathode and anode plates; group E2: zone-A and B to the cathode and anode plates respectively. | ||
These results of Raman spectroscopy support the evidence that the corrosion products of all anodes can be determined as CuO, Cu2O, CuCO3·Cu(OH)2, and Cu2(OH)3Cl, while cathodes contain CuO, Cu2O, and a small amount of CuCO3·Cu(OH)2. The content of anode product is obviously higher than the cathode. And it can therefore be assumed that cathodes were oxidized and corroded under the high temperature caused by the energized short circuit, which appeared yellow and black. And the findings to emerge from the analysis are that the 10 mT SMF accelerated the formation of corrosion products, that is to say, the magnetic field increased the speed of corrosion reactions.
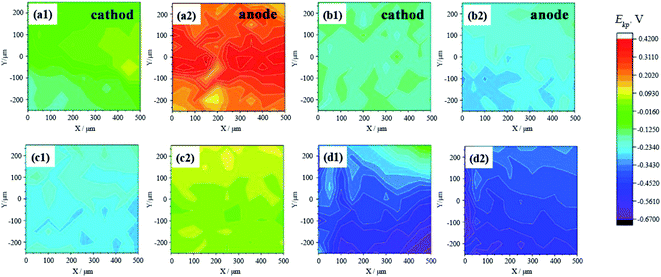 | ||
| Fig. 8 Surface SKP potential distribution of samples taken on 24 h (a and c) and 168 h (b and d). (a and b) Group E1; (c and d) group E2. | ||
| E1 | μ/V | σ2 | E2 | μ/V | σ2 |
|---|---|---|---|---|---|
| a1 | −0.24056 | 0.026902 | c1 | 0.14901 | 0.021782 |
| a2 | −0.42115 | 0.130302 | c2 | −0.42507 | 0.086482 |
| b1 | −0.05687 | 0.450622 | d1 | 0.26360 | 0.102882 |
| b2 | −0.23626 | 0.057102 | d2 | −0.16769 | 0.018902 |
The potential of the anode plates was always higher than the cathode. And in theory, as time goes by, the gap between the plates is filled and the plates are connected, and the difference between the two will become smaller until they are the same. As the result of group E2 at 168 h, the anode potential of the sample was slightly lower than the cathode. It can be seen in conjunction with Fig. 4c and d that the cathode and anode had been bridged by corrosion products. It can be seen from the confocal image that the corrosion products of the anode had not yet “moved” to the cathode at this time, so it was the dendrites of the metal cations that were reduced and deposited on the cathode to connect two plates. The anode and cathode plates are partially associated, and metal cations combined with the OH− in motion through the bridge, so that corrosion products gradually accumulated. Meanwhile, the cathodes were also corroded by mold. The mixture of mold and corrosion products covered the surface of the cathode, which hindered the escape of electrons to a certain extent. Therefore, the potential of the cathode was slightly higher than the anode at this moment.
3.2 Experiment of mold and static magnetic field
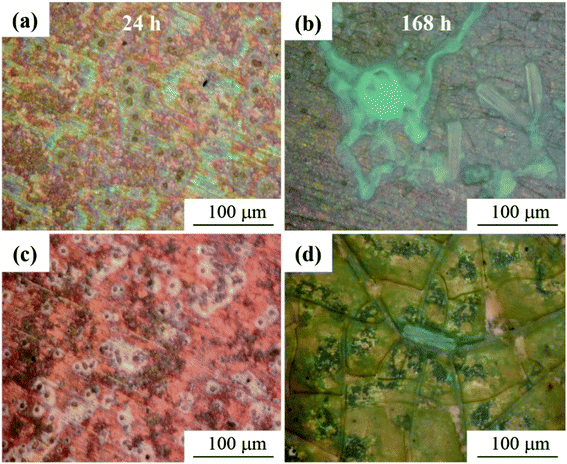
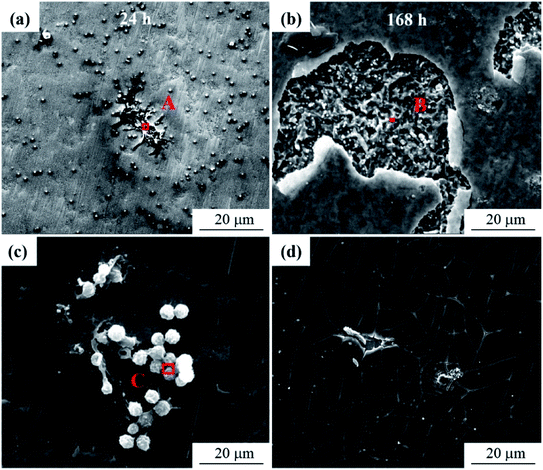
Regarding the role of mold in the electrochemical migration of PCB-Cu, some articles17,32 pointed out that mold accelerates the ionization of metal by corrosion of Cu, and its spores and hyphae enable products to accumulate on the anode to migrate faster to the cathode. Therefore, mold accelerates electrochemical migration and intensifies the corrosion of Cu. To further determine the influence of the magnetic field on mold in the electrochemical migration of PCB-Cu, we set up a control experiment: PCB-Cu with mold in an environment with or without a 10 mT SMF. During a 168 h trial, laser confocal diagrams (Fig. 9) showed that the macroscopic morphology of PCB-Cu inoculated with fungal spore suspension has changed both in the absence/presence of the magnetic field. According to 3D LCSEM and SEM images, the mold formed corrosion pits centered on spores on the surface of group M1, and then connected to form a large area of corrosion pits. Macroscopically, it was a regional uniform corrosion area. Several stages of growth and metabolism of mold could be described as: “spores-mycelium-released more spores”. But during the period of 24–168 h, no hyphae and large mature mold colonies were observed in group M2. A previous study mentioned that the mold growth in the 10 mT SMF group is significantly slower than that in the non-magnetic field group, and at least the spore-mycelia stage is slower.32 This is consistent with our experimental results. We can see from Fig. 10 that after 168 h of testing, the surface of group M2 was only slightly damaged, and the exposed area of Cu substrate underneath was also much smaller, and there was no massive peeling as that in group M1. The EDS results (Table 4) show that the Cu content in area B is higher than that of A and C, but the C content is less, which indicating that when there is no magnetic field, molds dominate the corrosion of PCB-Cu. So, it was believed that a vertical static 10 mT magnetic field inhibited the growth of mold in the electrochemical migration and thus hindered the corrosion of PCB-Cu.| Zone | Elements, at% | |||||
|---|---|---|---|---|---|---|
| Cu | C | N | O | P | Cl | |
| A | 5.90 | 64.62 | 3.42 | 21.31 | 0.35 | 3.23 |
| B | 75.76 | 7.33 | 3.11 | 7.95 | — | 5.96 |
| C | 23.97 | 49.29 | 8.87 | 15.93 | — | 1.94 |
3.3 Discussion
The electrochemical migration process of PCB-Cu under the mold cooperating with DC bias can generally be divided as follows: (1) anodic dissolution due to metal ionization; (2) anion and cation migration; and (3) metal ion reduction deposition and dendrite growth. The dominant electrode reactions of PCB-Cu in the mold environment with 12 V bias are as follows:Anode:
| Cu − e− → Cu+ | (3) |
| Cu − 2e− → Cu2+ | (4) |
Cathode:
| O2 + 2H2O + 4e− → 4OH− | (5) |
| 2H2O + 2e− → 2OH− | (6) |
When the PCB is energized, a certain intensity electric field is generated between the two electrodes (Fig. 10a); at this time, the metal cations (Cu2+, Cu+) produced by anodic dissolution are positively charged. Therefore, 12 V DC bias generates an electric field force (Fe) on the positive ions (negative ions), where q is the amount of charge carried by the positive ions (negative ions), and E is the electric field generated between the two electrodes:
| Fe = qE | (7) |
Driven by the electric field force, the metal ions move from the anode to the cathode. O2 and H2O obtain electrons at the cathode to form OH−. Because the OH− have a small ion radius, they reach the anode faster and form corrosion products with metal ions moving in the opposite direction. In the case of a stable power supply, positive and negative ions continue to meet and combine, forming a “wall” of corrosion products that accumulate between the plates. The “wall” not only forms an ion channel connecting two electrodes, but also prevents the positive ions from being reduced and deposited on the cathode.
FL = qvB![[thin space (1/6-em)]](https://www.rsc.org/images/entities/char_2009.gif) sin(v,B) sin(v,B)
| (8) |
 | (9) |
Fig. 13b and d are the electrochemical migration behavior mechanism diagram of PCB-Cu with mold under 10 mT SMF. As mentioned before, the ions induced by corrosion are positively/negatively charged. While being driven by the electric field, they are also subject to the force of the magnetic field on the moving charges—Lorentz force (FL), where q is the charge of the positive ions (negative ions), v is the velocity of ions, B is the magnetic induction intensity. The FL is perpendicular to the Fe and parallel to the edge of the plate. At the same time, the FL is always perpendicular to the direction of movement of the ion, so it only changes the orientation of the ion's velocity but does not affect the magnitude of the movement speed. Therefore, through force analysis, it can be known that the resultant force (F) of the ions forms an angle φ with the horizontal direction (anode to cathode).
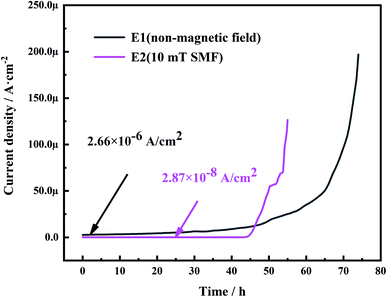 | ||
| Fig. 11 Typical curves of current as a function of time: for ECM of molded PCB in non/10 mT magnetic field environment. | ||
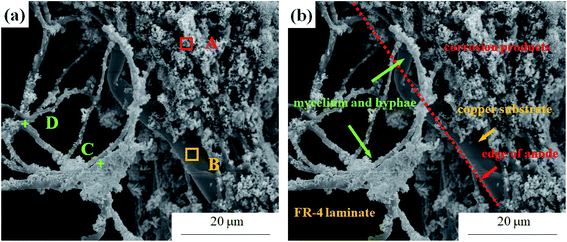 | ||
| Fig. 12 (a) The mold on PCB-Cu loaded with 12 V bias taken at 24 h in 10 mT magnetic field environment, and (b) graphical illustration of corrosion structure characteristics. | ||
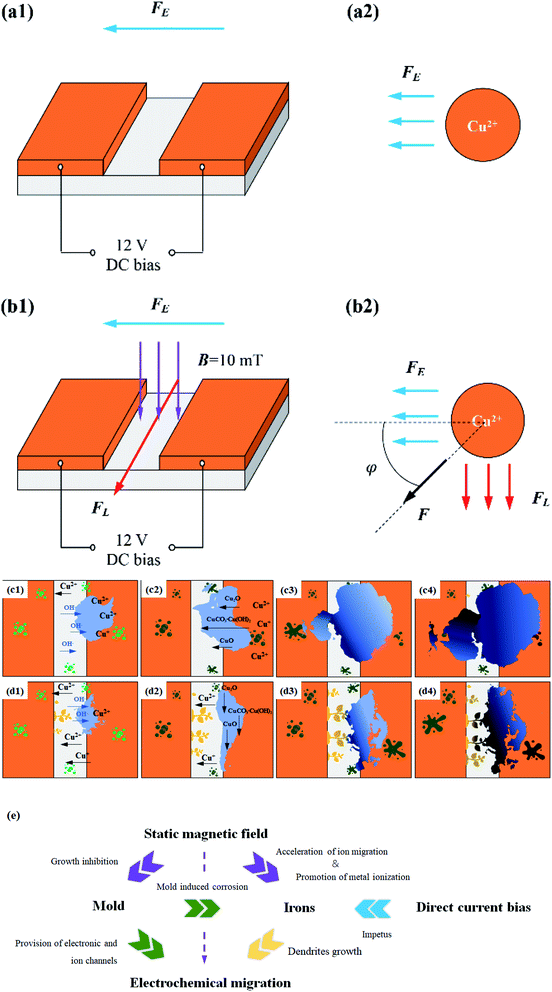 | ||
| Fig. 13 Schematic diagrams for ECM process of PCB-Cu. (a and c) Group E1; (b and d) group E2; (e) relation chart. | ||
Fig. 11 shows the relationship between current density and time in the mold medium, which is during ECM in a non-magnetic field/10 mT magnetic field environment. When the mold grows and metabolizes between the two electrodes, it absorbs moisture and produces acid, forming a moist environment on the surface;33,34 this makes it possible to short-circuit between the electrodes. When the dendrites bridge the anode and the cathode, a sudden current density spike occurs, causing a short circuit. It can be seen that the Tst (time to short circuit) shown in the figure decreases when a 10 mT magnetic field is applied. This may be attributed to the reduction of more Cu ions in the electrolyte driven by the resultant force, which accelerates the growth of dendrites to the anode and electrochemical failure. This causes the 10 mT SMF to promote the short circuit of PCB-Cu. However, the current density in magnetic field environment decreases from about 10−6 A cm−2 to about 10−8 A cm−2, which may be related to the growth of mold suffer by 10 mT static magnetic field.
Therefore, it is necessary to explain the role of mold in electrochemical migration. Fig. 11 is a micro-morphology of mold in a magnetic field taken at 24 hours. Part of the mold continues to grow, and the formed mycelia cling to the electrode and bond with the corrosion products. At the same time, there are also a small number of Cu-containing debris products on the thallus (Table 5). This confirms that molds indeed act as physical connections and particle migration channels in electrochemical migration. However, the growth of mold was inhibited by the magnetic field. This causes metal ionization and transport rates to decrease, thus reducing the current density generated in the loop. This result is also consistent with the current–time curve presented in electrochemical tests.
| Zone | Elements, at% | |||||
|---|---|---|---|---|---|---|
| Cu | C | N | O | P | Cl | |
| A | 56.2 | 11.3 | 0.9 | 28.2 | — | 3.5 |
| B | 88.6 | 7.5 | 1.4 | 1.9 | — | 0.5 |
| C | 14.0 | 35.8 | 1.3 | 36.4 | 3.5 | 9.0 |
| D | 11.9 | 53.8 | 0.5 | 26.0 | 1.8 | 6.1 |
On the one hand, since the metal ions and OH− are not driven by a single electric field, the corrosion products tend to expand vertically and no longer form an obstructive product “wall” between plates (this also explains why we can observe the dendrite formation clearly after the application of magnetic field). As a result, copper ions can successfully migrate through the product layer toward the cathode, and are reduced and deposited to form dendrites. On the other hand, according to the analysis results of Raman spectrum and SKP, it can be known that the magnetic field can accelerate the ionization and corrosion reaction of the metal, which makes a large number of copper ions generated at the anode. One part combines with OH− to form precipitation products, and the other part travels to the cathode to produce dendrites. In addition, although the mold is affected by the magnetic field, it still plays a role in promoting metal ionization, connecting the anode and cathode electrodes, and assisting ion transport during the electrochemical migration process of the PCB. Therefore, the dendrites bridge the corrosion products short-circuiting the integrated circuit in the end.
4 Conclusions
The electrochemical migration behavior of PCB-Cu with mold under the SMF environment was studied by several methods, some conclusions were drawn as follows:(1) Among them, mold growth promotes metal ionization and provides a channel for ECM, the 12 V DC bias is the impetus.
(2) The 10 mT SMF generates a Lorentz force which causes corrosion products accumulated on the anode to extend rapidly in the direction parallel to plates, thus widening the boundary of anodic product “wall”; at the same time, the product “wall” formed by the anodic dissolution is no longer blocked between the plates, so that the Cu ions can reach the cathode directly, and are reduced and deposited to produce dendrites;
(3) The SMF itself has an accelerating effect on ions, which can aggravate the corrosion reaction; but the magnetic field inhibits the growth of mold, thus weakening the mold's promotion of ECM. The SMF both promotes and restrains ECM of PCB-Cu with mold and 12 DC bias.
Conflicts of interest
There are no conflicts to declare.Acknowledgements
This work was supported by the National Natural Science Foundation of China (No. 51971032 and 51671032).References
- P. Yi, K. Xiao, K. Ding, C. Dong and X. Li, Surface failure mechanism of PCB-ENIG in typical outdoor atmospheric environments, Mater. Res. Bull., 2017, 91, 179–188 CrossRef CAS.
- H. Huang, X. Guo, G. Zhang and Z. Dong, The effects of temperature and electric field on atmospheric corrosion behaviour of PCB-Cu under absorbed thin electrolyte layer, Corros. Sci., 2011, 53, 1700–1707 CrossRef CAS.
- S. B. Lee, Y. R. Yoo, J. Y. Jung, Y. B. Park, Y. S. Kim and Y. C. Joo, Electrochemical migration characteristics of eutectic SnPb solder alloy in printed circuit board, Thin Solid Films, 2006, 504, 294–297 CrossRef CAS.
- R. W. Leinz, D. B. Hoover and A. L. Meier, NEOCHIM: An electrochemical method for environmental application, J. Geochem. Explor., 1999, 64, 421–434 CrossRef.
- G. Q. Lu, C. Yan, Y. Mei and X. Li, Dependence of electrochemical migration of sintered nanosilver on chloride, Mater. Chem. Phys., 2015, 151, 18–21 CrossRef CAS.
- B. Medgyes, B. Illés, R. Berényi and G. Harsányi, In situ optical inspection of electrochemical migration during THB tests, J. Mater. Sci.: Mater. Electron., 2010, 22, 694–700 CrossRef.
- B. Rudra and D. Jennings, Tutorial Failure-Mechanism Models for Conductive-Filament Formation, IEEE Trans. Reliab., 1994, 43, 354–360 CrossRef.
- W. Lawson, in The effects of design and environmental factors on the reliability of electronic products, School of Computing, Science and Engineering, University of Salford, UK, 2007, p. 135 Search PubMed.
- J. W. Yoon, B. I. Noh and S. B. Jung, Electrical properties and electrochemical migration characteristics of directly printed Ag patterns with various sintering conditions, Microelectron. Reliab., 2014, 54, 410–416 CrossRef CAS.
- J. Wang, Z. Bai, K. Xiao, X. Gao, P. Yi, C. Dong, J. Wu and D. Wei, Influence of atmospheric particulates on initial corrosion behavior of printed circuit board in pollution environments, Appl. Surf. Sci., 2019, 467–468, 889–901 CAS.
- J. Zhang, Effect of Dust Contamination on Electrical Contact Failure, 2007 Search PubMed.
- K. K. Ding, X. G. Li, K. Xiao, C. F. Dong, K. Zhang and R. T. Zhao, Electrochemical migration behavior and mechanism of PCB-ImAg and PCB-HASL under adsorbed thin liquid films, Trans. Nonferrous Met. Soc. China, 2015, 25, 2446–2457 CrossRef CAS.
- K. Ding, K. Xiao, C. Dong, S. Zou, P. Yi and X. Li, Initial Corrosion Behavior and Mechanism of PCB–HASL in Typical Outdoor Environments in China, J. Electron. Mater., 2015, 44, 4405–4417 CrossRef CAS.
- X. Dai, H. Wang, L. K. Ju, G. Cheng, H. Cong and B. M. Z. Newby, Corrosion of aluminum alloy 2024 caused by Aspergillus niger, Int. Biodeterior. Biodegrad., 2016, 115, 1–10 CrossRef CAS.
- B. Li, X. Luo, H. Zhang and Y. Tang, Different effect of three soil microfloras on the corrosion of copper, RSC Adv., 2016, 6, 37544–37554 RSC.
- P. Yi, K. Xiao, C. Dong, S. Zou and X. Li, Effects of mould on electrochemical migration behaviour of immersion silver finished printed circuit board, Bioelectrochemistry, 2018, 119, 203–210 CrossRef CAS PubMed.
- K. Xiao, P. Yi, C. Dong, S. Zou and X. Li, Role of mold in electrochemical migration of copper-clad laminate and electroless nickel/immersion gold printed circuit boards, Mater. Lett., 2018, 210, 283–286 CrossRef CAS.
- R. Aogaki, K. Fueki and T. Mukaibo, Application of Magnetohydrodynamic Effect to the Analysis of Electrochemical Reactions-1. MHD Flow of an Electrolyte Solution in an EIectrode-Cell with a short Rectangular Channel, Electrochemistry, 1975, 504–508 CAS.
- T. Z. Fahidy, Hydrodynamic models in magnetoelectrolysis, Electrochim. Acta, 1973, 18, 607–614 CrossRef CAS.
- L. Monzon, V. Nair, B. Reilly and J. M. D. Coey, Magnetically-Induced Flow during Electropolishing, J. Electrochem. Soc., 2018, 165, E679–E684 CrossRef CAS.
- H. B. Liu, L. M. Pan, Q. J. Qin and P. F. Li, Experimental and numerical investigation of gas–liquid flow in water electrolysis under magnetic field, J. Electroanal. Chem., 2019, 832, 293–302 CrossRef CAS.
- K. Scott, Process intensification: An electrochemical perspective, Renewable Sustainable Energy Rev., 2018, 81, 1406–1426 CrossRef.
- L. M. A. Monzon, L. Klodt and J. M. D. Coey, Nucleation and Electrochemical Growth of Zinc Crystals on Polyaniline Films, J. Phys. Chem. C, 2012, 116, 18308–18317 CrossRef CAS.
- A. Ispas, H. Matsushima, A. Bund and B. Bozzini, Nucleation and growth of thin nickel layers under the influence of a magnetic field, J. Electroanal. Chem., 2009, 626, 174–182 CrossRef CAS.
- R. Aogaki, R. Morimoto and M. Asanuma, Nonequilibrium fluctuations in micro-MHD effects on electrodeposition, J. Magn. Magn. Mater., 2010, 322, 1664–1668 CrossRef CAS.
- H. Matsushima, A. Ispas, A. Bund and B. Bozzini, Magnetic field effects on the initial stages of electrodeposition processes, J. Electroanal. Chem., 2008, 615, 191–196 CrossRef CAS.
- P. Rombach and L. Werner, An integrated sensor head in silicon for contactless detection of torque and force, Sens. Actuators, A, 1994, 42, 410–416 CrossRef.
- W. Thomson, On the Electro-Dynamic Qualities of Metals: Effects of Magnetization on the Electric Conductivity of Nickel and of Iron, Proc. R. Soc. London, 1856, 8, 546–550 Search PubMed.
- P. Y. Yu and Y. R. Shen, Resonance Raman studies in Cu2O. I. The phonon-assisted 1 s yellow excitonic absorption edge, Phys. Rev. B: Solid State, 1975, 12, 1377–1394 CrossRef CAS.
- C. A. Melendres, S. Xu and B. Tani, A laser Raman spectroscopic study of anodic corrosion films on silver and copper, J. Electroanal. Chem. Interfacial Electrochem., 1984, 162, 343–349 CrossRef CAS.
- G. Niaura, Surface-enhanced Raman spectroscopic observation of two kinds of adsorbed OH- ions at copper electrode, Electrochim. Acta, 2000, 45, 3507–3519 CrossRef CAS.
- J. Wang, Z. Bai, K. Xiao, X. Li, Q. Liu, X. Liu, J. Wu, L. Lu and C. Dong, Effect of static magnetic field on mold corrosion of printed circuit boards, Bioelectrochemistry, 2020, 131, 107394 CrossRef CAS PubMed.
- R. Jia, T. Unsal and D. Xu, et al., Microbiologically influenced corrosion and current mitigation strategies: A state of the art review, Int. Biodeterior. Biodegrad., 2019, 137, 42–58 CrossRef CAS.
- T. Akar and S. Tunali, Biosorption characteristics of Aspergillus flavus biomass for removal of Pb(II) and Cu(II) ions from an aqueous solution, Bioresour. Technol., 2006, 97(15), 1780–1787 CrossRef CAS PubMed.
| This journal is © The Royal Society of Chemistry 2021 |

