
 Open Access Article
 This Open Access Article is licensed under a Creative Commons Attribution-Non Commercial 3.0 Unported Licence
Modification of a nitrocellulose membrane with nanofibers for sensitivity enhancement in lateral flow test strips†
Xue Wanga,
Chao-Hua Xue *ab,
Dong Yang*c,
Shun-Tian Jiab,
Ya-Ru Dingb,
Lei Leic,
Ke-Yi Gaoc and
Tong-Tong Jiac
*ab,
Dong Yang*c,
Shun-Tian Jiab,
Ya-Ru Dingb,
Lei Leic,
Ke-Yi Gaoc and
Tong-Tong Jiac
aCollege of Environmental Science and Engineering, Shaanxi University of Science and Technology, Xi'an 710021, China. E-mail: xuechaohua@126.com
bCollege of Bioresources Chemical and Materials Engineering, Shaanxi University of Science and Technology, Xi'an 710021, China
cCollege of Chemistry and Chemical Engineering, Shaanxi University of Science and Technology, Xi'an 710021, China. E-mail: yangdong@sust.edu.cn
First published on 2nd August 2021
Abstract
Lateral-flow analysis (LFA) is a convenient, low-cost, and rapid detection method, which has been widely used for screening of diseases. However, sensitivity enhancement in LFA is still a focus in this field and remains challenging. Herein, we propose an electrospinning coating method to modify the conventional nitrocellulose (NC) membrane and optimize the liquid flow rate for enhancing the sensitivity of the NC based LFA strips in the detection of human chorionic gonadotropin (HCG) and luteinizing hormone (LH). It can be seen that coating the NC membrane with nitrocellulose fibers could obtain a NC based strip with HCG and LH detection limits of 0.22 and 0.36 mIU mL−1 respectively, and a quantitative linear range of 0.5–500 mIU mL−1. The results show that electrospinning is effective in modifying conventional NC membranes for LFA applications.
1 Introduction
Lateral-flow analysis (LFA) strips, as a typical low-cost, miniaturized, user friendly, robust, and equipment-free method, are an analysis platform that is ideally suited for point of care diagnostics, and has broad applications in many fields, including food safety,1–3 water resources,4–6 medical safety and body health.7–9 At present, several common LFAs, such as ovulation test strips,10 pregnancy test strips,11,12 and urine test strips13 are sold in hospitals and pharmacies and are successful cases of LFA commercialization. However, the limited sensitivity of LFA is still a concern and remains challenging in applications.Research in this field has developed various methods for improving the sensitivity of LFA, including sample pretreatment,14–17 modification of labeled antibody nanoparticles,18–22 nanozyme signal enhancement,23–26 and targeted fixation of antibodies.27 Besides, many researches have been done focusing on modification of the key component of the test strip, i.e., the nitrocellulose (NC) membrane by introducing functional groups onto the surface or increase the specific surface area to improve the sensitivity of the test strip.28,29 However, these signal-amplification methods often need additional equipment, complex operations, or specialized personnel, most of which are time-consuming and unsuitable for onsite detection.
Recently, reducing the flow rate of the sample solution in the detection shows positive to enhance sensitivity of test strips.30–35 For example, sponge shunt was integrated into LFA to decrease the fluid flow rate to achieve a 10-fold signal enhancement in nucleic acid testing of HBV.32 Additionally, membrane materials made by electrospinning was applied in LFAs to increase sensitivity.36,37 Electrospinning is a simple and cost-effective method of generating fibers and nanomembranes with great porosity and large surface-to-mass ratio. Yew et al.38 electrospun polycaprolactone (PCL) fibers on the surface of commercially available nitrocellulose membrane to reduce the liquid flow rate on the membrane, thereby fulfilled the ultimate aims of increasing detection sensitivity.
Herein, a layer of nitrocellulose fibers were electrospun on the surface of commercially available NC membranes to adjust the porosity for improving the protein adsorption performance and reducing the flow rate to increase the opportunity of antigen–antibody reaction. The electrospin-coated nitrocellulose (ENC) membrane was used as a matrix in LFA for detecting antibody/antigen, including human chorionic gonadotropin (HCG) and luteinizing hormone (LH) antigen (Fig. 1). We predicted that this ENC as the support of LFA strips might provide a potential reference for the preparation of membranes with high sensitivity.
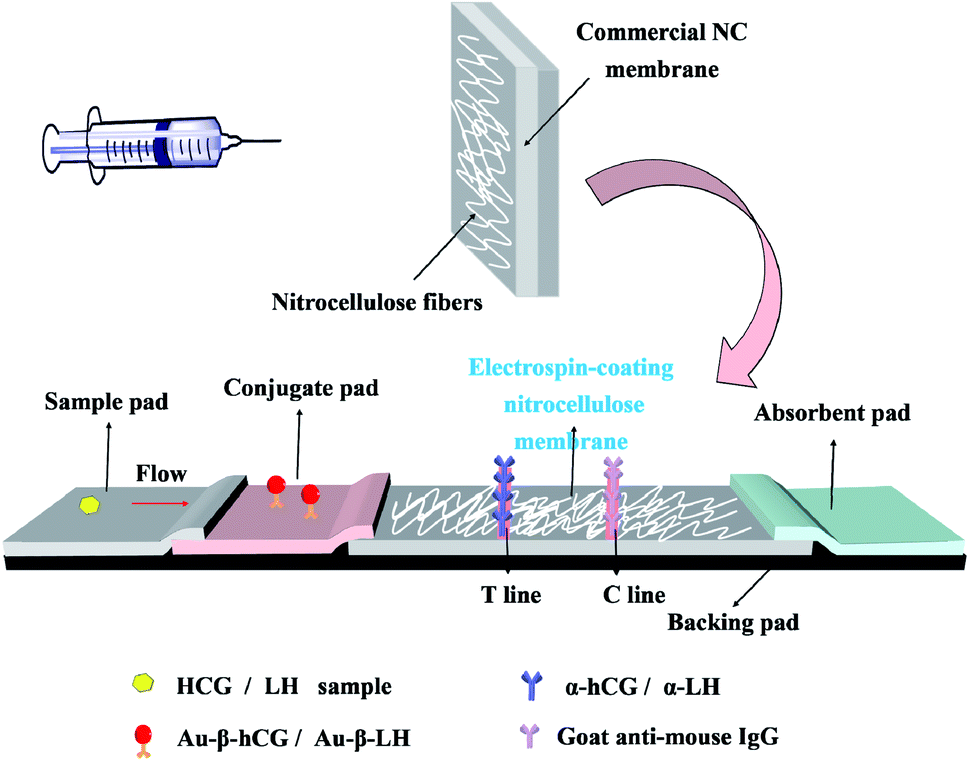 | ||
| Fig. 1 Schematics of electrospin-coating nitrocellulose membrane on commercial nitrocellulose membrane for LFA strips. | ||
2 Experimental
2.1 Materials
Acetone, N,N-dimethylformamide (DMF), sucrose, Tween-20, polyethylene glycol 20000 (PEG-20000), chloroauric acid (HAuCl4) and sodium citrate (Na3C6H5O7) were purchased from Sinopharm Chemical Reagent Co., Ltd (China). Nitrocellulose (NC) was purchased from Xingping Baotashan Coating Co., Ltd (Shaanxi, China). PVC backing plate, sample pad, conjugate pad, absorbent pad, α-hCG antibody, β-hCG antibody, β-LH antibody, α-LH antibody, goat anti-mouse IgG, commercial nitrocellulose (CNC) membrane and bovine serum albumin (BSA) were purchased from Shanghai JieYi Biotechnology Co., Ltd (Shanghai, China). Human chorionic gonadotropin (HCG), luteinizing hormone (LH) and follicle-stimulating hormone (FSH) were purchased from Shanghai Sangon Biotech Co., Ltd (Shanghai, China).2.2 Coupling colloidal gold particles and monoclonal antibodies
![[thin space (1/6-em)]](https://www.rsc.org/images/entities/char_2009.gif) 000 rpm, 10 min) and dissolved in Au-mAb storage solution. Finally, the conjugate was stored at 4 °C for further use. Similarly, AuNPs labeled β-LH monoclonal antibody conjugate was obtained.
000 rpm, 10 min) and dissolved in Au-mAb storage solution. Finally, the conjugate was stored at 4 °C for further use. Similarly, AuNPs labeled β-LH monoclonal antibody conjugate was obtained.2.3 Modification of CNC membrane by electrospinning coating with NC
In a typical experiment, a certain amount of fully dried nitrocellulose raw material was added into a mixed solvent of acetone and DMF, and stirred at room temperature for 24 h to obtain a clear yellowish solution with a concentration of 26%. CNC membranes were carefully placed on the receiver and a syringe containing the spinning solution was mounted on the syringe pump. The electrospinning process was carried out at room temperature for a given time. According to the spinning time, including 1 min, 2 min, 3 min, 6 min, the electrospinning coated CNC (ENC) membranes were named ENC-1, ENC-2, ENC-3, ENC-6, respectively.2.4 Performance testing of the membranes
 | (1) |
 and Ā are the absorbance of membranes before and after adsorption, respectively.
2.5 Preparation of the LFA strips
The LFA strip consists of sample pad, conjugate pad, ENC membrane, absorbent pad, and PVC backing plate. With the use of a gold spraying instrument (HM3030, Shanghai Jinbiao Biotechnology Co., Ltd.), α-hCG/α-LH antibody and goat anti-mouse IgG antibody were immobilized in a defined test line (T-line) and control line (C-line) on the ENC membrane, respectively. Then, Au-mAb conjugate was dispensed on the conjugate pad. The strips were cut into 3.3 mm and stored in dry conditions.2.6 Assay procedure
PBS buffer solution was used to diluted the standard HCG and LH samples into different concentrations (0.25, 0.5, 1, 5, 25, 50, 100, 500 mIU mL−1). 100 μL HCG/LH dilution samples were dropped on the sample pad and observed for the detection results after 15 min. The lowest detection limit (LOD) was defined as 3 times the blank/slope standard deviation (S/N = 3).2.7 Testing and characterization
The morphology of the membranes was investigated using a S-4800 field emission scanning electron microscope (Hitachi Japan) at an accelerating voltage of 5 kV. To increase the conductivity of the sample, the test sample was sputter-coated with gold before testing. Water contact angles (CA) of the NC membranes were measured with a deionized water droplet of 5 μL on a video optical contact angle system (OCA 20, Dataphysics, Germany), and images were captured with a digital camera. The morphology and particle size of the AuNPs and Au-mAb conjugate were measured using FEI Tecnai G2 F20 S-TWIN Transmission Electron Microscope (US FEI Company). The characteristic absorption peaks of the prepared AuNPs and Au-mAb conjugate were characterized by a UV-Vis-NIR spectrophotometer (Cary 5000 Agilent USA). The porosity and OD value, which were analyzed by Image J software. The coverage fraction of the electrospinning fibers on the ENC membranes were obtained by using Photoshop software.3 Results and discussion
3.1 NC membranes morphology
Fig. 2a–d shows that increasing the electrospin-coating time increased the number of fibers on the surface of the membrane. The fiber diameters are uniform, while the CNC membrane shows porous structure (Fig. 2e). The coverage fraction as well as the mass of NC fibers on the ENC membranes also increased with the increase of electrospinning time (Fig. 2f). The covering of NC fibers might change the liquid flow channel of the CNC membranes and the surface properties. It is recognized that water droplets spread easily on the CNC membrane due to its hydrophilicity and the capillary effect. However, water CA increased with increasing the electrospinning time (insets in Fig. 2a–e), it was found that the CA duration of 0 s, 60 s, 120 s, 180 s, 360 s were 0°, 16.7°, 65.7°, 111°, 120°, indicating that the membranes were changed from hydrophilic to hydrophobic.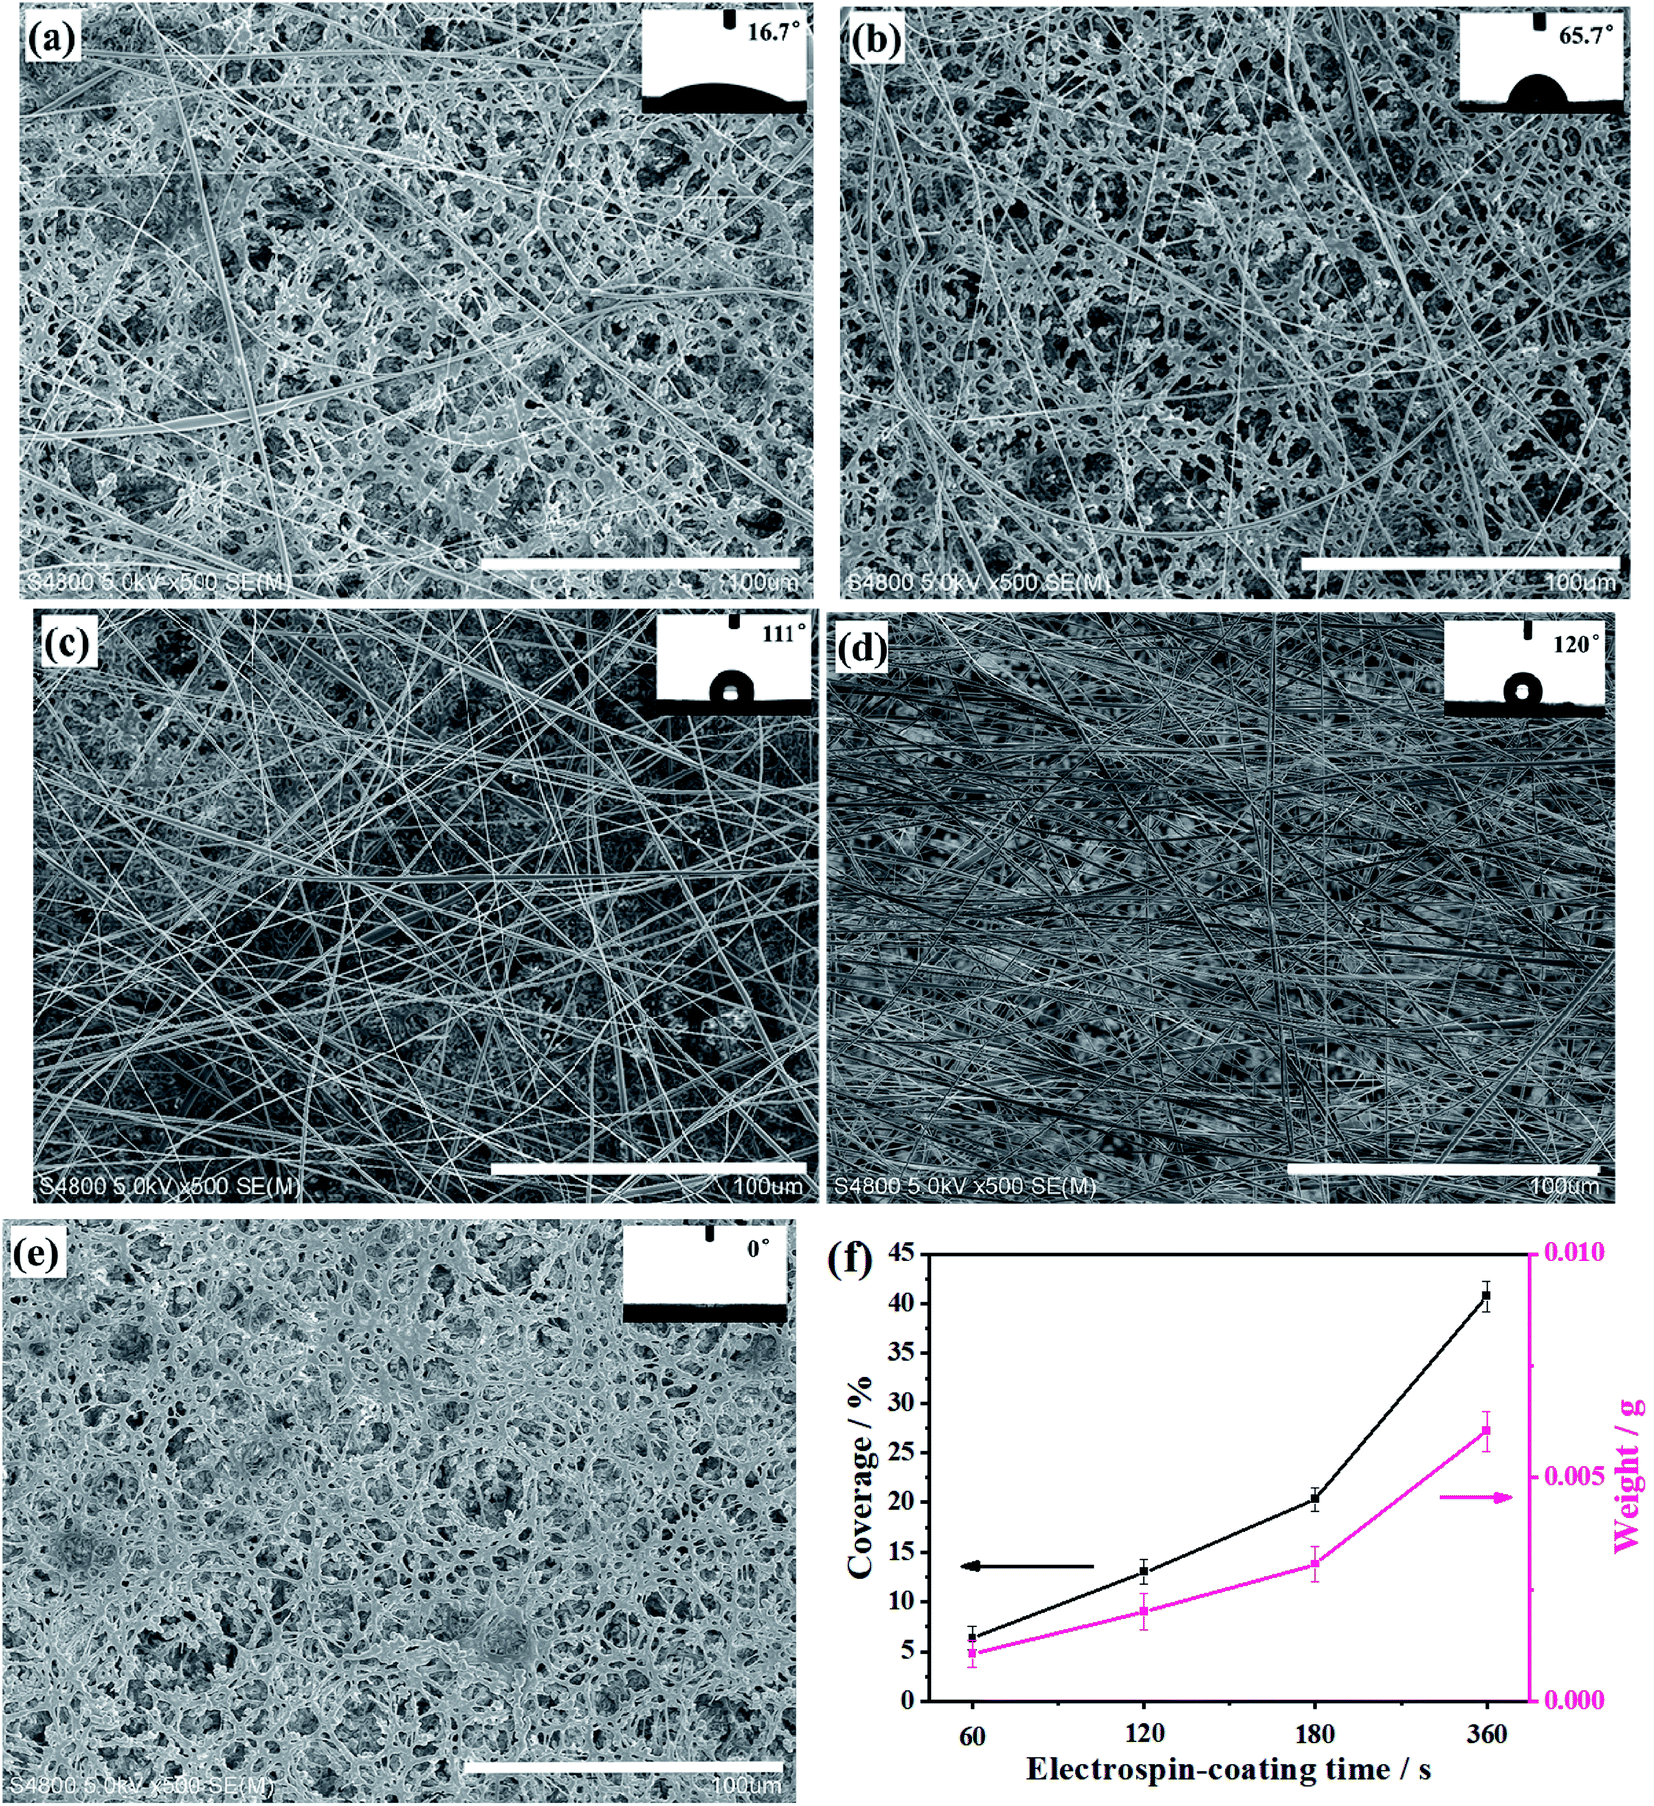 | ||
| Fig. 2 SEM images of the ENC membranes and the corresponding diameter distributions: (a) ENC-1, (b) ENC-2, (c) ENC-3, (d) ENC-6; (e) SEM image of the CNC membrane; (f) the relationship between the electrospin-coating time of the membrane fibers and the coverage fraction and weight increase of membrane, respectively. | ||
3.2 Flow rate measurement of NC membrane
In traditional immunoassay, due to such limitations of CNC membrane as flow rate, porosity, protein adsorption rate and so on, the amount of antibody adsorbed on surface of the membrane is very less. And when the protein flows through the CNC membrane, it has not enough time for antibody get specific reaction, which will affect the sensitivity of immune reaction. Therefore, we expect that electrospin-coating of fibers on the membrane would increase the porosity and decrease the liquid flow rate, thus increase the protein adsorption, and ends up to enhance the sensitivity of the strips (Fig. 3a).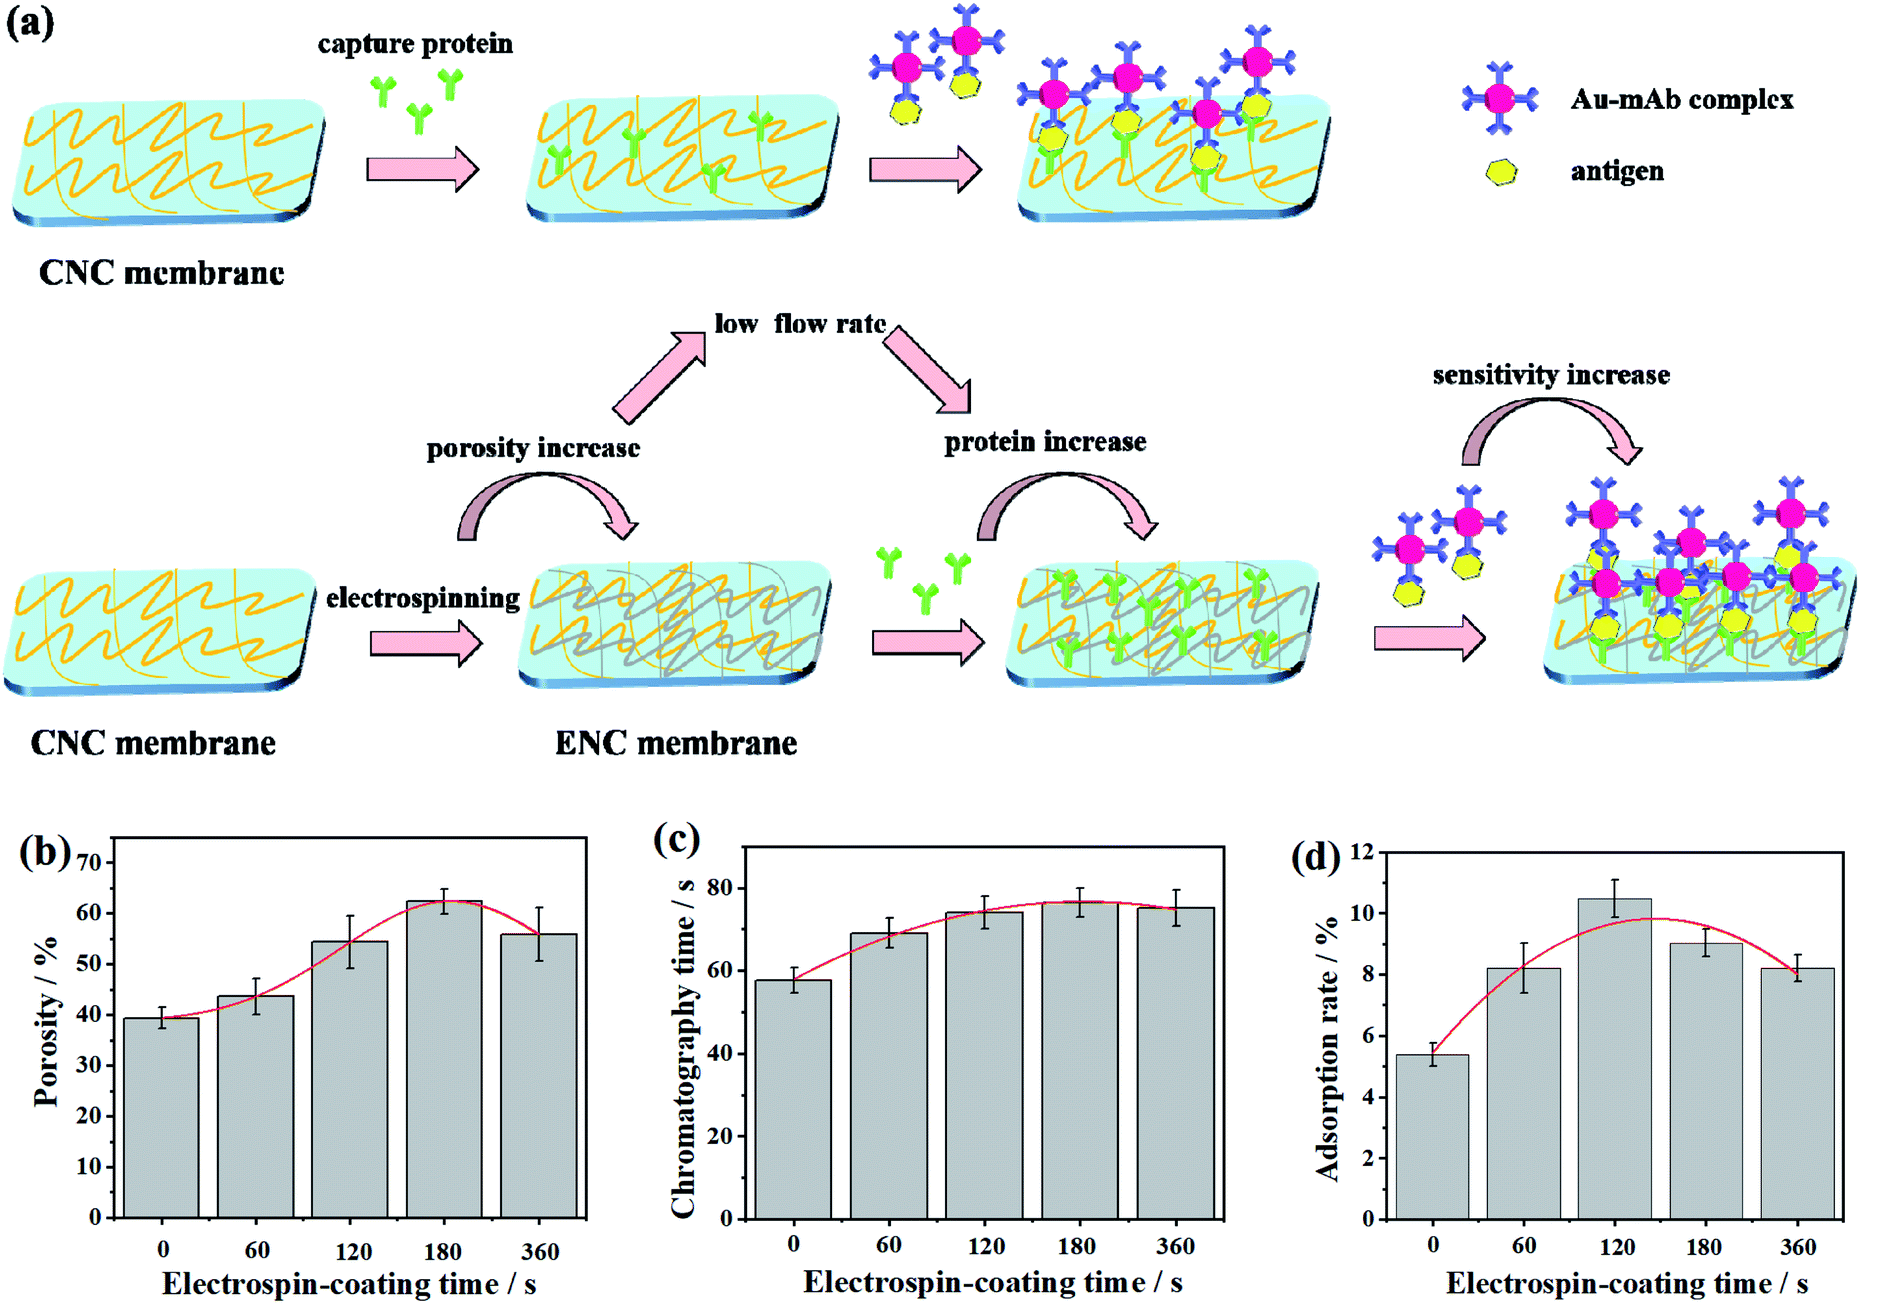 | ||
| Fig. 3 (a) A sandwich immunoassay with a conventional immunochromatographic strip (top) and an immunochromatographic strip with electrospin-coating NC membrane using antibody-conjugated Au nanoparticles (AuNPs) (bottom). (b) The relationship between the electrospin-coating time and porosity. (c) The relationship between the electrospin-coating time and chromatographic time. (d) The relationship between the electrospin-coating time and protein adsorption rate. | ||
Fig. 3b shows the relationship between electrospinning time and porosity. When the electrospinning time is 0, i.e., the sample is CNC membrane, the porosity is close to 40%. When the time increases, the fiber accumulation increases, the porosity reached 55% in 2 min. However, as the time goes on, the porosity increases first and then decreases, this is because overly accumulated fibers covered or blocked the pores of the membrane.
The histogram in Fig. 3c shows the difference of membrane velocity between CNC and ENC membrane. It can be seen that it takes 60 s for the liquid to cross the whole CNC membrane, while it takes more than 60 s for the ENC membrane. This indicates that the time of chromatography of ENC membrane is longer than that of the CNC membrane, which corresponds to the porosity changes in Fig. 3b. Fig. 3d shows that the adsorption rate of CNC membrane is 5.3%, and ENC-2 membrane is close to 12%, which is the highest in protein capacity and protein adsorption performance, it provides great convenience for immunoassay of ICT bands.
3.3 Test performance for HCG and LH detection
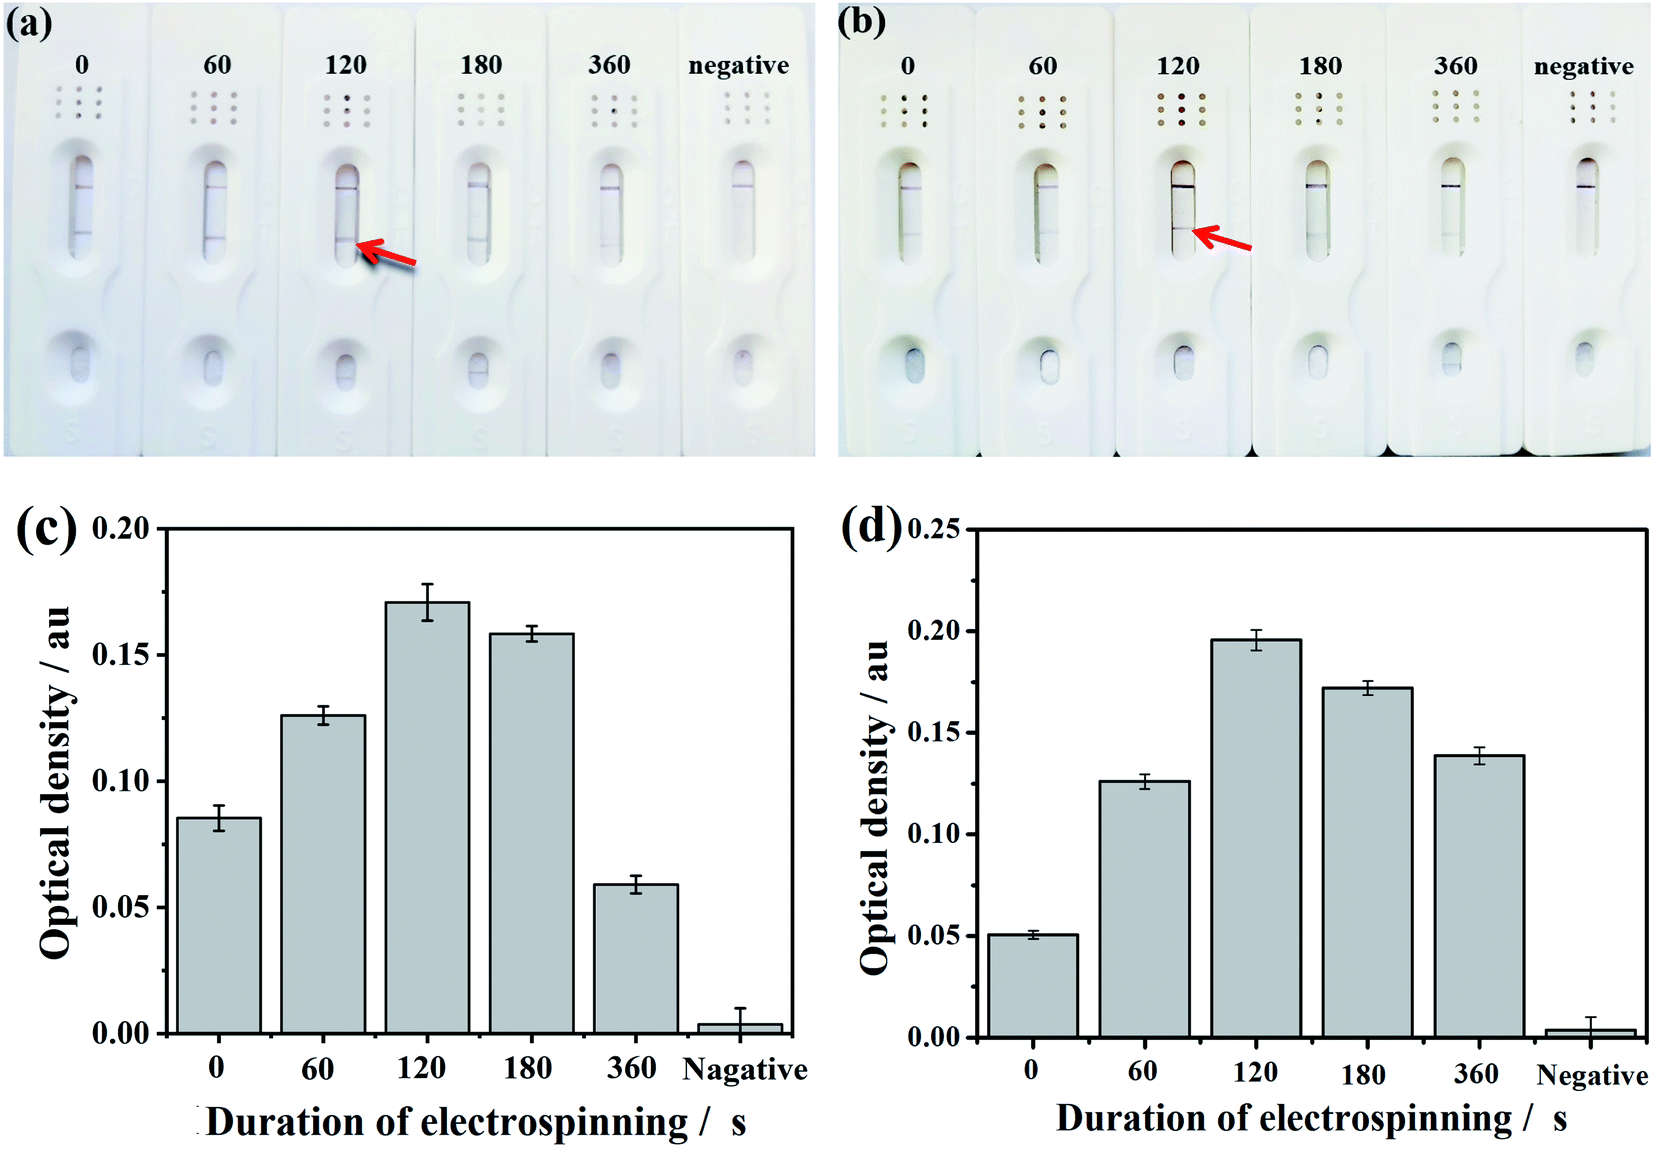 | ||
| Fig. 4 (a) CNC and ENC based LFA test strips after detecting HCG in which the number means the electrospinning time. (c) OD values corresponding to the T-lines in (a). (b) CNC and ENC based LFA test strips after detecting LH in which the number means the electrospinning time. (d) OD values corresponding to the T-lines in (b). The upper signal in the test strip represents the C-line, and the lower signal represents the T-line. | ||
 | ||
| Fig. 5 The sensitivity test of LFA strips based on the (a) CNC, (b) ENC-1, (c) ENC-2, (d) ENC-3, and (e) ENC-6 by detecting HCG antigen, and the number means the concentration of the HCG antigen, with the unit of mIU mL−1. The upper signal in the test strip represents the C-line, and the lower signal represents the T-line. | ||
 | ||
| Fig. 6 The sensitivity test of LFA strips based on the (a) CNC, (b) ENC-1, (c) ENC-2, (d) ENC-3, and (e) ENC-6 by detecting LH antigen, and the number means the concentration of the HCG antigen, with the unit of mIU mL−1. The upper signal in the test strip represents the C-line, and the lower signal represents the T-line. | ||
The enhancement of the sensitivity was obviously resulted from the electrospinning coating of NC fibers on the CNC membrane. This might be because that in one hand, the coating of electrospun NC fibers blocked some of the surface pores and then reduced the porosity of the membrane. In the other hand, the NC fibers coating improved the hydrophobicity of the membrane. Therefore, this coating extends the flow time of the solution on the membrane and increases the specific reaction time of the antigen and antibody in the ENC membrane, which can increase the sensitivity. However, overly loaded NC fibers on the membrane by extending the electrospinning time showed adverse effect. Therefore, the minimum detection limit of ENC-3 and ENC-6 only reached 1 mIU mL−1. This might be because overly loaded NC fibers deceased the protein absorption due to overly increased hydrophobicity.
Fresh urine samples from a pregnant woman and a non-pregnant woman were taken for detection respectively. The results of ENC-2 based test strip showed that the urine samples of pregnant women were positive, while the urine samples from non-pregnant women were negative. At the same time, when the urine sample from pregnant women was diluted from 100% to 50%, 25%, 10% and 5%, there were still T-line appeared, which indicated that the test strip is feasible to detect real urine samples.
 | ||
| Fig. 7 Correlation between concentration of (a) HCG and (b) LH and its optical density value. | ||
| Method applied | Linear range | LODsa | References |
|---|---|---|---|
| a mIU mL−1.b pg mL−1. | |||
| Electrochemical | 10–1000 pg mL−1 | 5b | Viet et al. 2019 (ref. 39) |
| Electrochemical immunoassay | 0.0212–530 mIU mL−1 | 0.0066 ± 0.02 | Roushani et al. 2016 (ref. 40) |
| Novel immunoassay | 0.03–1000 mIU mL−1 | 0.19 | Chen et al. 2019 (ref. 41) |
| Enzyme-catalyzed | 0.5–400 mIU mL−1 | 0.36 | Zhang et al. 2019 (ref. 42) |
| ICAs | 9–2304 mIU mL−1 | 9 | Zhang et al. 2019 (ref. 43) |
| Transistor immunosensors | 1–1 ng mL−1 | 1b | Haslam et al. 2018 (ref. 44) |
| Photothermal immunosensing | 0.01–100 ng mL−1 | 5.8b | Hong et al. 2019 (ref. 45) |
| LFA | 0.5–500 mIU mL−1 | 0.22 | This work |
 | ||
| Fig. 8 (a) ENC-2 based LFA test strips was specific for HCG antigen after detecting different antigens. (c) OD values corresponding to the T-lines in (a). (b) ENC-2 based LFA test strips was specific for LH antigen after detecting different antigens. (d) OD values corresponding to the T-lines in (b). The upper signal in the test strip represents the C-line, and the lower signal represents the T-line. | ||
In order to further show the specificity ability, we detected the OD values of different T-line. As can be seen in Fig. 8c, the OD value of HCG sample reached 0.20 a.u., which means high specificity property. Similarly, the LH test strip also has a good specific test result as shown in Fig. 8d.
Besides, this method has advantages compared with the other conventional methods for LFA, which utilizes the chemical properties of nanofibers to adsorb protein and adopts electrospinning technology to change the porosity of nanofibers for adjusting the protein load and flow rate, so as to improve the sensitivity. In addition, the electrospinning technology is a mature technology for preparing nano and micro fiber membranes. The membranes have high porosity, large specific surface area and uniform diameter distribution, showing high application value in biomedical,46,47 environmental engineering and textile fields. However, the traditional LFA method is different from this method in preparation process, so it has some shortcomings in regulating porosity, flow rate and protein loading.
4 Conclusion
A new AuNPs test strip was developed by electrospinning NC fibers on the surface of the CNC membrane to control flow rate with high sensitivity and selectivity. It was shown that the LODs for HCG and LH were 0.22 and 0.36 mIU mL−1, respectively, and the linear detection range was from 0.5 to 500 mIU mL−1. The sensitivities were significantly improved compared to the strip based on CNC membrane with an increased by 50 times. Therefore, this method has the possibility of greatly reducing the minimum detection limit and effectively increasing the sensitivity of instant detection. The AuNPs test strips are hopeful for satisfying the purpose for point of care testing, especially in resource-limited regions, which has broad application prospects.Ethical statement
The authors state that all experiments were performed in compliance with the relevant laws and institutional guidelines. The human urine samples were obtained from volunteers at the University of Science and Technology, and informed consent was obtained from all the volunteers.Author contributions
Xue Wang: responsible for the design, experiment, draft of the manuscript. Chao-Hua Xue: organized, supervised and guided the whole work. Dong Yang: provided experimental materials and guided the experiment. Shun-Tian Jia: provided instrument guidance and characterization assistance. Ya-Ru Ding: assisted testing and characterization. Lei Lei: assisted testing. Ke-Yi Gao: assisted characterization. Tong-Tong Jia: assisted experiments.Conflicts of interest
The authors declare that they have no known competing financial interests or personal relationships that could have appeared to influence the work reported in this paper.Acknowledgements
This work was supported by Natural Science Foundation of Shaanxi Province (2020JM-506), National Natural Science Foundation of China (51572161), major project of Ministry of Science and Technology of China (2017YFB0307700), the National Natural Science Foundation of China (21505089), and Postdoctoral Research Foundation of China (2017M13038).References
- H. Duan, X. L. Huang, Y. N. Shao, L. Y. Zheng, L. Guo and Y. H. Xiong, Anal. Chem., 2017, 89, 7062–7068 CrossRef CAS PubMed.
- Y. Chen, L. Guo, L. Liu, S. Son, H. Kuang and C. Xu, J. Agric. Food Chem., 2017, 65, 8248–8255 CrossRef CAS PubMed.
- O. Y. Hui, X. M. Tu, Z. F. Fu, W. Wang, S. Fu, C. Zhu, D. Du and Y. Lin, Biosens. Bioelectron., 2018, 106, 43–49 CrossRef PubMed.
- X. Liu, J. J. Xiang, Y. Tang, X. L. Zhang, Q. Q. Fu, J. H. Zou and Y. Lin, Anal. Chim. Acta, 2012, 745, 99–105 CrossRef CAS PubMed.
- K. Kim, H. A. Joung, G. R. Han and M. G. Kim, Biosens. Bioelectron., 2016, 85, 422–428 CrossRef CAS PubMed.
- S. Cinti, L. Fiore, R. Massoud, C. Cortese, D. Moscone, G. Palleschi and F. Arduini, Talanta, 2018, 179, 186–192 CrossRef CAS PubMed.
- L. Li, D. Yin, K. Xu, Y. Liu, D. Song, J. Wang, C. Zhao, X. Song and J. Li, J. Pharm. Biomed. Anal., 2017, 141, 79–86 CrossRef CAS PubMed.
- L. Zhang, Y. Chen, N. Cheng, Y. Xu, K. Huang, Y. Luo, P. Wang, D. Duan and W. Xu, Anal. Chem., 2017, 89, 10194–10200 CrossRef CAS PubMed.
- W. B. Wang, L. Q. Liu, S. S. Song, L. G. Xu, H. Kuang, J. P. Zhu and C. L. Xu, Sci. China Mater., 2016, 59, 665–674 CrossRef CAS.
- A. B. Ayoola, D. Slager, C. Feenstra and G. L. Zandee, J. Midwifery Womens Health, 2015, 60, 604–609 CrossRef PubMed.
- D. G. Tincello and D. H. Richmond, BMJ, 1998, 316, 435–437 CrossRef CAS PubMed.
- E. Marino, W. R. Threlfall and R. A. Schwarze, Theriogenology, 2009, 71, 877–883 CrossRef CAS PubMed.
- J. Hu, L. Wang, F. Li, Y. L. Han, M. Lin, T. J. Lu and F. Xu, Lab Chip, 2013, 13, 4352–4357 RSC.
- H. Zhen, S. Hu, Y. H. Xiong, H. Wei, H. Y. Xu, H. W. Duan and W. H. Lai, TrAC, Trends Anal. Chem., 2019, 114, 151–170 CrossRef.
- S. W. Zhang, T. Q. Yao, S. F. Wang, R. H. Feng, L. Q. Chen, V. V. Zhu, G. P. Hu, H. Zhang and G. W. Yang, Spectrochim. Acta, Part A, 2019, 214, 302–308 CrossRef CAS PubMed.
- Q. Chen, M. F. Qie, X. S. Peng, Y. Chen and Y. L. Wang, RSC Adv., 2020, 10, 3307–3313 RSC.
- M. F. Pan, J. Y. Yang, S. J. Li, G. Z. Wang, J. P. Wang and S. Wang, Anal. Methods, 2019, 11, 2027–2032 RSC.
- M. Zhang, T. Bu, Y. Tian, X. Sun, Q. Wang, Y. Liu, F. Bai, S. Zhao and L. Wang, Food Chem., 2020, 332, 127398 CrossRef CAS PubMed.
- C. Wang, C. Wang, X. Wang, K. Wang, Y. Zhu, Z. Rong, W. Wang, R. Xiao and S. Wang, ACS Appl. Mater. Interfaces, 2019, 11, 19495–19505 CrossRef CAS PubMed.
- X. F. Ruan, Y. J. Wang, E. Y. Kwon, L. M. Wang, N. Cheng, X. H. Niu, S. C. Ding, B. J. Van Wie, Y. Lin and D. Du, Biosens. Bioelectron., 2021, 184, 113238 CrossRef CAS PubMed.
- X. L. Fu, J. H. Wen, J. W. Li, H. Lin, Y. M. Liu, X. M. Zhuang, C. Y. Tiana and L. X. Chen, Nanoscale, 2019, 33, 1–8 Search PubMed.
- V. Tran, B. Walkenfort, M. Kçnig, O. Salehi and S. Schlcker, Angew. Chem., Int. Ed., 2019, 58, 442–446 CrossRef CAS PubMed.
- D. W. Bradbury, M. Azimi, A. J. Diaz, A. A. Pan, C. H. Falktoft, B. M. Wu and D. T. Kamei, Anal. Chem., 2019, 91, 12046–12054 CrossRef CAS PubMed.
- Z. Y. Lyu, S. C. Ding, N. Zhang, Y. Zhou, N. Cheng, M. Y. Wang, M. Xu, Z. X. Feng, X. H. Niu, Y. Cheng, C. Zhang, D. Du and Y. H. Lin, Research, 2020, 11, 1–11 CrossRef PubMed.
- X. H. Niu, X. Li, Z. Y. Lyu, J. M. Pan, S. C. Ding, X. F. Ruan, W. L. Zhu, D. Du and Y. H. Lin, Chem. Commun., 2012, 77, 1–17 Search PubMed.
- S. C. Ding, Z. Y. Lyu, L. Z. Fang, T. Li, W. L. Zhu, S. Q. Li, X. Li, J. C. Li, D. Du and Y. H. Lin, Small, 2021, 17, 25 Search PubMed.
- Y. Ryu, Z. W. Jin, M. S. Kang and H. S. Kim, BioChip J., 2011, 5, 193–198 CrossRef CAS.
- R. H. Tang, L. N. Liu, S. F. Zhang, A. Li and Z. D. Li, Microchim. Acta, 2019, 186, 831–838 CrossRef CAS PubMed.
- B. Zhang, W. Gao, J. Piao, Y. Xiao, B. Wang, W. Peng, X. Gong, Z. Wang, H. Yang and J. Chang, ACS Appl. Mater. Interfaces, 2018, 10, 14549–14558 CrossRef CAS PubMed.
- J. R. Choi, K. W. Yong and R. Tang, Adv. Healthcare Mater., 2016, 6, 1600920–1600928 CrossRef PubMed.
- J. R. Choi, Z. Liu, J. Hu, R. Tang, Y. Gong, S. Feng, H. Ren, T. Wen, H. Yang, Z. Qu and F. Xu, Anal. Chem., 2016, 88, 6254–6264 CrossRef CAS PubMed.
- R. Tang, H. Yang, Y. Gong, Z. Liu, X. Li, T. Wen, Z. Qu, S. Zhang, Q. Mei and F. Xu, Sci. Rep., 2017, 7, 1360–1369 CrossRef PubMed.
- C. Parolo, M. S. Mariana and M. Arben, Lab Chip, 2013, 13, 386–390 RSC.
- B. J. Toley, B. McKenzie, T. Liang, J. R. Buser, P. Yager and E. Fu, Anal. Chem., 2013, 85, 11545–11552 CrossRef CAS PubMed.
- M. Shen, Y. Y. Chen, M. Zhu and Y. Xu, Anal. Chem., 2019, 91, 4814–4820 CrossRef CAS PubMed.
- S. J. Reinholt, A. Sonnenfeldt, A. Naik, M. W. Frey and A. J. Baeumner, Anal. Bioanal. Chem., 2014, 406, 3297–3304 CrossRef CAS PubMed.
- Y. H. He, S. H. Hong, M. Wang, J. Wang, A. M. Abd El-Aty, J. Wang, H. Ahmet, M. Khan and Y. She, New J. Chem., 2020, 44, 6026–6036 RSC.
- C. T. Yew, P. Azari, J. R. Choi and F. Li, Anal. Chim. Acta, 2018, 1009, 81–88 CrossRef CAS PubMed.
- N. X. Viet, N. X. Hoan and Y. Z. Takamura, Mater. Chem. Phys., 2019, 227, 123–129 CrossRef.
- M. Roushani and A. Valipour, Microchim. Acta, 2016, 183, 845–853 CrossRef CAS.
- J. Chen, L. W. Hao, Y. Q. Wu, T. Lin, X. Li, Y. K. Leng, X. L. Huang and Y. H. Xiong, Chem. Commun., 2019, 55, 10312–10315 RSC.
- Z. Zhang, G. L. Xu, L. Xie and Y. P. Guan, Microchim. Acta, 2019, 186, 581–589 CrossRef PubMed.
- W. Zhang, H. Duan, R. Chen, T. Ma, L. Zeng, Y. Leng and Y. Xiong, Talanta, 2019, 194, 604–610 CrossRef CAS PubMed.
- C. Haslam, S. Damiati, T. Whitley, P. Davey, E. Ifeachor and S. A. Awan, Diagnostics, 2018, 8, 5–17 CrossRef PubMed.
- G. Hong, D. Zhang, Y. He, Y. Yang, P. Chen, H. Yang, Z. Zhou, Y. Liu and Y. Wang, Anal. Bioanal. Chem., 2019, 411, 6837–6845 CrossRef CAS PubMed.
- I. Cruz-Maya, A. Varesano, C. Vineis and V. Guarino, Polymers, 2020, 12, 1671–1679 CrossRef CAS PubMed.
- Y. Guo, J. Gilbert-Honick, S. M. Somers, H. Q. Mao and W. L. Grayson, Biochem. Biophys. Res. Commun., 2019, 516, 1–7 CrossRef PubMed.
Footnote |
| † Electronic supplementary information (ESI) available. See DOI: 10.1039/d1ra04369b |
| This journal is © The Royal Society of Chemistry 2021 |