DOI:
10.1039/D1RA04293A
(Paper)
RSC Adv., 2021,
11, 32549-32558
Regulation of microglia polarization via mannose receptor-mediated delivery of siRNA by ligand-functionalized DoGo LNP†
Received
3rd June 2021
, Accepted 23rd September 2021
First published on 4th October 2021
Abstract
The pro-inflammatory polarization of microglia after stroke is one of the major causes of secondary brain injury. Downregulation of the gene involved in canonical inflammatory pathways in glial cells can exert neuroprotective effects via inhibiting the release of pro-inflammatory factors. In this study, we functionalized DoGo lipids with mannose, the ligand of the mannose receptor (MR) that is expressed in microglia, and evaluated the MR-mediated cellular internalization of DoGo lipid nanoparticles (denote M3) carrying siRNA against TLR4 in BV2 cells in vitro. We confirmed that siTLR4/M3 complexes were specifically internalized by BV2 cells in a MR-dependent manner, and the treatment of oxygen glucose deprivation (OGD)-treated BV2 cells with siTLR4/M3 complexes resulted in remarkable silencing of TLR4, and induced downregulated M1 polarization and upregulated M2 polarization markers. Collectively, our data suggest that the M3 lipoplex is a promising microglia-targeting siRNA delivery agent.
1. Introduction
RNA interference (RNAi) is an RNA-dependent gene silencing process with great therapeutic potential.1,2 It results in the cleavage of target messenger RNA (mRNA) by small interfering RNAs (siRNA) bound to the RNA-induced silencing complex (RISC). To date, RNAi has been the method of choice for researchers wishing to target specific genes for silencing. Currently, three siRNA-based drugs approved by US FDA are in phase III clinical trials, including Onpattro (patisiran),3 Givlaari (givosiran),4 and Oxlumo (lumasiran).5 Another drug, Leqvio (inclisiran), is currently in development and has been approved by the European Union.6 Despite such tremendous progress at the clinical level, siRNA therapies still face several challenges due to their nuclease susceptibility and off-target effects.7–9 For these reasons, much effort has been put in the development of safe and efficient siRNA delivery systems. Among them, lipidic nanoparticles are the first drug delivery system to be transformed from concept to clinical application, and they are now an established technology platform with considerable clinical acceptance.10
However, specific binding to complementary receptors overexpressed on cell surfaces can achieve targeted delivery of siRNA.11,12 The mannose receptor (Cluster of Differentiation 206, CD206) is a pattern-recognition receptor mainly expressed by macrophages and, within the brain, by microglia and astrocytes.13,14 Microglia activation after stroke is thought to be a typical feature of neuroinflammation process.15,16 The activated microglia can polarize to many phenotypes in vitro or in vivo.17 Inflammatory phenotype, also known as M1 phenotype, can produce a variety of mediators (such as oxide synthase (iNOS), nitric oxide (NO), and insulin-like growth factor 1 (IGF-1), etc.18). Anti-inflammatory phenotype, known as M2 phenotype, display enhance the expressions of CD206, IL-10, and TGF-β, etc.19,20 However, deficiency of TLR4 inhibit the expressions of TNF-α, iNOS, and COX2, and conduced the reduction of brain infarct volume and improvement of neurogenesis.21,22
Our previous studies have shown that the DoGo lipids can efficiently deliver siRNA in vitro and in vivo, with D-type being more efficient.23,24 Therefore, in this study we designed novel mannose-functionalized D-DoGo lipids, to cell type specifically deliver siRNA to microglia using oxygen glucose deprivation (OGD) treated in BV2-microglia cell as a model. We demonstrated that the receptor-mediated delivery of siRNAs can decrease the expression of iNOS and promote the expression of CD206 by silencing the expression of TLR4 in BV2-microglia OGD model. The results showed that the lipoplex had very low toxicity, high transfection efficiency, effective inhibition of M1 phenotype markers and promotion of M2 phenotype markers, which had a good reference for the research field of stroke treatments.
2. Materials and methods
Chemicals
Boc-D-Glu-OH, oleylamine, D-glucuronic acid, Boc-5-aminovaleric acid, D-mannose, HBr (33% in acetic acid), 1,4-butanediol, Ag2CO3, anhydrous CaSO4, N,N-diisopropylethylamine (DIPEA), and 1-ethyl-3-(3-dimethylaminopropyl)carbodiimide hydrochloride (EDCI) were purchased from Aladdin Chemicals (Shanghai, China). 1H-Benzotriazol-1-yloxytripyrrolidinophosphonium hexafluorophosphate (PyBOP) and 4-nitrophenyl chloroformate were purchased from TCI Chemicals (Shanghai, China).
Synthesis of D-Val-DoGo1
D-DoGo1 (500 mg, 0.77 mmol), Boc-5-aminovaleric acid (251 mg, 1.16 mmol), PyBop (604 mg 1.16 mmol), and N,N-diisopropylethylamine (192 μL, 1.16 mmol) were dissolved in dichloromethane (3 mL), the mixture was stirred at room temperature under nitrogen atmosphere for overnight. Followed by washed with distilled water, brine, dried over anhydrous Na2SO4, then purified by silica gel chromatography using dichloromethane and methanol (10![[thin space (1/6-em)]](https://www.rsc.org/images/entities/char_2009.gif) :1) as eluent. D-Val-DoGo1 was obtained as an oil after the evaporation of the purified solution into dryness. The yield was 89%. D-Val-DoGo1 was dissolved in a mixture of dichloromethane and trifluoroacetic acid (v/v = 1/1), and vigorously stirred in room temperature for 30 min, the solvents were removed by evaporation and then washed with dichloromethane twice. D-Val-DoGo1 was obtained as white solid. 1H NMR (DMSO-d6, ppm): 0.84–0.87 (t, 6H, –CH3), 1.24–1.37 (m, 48H, –CH2–), 1.51–1.52 (m, 6H, NH2–CH2CH2–, NH2–CH2CH2CH2–, NH2–CH2CH2CH2CH2–), 1.94–1.96 (m, 2H, –NHCOCH2–), 1.98–2.06 (m, 8H, –CH2CH
:1) as eluent. D-Val-DoGo1 was obtained as an oil after the evaporation of the purified solution into dryness. The yield was 89%. D-Val-DoGo1 was dissolved in a mixture of dichloromethane and trifluoroacetic acid (v/v = 1/1), and vigorously stirred in room temperature for 30 min, the solvents were removed by evaporation and then washed with dichloromethane twice. D-Val-DoGo1 was obtained as white solid. 1H NMR (DMSO-d6, ppm): 0.84–0.87 (t, 6H, –CH3), 1.24–1.37 (m, 48H, –CH2–), 1.51–1.52 (m, 6H, NH2–CH2CH2–, NH2–CH2CH2CH2–, NH2–CH2CH2CH2CH2–), 1.94–1.96 (m, 2H, –NHCOCH2–), 1.98–2.06 (m, 8H, –CH2CH![[double bond, length as m-dash]](https://www.rsc.org/images/entities/char_e001.gif) CHCH2–), 2.15–2.16 (m, 2H, –NHCOCH2CH2–), 2.97–2.99 (t, 2H, NH2–CH2–), 3.00–3.01 (m, 4H, NHCOCH2–), 4.18–4.19 (m, 1H, OCCH(NH–)CH2–), 5.32–5.36 (m, 4H, –CHCH–), 7.66–7.94 (m, 5H, –CONH–, –NH2). 13C NMR (DMSO-d6, ppm): 14.30 (CH3), 21.10–24.39 (NH2CH2CH2CH2–), 26.81–27.29 (–CH2–), 28.93–29.62 (–NHCOCH2–, –NHCOCH2CH2–), 31.22–34.83 (NH2CH2–, NH2CH2CH2CH2–, NH2CH2CH2CH2CH2–, NHCOCH2–, –CH2CHCHCH2–), 52.75 (OCCH(NH–)CH2–), 130.02–130.46 (–CHCH–), 158.42–159.27 (NHCOCH(NH–)CH2–, CH2CH2CONHCH2–), 171.52–174.56 (NH2(CH2)4CO–). MS (ESI) m/z 745.6999 [M + H]+. (Calcd for C46H89N4O3, 744.6856.)
CHCH2–), 2.15–2.16 (m, 2H, –NHCOCH2CH2–), 2.97–2.99 (t, 2H, NH2–CH2–), 3.00–3.01 (m, 4H, NHCOCH2–), 4.18–4.19 (m, 1H, OCCH(NH–)CH2–), 5.32–5.36 (m, 4H, –CHCH–), 7.66–7.94 (m, 5H, –CONH–, –NH2). 13C NMR (DMSO-d6, ppm): 14.30 (CH3), 21.10–24.39 (NH2CH2CH2CH2–), 26.81–27.29 (–CH2–), 28.93–29.62 (–NHCOCH2–, –NHCOCH2CH2–), 31.22–34.83 (NH2CH2–, NH2CH2CH2CH2–, NH2CH2CH2CH2CH2–, NHCOCH2–, –CH2CHCHCH2–), 52.75 (OCCH(NH–)CH2–), 130.02–130.46 (–CHCH–), 158.42–159.27 (NHCOCH(NH–)CH2–, CH2CH2CONHCH2–), 171.52–174.56 (NH2(CH2)4CO–). MS (ESI) m/z 745.6999 [M + H]+. (Calcd for C46H89N4O3, 744.6856.)
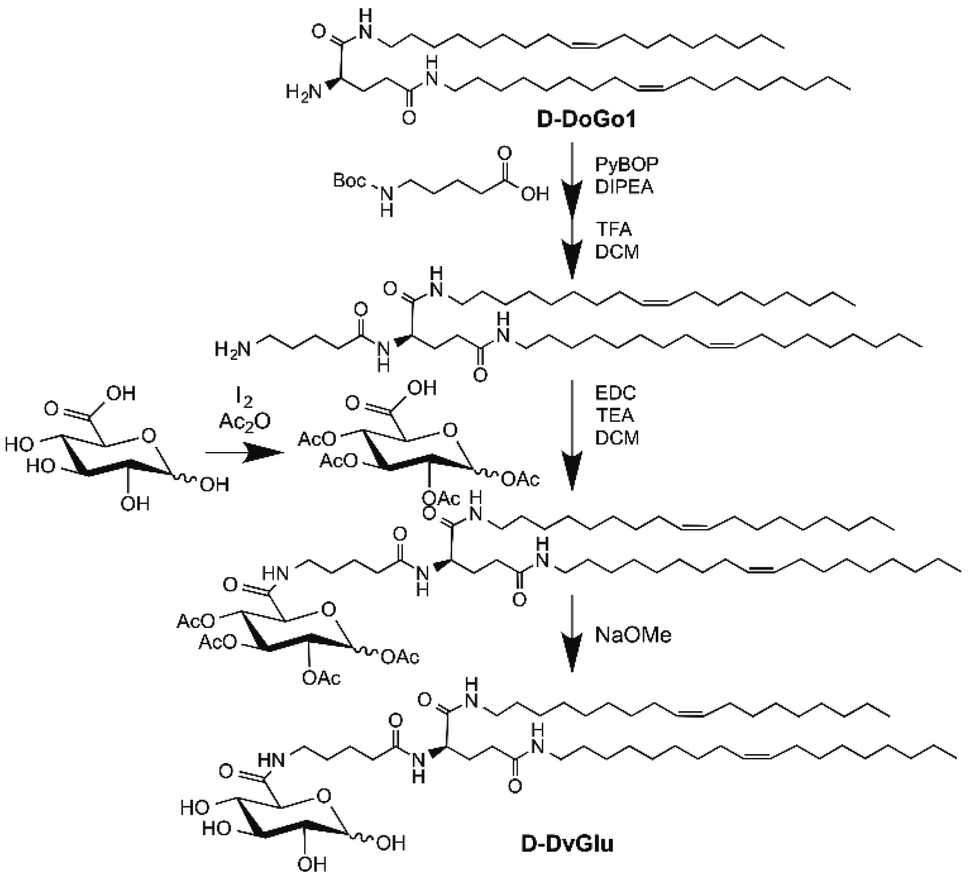
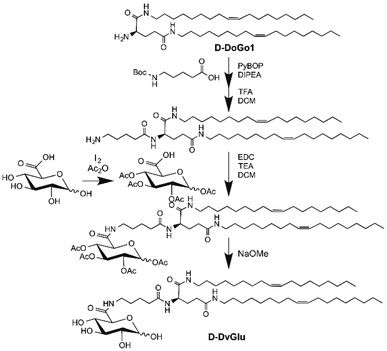
Synthesis of D-DvGlu
D-Glucuronic acid (1000 mg, 5.15 mmol) was suspended in acetic anhydride as solvent, and stirred at 0 °C. Iodine (80 mg, 0.31 mmol) was added slowly and the red solution was stirred for 2 h in ice bath, the further 3 h at room temperature. After completion of the reaction, excess acetic anhydride was mostly removed in vacuo and the remaining mixture was taken up in dichloromethane. The organic layer was then washed twice with Na2S2O3 (1 M), dried on anhydrous Na2SO4 and concentrated to afford target compound as oily liquid. 1H NMR (DMSO-d6, ppm): 1.91–2.19 (m, 12H, –COCH3), 4.51–4.53 (d, 1H, H-5), 4.93–4.97 (t, 1H, H-3), 5.04–5.07 (t, 1H, H-2), 5.45–5.49 (t, 1H, H-4), 5.99–6.01 (d, 1H, H-1), 13.13–13.39 (s, 1H, H-6). 13C NMR (DMSO-d6, ppm): 20.98–21.42 (CH3, –COCH3), 67.91–72.14 (C-2-C5), 91.13 (C-1), 167.56–169.71 (CO, –COCH3).
A mixture of AcGlu (200 mg, 0.55 mmol), D-Val-DoGo1 (341 mg, 0.46 mmol), and triethylamine (77 μL, 0.55 mmol) were dissolved in dry dichloromethane (3 mL), after the mixture was cooled to 0 °C, the EDC reagent (105 mg, 0.55 mmol) was added and further stirred at room temperature under nitrogen atmosphere for overnight. Followed by washed with distilled water, saturated brine, and dried over anhydrous Na2SO4. The mixture was purified by silica gel chromatography using dichloromethane and methanol (15:1) as eluent. The D-DvGlu was obtained as a powder in 83% yield. 1H NMR (DMSO-d6, ppm): 0.84–0.87 (t, 6H, –CH3), 1.34–1.46 (m, 52H, –CH2–), 1.161–2.14 (m, 26H, COCH3, H-9, H-11, H-12, H-14), 2.97–3.22 (m, 6H, H-6, H-13), 4.25–4.27 (m, 2H, H-5, H-10), 4.98 (t, 1H, H-3), 5.09 (t, 1H, H-4), 5.31–5.43 (m, 4H, –H2CCH2–), 5.95–5.97 (m, 2H, H-1, H-2), 7.73–8.18 (m, 4H, –NH–). 13C NMR (DMSO-d6, ppm): 14.38 (CH3), 20.74–22.54 (CH3, COCH3), 26.77–29.55 (C-6-C-9, C-11-C-14), 52.99 (C-10), 68.05–72.15 (C-2-C-5), 90.79 (C-1), 130.07 (–H2CCH2–), 169.15–169.52 (CO, COCH3). MS (ESI) m/z 1089.7567 [M + H]+. (Calcd for C60H104N4O13, 1088.7600.)
D-DvGlu was dissolved in a mixture of MeOH/NaOH. After vigorously stirred at room temperature for 1 h. The mixture was neutralized by 1 M HCl and the solvents were evaporated, then washed twice with distilled water, saturated brine, dried on anhydrous Na2SO4 and concentrated to afford D-DvGlu as a colorless oil in 75% yield. 1H NMR (DMSO-d6, ppm): 0.84–0.86 (m, 6H, CH3), 1.24–1.47 (m, 54H, –CH2–), 1.62–2.11 (m, 12H, H-11, H-12, H-14), 2.97–3.28 (m, 6H, H-6, H-13), 3.31–3.51 (m, 3H, H-2-H-4), 3.92–3.94 (d, 1H, OH-1), 4.14–4.22 (m, 1H, H-10), 4.55–4.61 (t, 1H, OH-3), 4.92–5.10 (m, 2H, OH-2, OH-4), 5.31–5.33 (m, 4H, –H2CCH2–), 6.45–6.50 (d, 1H, H-5), 6.73–6.77 (t, 1H, H-1), 7.72–7.92 (m, 4H, –NH–). 13C NMR (DMSO-d6, ppm): 14.40 (CH3), 22.55 (–CH2–), 27.02–31.74 (C-6, C-9, C13, C-14), 52.64–53.69 (C-10), 71.94–72.98 (C-2-C-5), 93.23 (C-1), 130.08 (–H2CCH2–), 171.55 (–CO–). MS (ESI) m/z 921.7214 [M + H]+. (Calcd for C52H96N4O9, 920.7177.)
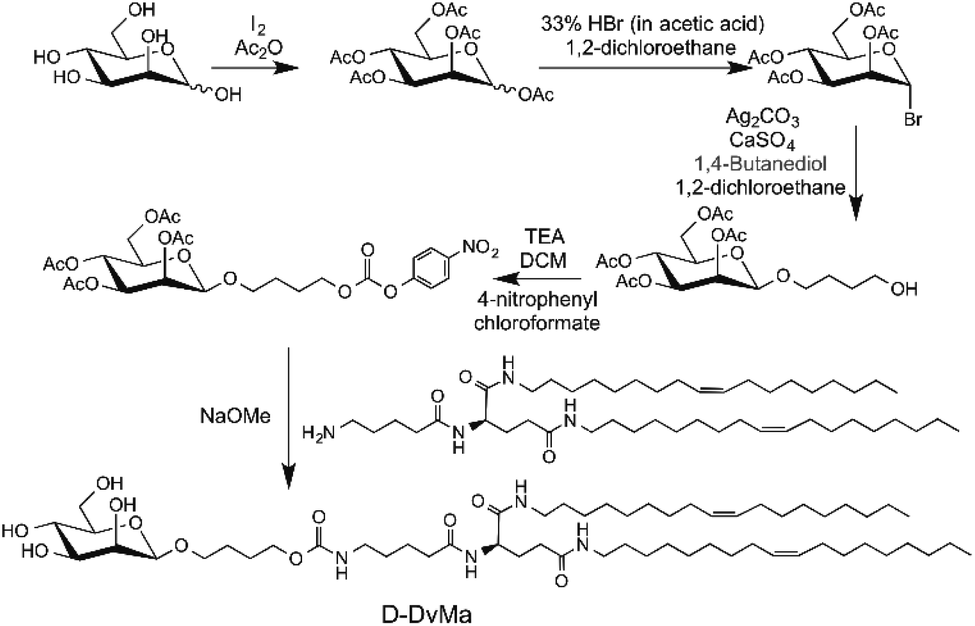
Synthesis of D-DvMa
Step 1. Mannose (500 mg, 2.78 mmol) was suspended in acetic anhydride as solvent and stirred at ice bath. Iodine (130 mg, 0.52 mmol) was added slowly and the red solution was stirred for 2 h in ice bath, then further 3 h at room temperature. After completion of the reaction excess acetic anhydride was mostly removed in vacuo and the remaining mixture was taken up in dichloromethane. The organic layer was then washed twice with Na2S2O3 (1 M), distilled water, and brine, dried on anhydrous Na2SO4 and concentrated to afford target compound and oily liquid. The yield was 92%. 1H NMR (DMSO-d6, ppm): 1.91–2.22 (15H, m, COCH3), 4.01–4.18 (2H, m, H-6), 5.16–5.22 (4H, overlapped, H-2-H-5), 5.96–6.09 (1H, d, H-1). 13C NMR (DMSO-d6, ppm): 20.89–21.44 (CH3, –COCH3), 62.00 (C-6), 65.37 (C-5), 68.30 (C-2), 68.77 (C-3), 70.24 (C-5), 90.43 (C-1), 168.68–170.41 (CO, –COCH3).
Step 2. Hydrogen bromide (33% solution in acetic acid, 5 mL) was dropwise added to a solution of Acmannose (200 mg, 0.51 mmol) in a mixture of 1,2-dichloroethane (3 mL), and the solution was stirred at room temperature under nitrogen atmosphere for overnight. The solvents were removed by evaporation, the remaining mixture was poured into ice water, and this was followed by three extraction with dichloromethane. The dichloromethane was successively washed with saturated NaHCO3 and brine, dried on anhydrous Na2SO4, and concentrated to produce Ac–Ma–Br as an oil. Ag2CO3 (1260 mg, 4.57 mmol), CaSO4 (761 mg, 4.94 mmol), an iodine crystal (catalyst), and 1,4-butanediol (3130 μL, 35 mmol) were stirred for 15 min at room temperature under nitrogen. Ac–Ma–Br was added and mixture was stirred for further 24 h. After addition of dichloromethane, the mixture was filtered through Celite. To the biphasic filtrate water was added, and the aqueous phase was separated and extracted with dichloromethane. The combined organic layers were washed with water and brine and dried over Na2SO4. The solvent was evaporated and the remainder purified by silica gel chromatography using ethyl acetate and petroleum (2:1) as eluent. The Ac–Ma–OH was obtained as oil in 85% yield. 1H NMR (DMSO-d6, ppm): 1.43–1.47 (2H, m, HOCH2CH2CH2–), 1.60 (2H, m, HOCH2CH2–), 1.91–2.03 (12H, m, COCH3), 2.10–2.11 (2H, t, HO(CH2)3CH2–), 3.38–3.43 (2H, m, HOCH2–), 3.80–3.81 (1H, t, –OH), 3.98–4.13 (4H, overlapped, H4-6), 4.95–4.96 (1H, t, H-3), 5.02–5.22 (2H, m, H-1, H-2). 13C NMR (DMSO-d6, ppm): 20.69–20.96 (COCH3), 25.22–25.37 (HOCH2CH2CH2–), 29.27–29.71 (HOCH2CH2–), 60.73–64.25 (HOCH2–, C-6), 66.34–71.80 (C-2-C5, HO(CH2)3CH2–), 91.45–94.39 (C-1), 169.95–170.51 (–COCH3).
Step 3. Ac–Ma–OH was dissolved in acetonitrile, and then dropwise added a solution of 4-nitrophenyl chloroformate and pyridine in acetonitrile, the mixture was stirred for overnight at room temperature under nitrogen atmosphere. The solvent was evaporated and the remainder was dissolved in ethyl acetate and washed with water, 1 M HCl, and brine. The organic layer was dried with anhydrous Na2SO4, concentrated, and purified by silica gel chromatography using ethyl acetate and petroleum (2:1) as eluent. The Ac–Ma–Cl was obtained as green oil in 78% yield. 1H NMR (DMSO-d6, ppm): 1.57–1.62 (2H, m, –CHOCH2CH2–), 1.71–1.73 (2H, m, –CHOCH2CH2CH2–), 1.93–2.09 (12H, m, COCH3), 4.05–4.10 (2H, t, –CHOCH2–), 4.24–4.28 (–CHOCH2CH2CH2CH2–), 4.52 (2H, d, H-6), 5.06–5.21 (2H, m, H-4, H-5), 5.30 (1H, m, H-2), 5.41 (1H, m, H-3), 5.64 (1H, d, H-1), 7.55–7.57 (2H, m, O2NCCHCH–), 8.30–8.32 (2H, m, O2NCCH). 13C NMR (DMSO-d6, ppm): 25.21–25.32 (COCH3), 25.66–25.94 (–CHOCH2CH2–), 62.22–62.65 (C-4), 65.84–66.44 (–CHOCH2CH2CH2CH2–), 68.95–69.98 (C-2), 70.91–71.52 (C-3), 76.05–77.50 (C-5), 97.32–97.89 (C-1), 123.05–124.26 (O2NCCHCH–, O2NCCHCHCH–), 125.82–126.62 (O2NCCH), 145.63 (O2NCH–), 152.49 (–OCOO–), 155.81 (COOCH–), 169.86–170.17 (COCH3).
Step 4. Ac–Ma–Cl (400 mg, 0.68 mmol) was dissolved in dry dichloromethane (2 mL), the D-Val-DoGo1 (764 mg, 1.02 mmol) and N,N-diisopropylethylamine (225 μL, 1.36 mmol) were added, the reaction was performed at room temperature under nitrogen atmosphere for overnight. Followed by washed with distilled water, saturated brine, and dried over anhydrous Na2SO4. The mixture was purified by silica gel chromatography using dichloromethane and methanol (10:1) as eluent. The D-DvMa was obtained as colorless oil in 58% yield. 1H NMR (DMSO-d6, ppm): 0.84–0.86 (6H, t, –CH3), 1.23–1.81 (56H, m, H-8, H-9, H-12, H-13, –CH2–), 1.92–2.14 (26H, overlapped, H-14, H-16, H-17, H-19, COCH3), 2.92–3.07 (6H, overlapped, H-11, H-18), 3.39–3.47 (2H, t, H-7), 3.89–4.18 (5H, overlapped, H-5, H-6, H-10), 4.49–4.50 (1H, m, H-15), 4.87–5.10 (3H, overlapped, H-2, H-3, H-4), 5.24–5.42 (4H, m, –H2CCH2–), 5.62–5.63 (1H, d, H-1), 7.02–7.04 (1H, t, OCONH–), 7.72–7.85 (3H, overlapped, CONH(CH), CONH(CH2)–). 13C NMR (DMSO-d6, ppm): 14.21 (–CH3), 20.33–22.86 (–COCH3), 25.92–26.96 (C-13, C-16, C-17), 28.75–29.80 (–CH2–), 31.81–32.56 (C-14, C-19), 35.26 (C-18), 38.97 (C-11), 52.51 (C-15), 61.35–62.20 (C-6, C-7, C-10), 65.81 (C-4), 70.18 (C-2, C-3), 77.50 (C-5), 123.93 (C-1), 130.08 (–H2CCH2–), 171.66–172.38 (–CO–). MS (ESI) m/z 1191.8251 [M + H]+. (Calcd for C65H115N4O15, 1190.8281.)
Step 5. D-DvMa was dissolved in a mixture of MeOH/NaOH. After vigorously stirred at room temperature for 1 h. The mixture was neutralized by 1 M HCl and the solvents were evaporated, then washed twice with distilled water, saturated brine, dried on anhydrous Na2SO4 and concentrated to afford D-DvMa as a colorless oil in 50% yield. 1H NMR (DMSO-d6, ppm): 0.84–0.86 (6H, m, –CH3), 1.21–1.48 (58H, m, –CH2–), 1.64–2.13 (12H, m, H-16, H-17, H-19), 2.95–3.29 (6H, m, H-11, H-18), 3.41–3.64 (4H, m, H-7, H-10), 4.03–4.37 (5H, m, H-2, H-3, H-4, H-6), 4.47 (1H, t, H-15), 4.53–5.03 (4H, m, OH-2, OH-3, OH-4, OH-6), 5.31–5.35 (4H, m, H2CCH2–), 5.72–5.76 (1H, d, H-5), 5.88 (1H, d, H-1), 7.28 (1H, t, –NH–), 7.73–7.87 (3H, m, –NH–). 13C NMR (DMSO-d6, ppm): 14.59 (–CH3), 22.54–29.62 (C-8, C-9, C-12, C-13, C-17, –CH2–), 31.74 (C-16), 32.39 (C-14), 35.23 (C-18), 39.51–39.85 (C-11), 52.73 (C-15), 61.53 (C-6), 66.91 (C-10), 67.86 (C-7), 70.16 (C-4), 71.10 (C-2), 76.27 (C-3), 94.36 (C-5), 130.09–130.53 (–H2CCH2–), 154.83 (–CO–), 171.60–176.09 (–CO–). MS (ESI) m/z 1023.7822 [M + H]+. (Calcd for C57H107N4O11, 1022.7858.)
Preparation and characterization of D-DvGlu and D-DvMa lipoplex
Stock solutions of D-DvGlu (or D-DvMa), D-DoGo2, dioleoylphosphatidylethanol-amine (DOPE) cholesterol and DPPE-mPEG (Nanocs Inc., New York, NY, USA) were prepared in chloroform and mixed in 5% (10% and 15%), 50%, 20%, 10% and 5% respectively. Then the solvent was removed by reduced pressure and dried under high vacuum. 1× PBS (pH = 7.4) was added to the powder, followed by extruding through a membrane with 100 nm pore size for 20 times by using Avanti Mini Extruder (Avanti Polar Lipids, Alabaster, Alabama, USA). The resulting lipoplex stock solution had total lipid concentration of 2.5 mg mL−1. The size distribution of D-DvGlu and D-DvMa lipoplex were measured on Malvern Zetasizer Nano S instrument.
Electrophoretic mobility shift assay
siRNA/D-DvGlu or D-DvMa complexes were formed at various N/P ratios in a gel mobility shift assay. The mixtures were incubated at r.t. for 20 min and then subjected to electrophoresis on agarose gel (2%) for 30 min at 100 V to confirm the siRNA complexation in 1× Tris/borate/ethylenediaminetetraacetic acid (EDTA) running buffer. After the gel was stained using 0.5 μg mL−1 ethidium bromide, the banding pattern was obtained using a Gel Logic 212 PRO imaging system (Carestream, Toronto, Canada).
Enzyme and serum stability assay
siRNA (1 μL, 50 μM) and D-DvGlu (or Ma) lipoplex (3 μL, 2.5 mg mL−1) were mixed at a N/P ratio of 3. Trypsin or serum (6 μL, 50% solution) was added and the mixture was incubated at 37 °C for 2 h. The resulting complexes were subjected to agarose gel (1%) electrophoresis analysis.
Cell culture and cytotoxicity assay
The immortalized BV2 microglia cells employed for in vitro experiments was derived from the C57BL/6 mice and revealed phenotypic and functional characteristics of primary microglia and are often used as substitutes for primary microglia.25,26 BV2, C8-D1A, and N2a cells (ATCC, Manassas, VA, USA) were maintained at 37 °C (with 5% CO2) in DMEM supplemented (10% fetal bovine serum), 100 mg mL−1 streptomycin and 100 U mL−1 penicillin. For cytotoxicity assay, cells were plated onto 96-well plates at 1 × 10⁴ cells per well in 100 μL of culture medium. Twenty-four hours after plating, lipoplex stock solutions (2.5 mg mL−1) at different final concentrations at 100, 200, 300, 400, 500 μg mL−1 were added to the cells in triplicate and incubated as described above. After a 24 h of incubation, cell viability was assayed using the MTT test.
Heparin competition assay
The siRNA release from siRNA/G3 or M3 complexes were assessed by co-incubation with heparin as a competitive binding agent. Briefly, G3 or M3 nanoparticles (7.5 μg) and siRNA (100 μM) were complexed in 15 μL of 20 mM N-(2-hydroxyethyl)piperazine-N′-ethanesulfonic acid buffer, pH 7.2. Complexes were then incubated with various amounts of heparin sodium salt solution (0.5, 5, and 10 μg) for 15 min at r.t. Then, the released free siRNA was analyzed by agarose gel electrophoresis.
The determination of hemolytic effect
To determine the hemolytic effect, 2% red blood cells were incubated with G3 or M3 lipoplex and siRNA/G3 or siRNA/M3 complexes at different concentrations. PEI was used as the comparison group, and phosphate-buffered saline (PBS) and 1% Triton X 100 were used as the negative and positive control, respectively. After incubation for 2 h at 37 °C, the mixture was centrifuged at 2200 rpm for 10 min to obtain the supernatant. The transmittance at 450 nm was determined by FilterMax F5 Multi-Mode Microplate Reader (Molecular devices, CA, USA). The hemolysis was calculated with the following formula:
| Hemolysis (%) = (Asample − APBS)/(ATriton − APBS) × 100%. |
Cellular uptake of BV2 and C8-D1A cells
In order to verify the transfection ability of G3 and M3, FITC-siRNA transfection experiments were conducted on BV2 and C8-D1A cells. BV2 or C8-D1A were seeded at 70% cell confluency in a 24-well plate (Costar, Corning Inc.) and were cultured overnight. Then, the FITC-siRNA/G3 or M3 complexes were added to the cell cultures and incubated in a cell-culturing incubator. FITC-siRNA were synthesized by Takara Biotechnology Co., Ltd. (Dalian, Liaoning, China). Before adding the complexes into the cell culture, the mixtures were incubated at r.t. for 20 min. The concentrations were as follows: FITC-siRNA (50 nM)/G3 or M3 (25 μg mL−1). After incubation for 6 h, the cells were washed with 1× PBS (pH = 7.4) and quantified the fluorescence intensity by flow cytometry.
Fluorescence quenching
To more accurately measure the binding N/P ratio of lipoplex and siRNA, the fluorescence quenching experiment was adopted. The details are as follows: G3 or M3 were mixed with FITC-siRNA at different N/P ratios according to the steps of electrophoretic mobility shift assay. The fluorescence intensities were measured at 520 nm by Fluorescence Spectrophotometers (Hitachi High Technologies, F-4600) instrument until the fluorescence was completely quenched. And then, calculate the KD value according to the Stern–Volmer equation: F0/F = 1 + KD[Q], F0 and F are the fluorescence intensities in the absence and presence of the quencher, [Q] is the concentration of quencher, KD is the Stern–Volmer constant, and KD equal to the reciprocal of quencher's concentration at which F0/F = 2, or 50% of the intensity is quenched.
Cellular uptake at 0 mV point
To preliminarily confirm that the designed lipoplex enters cells by receptor-mediated pathway, we calculated the required concentration of lipoplex and siRNA at 0 mV through fluorescence experiment, and carried out FITC-siRNA transfection experiment at this concentration point, which was calculated from the fluorescence quenching step. The transfection protocol described in the steps of cellular uptake of BV2 and C8-D1A step. That is, FITC-siRNA (50 nM)/G3 or M3 (G3: 16 μg mL; M3: 18 μg mL−1) complexes were added to the cultured cells. After incubating for 6 h, the cells were washed with 1× PBS (pH 7.4) till complete removal of nonuptaken FITC-siRNA, and then, the cells were fixed with 4% paraformaldehyde (PFA) in PBS. Cells were treated with 0.1% Triton X-100 for 5 min. The morphology of the cells was demarcated by staining with phalloidin-iFlour 555 reagent (1:1000; Abcam, Cambridge, MA) was used along with the nuclear marker DAPI (1:1000; Thermo Scientific, MA, USA). After the cells were washed with PBS, the coverslips were detached and mounted on a glass slide by mounting media. Images were acquired by a laser confocal microscopy (Nikon, C2+) and quantified by flow cytometry (ACEA, Novocyte).
Blocking and temperature-dependent transfection efficiency
BV2 cells were seeded in a 24-well plate at 1 × 10⁶ cell density and cultured for 24 h. After blocking the cells with different final concentrations (10, 20, 40, 80, 100, 150, and 200 μg mL−1) of blocking solutions (mannan, zymosan, and dextran) for 2 h, FITC-siRNA/M3 complexes were added to the cell cultures and incubated for 6 h in a cell-culturing incubator. FITC-siRNA/M3 complexes were incubated at r.t. for 20 min before transfection. The results were assessed by flow cytometry. For temperature-dependent cellular uptake, the cells were transfected with FITC-siRNA/M3 complexes and incubated at 4 or 37 °C. The cells were re-suspended in 110 μL of PBS and assessed by flow cytometry.
siRNA transfection efficiency
For transfection of siRNA, siGENOME nontargeting siRNA was used as the control (Dharmacon, Lafayette, CO, USA). TLR4 siRNA was custom-synthesized by Takara Biotechnology Co., Ltd. (Dalian, Liaoning, China). The sequences of the TLR4 siRNA are as follows: antisense strand: 5′-UUAUAGUCAAAUAUGGGCCtt-3′; sense strand: 5′-GGCCCAUAUUUGACUAUAAtt-3′. The BV2 cells were grown in 24-well plate for 24 h before siRNA transfection. siTLR4 or siRNA control (100 nM in 50 μL) and M3 (18 μg mL−1 in 50 μL) were mixed in Opti-Medium and incubated at r.t. for 20 min. Before adding the transfection solution into the cells, the cell culture medium was replaced by 400 μL of fresh complete medium. After incubation for 4 h, the cells were treated with OGD insult as previous report.27 For OGD insult, cells were washed three times in DMEM without glucose and FBS, and then, the medium was replaced to low glucose DMEM. Cells were cultured in an airtight incubation chamber flushing through with 5% CO2 and 95% N2 for 2 h, then sealing the chamber for the duration of the experiment. OGD was alleviated by removing the culture from the incubator and maintaining the cells in high glucose medium to reoxygenate for 24 h under normal conditions (37 °C, 5% CO2, and 95% air at high humidity). The TLR4, iNOS, and CD206 expressions were evaluated by qPCR. Total RNA was extracted with TRIzol (Invitrogen, Carlsbad, CA, USA) and the expression of endogenous TLR4, iNOS, and CD206 mRNA were measured using iScript reverse transcription supermix for RT-qPCR and iTaq Universal SYBR Green supermix (Bio-Rad, Hercules, CA, USA) for qPCR.
In vitro microglia polarization
According to previously published methods, the expression of M1 and M2 markers in BV2 microglia were detected using immunocytochemistry (ICC).28,29 BV2 microglia cells were grown on 24-well plate with a glass slide chamber for overnight and were treated with siTLR4/M3 and siCtrl/M3 complexes for 4 h, followed by OGD treatment. After incubating the cells in normal cell culturing condition for 24 h, and fixed with 4% PFA in 0.1 M PBS. Fixed cells were rinsed using PBS, permeabilized with 0.1% Triton-X 100 for 10 min, and then incubated with 2% BSA in PBS for 1 h to block nonspecific binding. Then the cells were probed with primary antibodies for the M1 phenotype (iNOS, 1:400; Cell Signaling Technology, MA, USA) or the M2 phenotype (CD206, 1:400; Cell Signaling Technology, MA, USA). For visualization, the secondary antibodies, anti-rabbit Alexa-594 (1:1000; Cell Signaling Technology, MA, USA), or goat anti-rabbit IgG-FITC (1:1000; Abcam, Cambridge, MA) were used along with the nuclear marker DAPI (1:1000; Thermo Scientific, MA, USA). Images were obtained by a Nikon fluorescence confocal microscope (Nikon, C2+).
In vitro neuroprotection effect
After BV2 cells were treated with siTLR4/M3 or siCtrl/M3 complexes followed by OGD (see section of siRNA transfection efficiency), the cell culture conditioned media were added into precultured neuron cells (N2a) and incubated for 24 h, and then, apoptotic cells and the cell viability were measured using a calcein AM/PI double staining kit (Yeasen, Shanghai, China) and the CellTiter 96 Aqueous One Solution Cell Proliferation assay (Promega, WI, USA), respectively, following the manufacturer's instructions.
Statistical analysis
All results were expressed as a mean ± standard deviation (SD). For statistical analysis between two groups, Student's t-test for independent means was applied. Data are presented as mean ± standard error of the mean. Comparisons between multiple groups were made by one-way analysis of variance, followed by least significant difference multiple comparison test. Statistical analysis was performed using Prism 7.0. Results of p < 0.05 were considered statistically significant: *p < 0.05, **p < 0.01, ***p < 0.001, and ****p < 0.0001.
3. Results and discussion
Synthesis and characterization of D-DvGlu and D-DvMa
Our previous work confirmed that the lipid conjugated peptidomimetics based on natural amino acids (DoGo lipids) can deliver siRNA efficiently in vivo and in vitro.23 We also proved that D-peptide-based lipoplex possesses an ideal balance of increased stability in a tissue environment, enhanced efficiency of tissue specific delivery, minimized cytotoxicity,24 and more efficient in vivo siRNA delivery compared to the L-peptide lipoplex. We discovered that, by targeting cell surface mannose receptor (MR or CD206) with ligand functionalized polymeric nanoparticles, cell type specific siRNA can be achieved.15 To determine the glial cell type specificity as well as the MR receptor mediated siRNA delivery efficiency of DoGo lipid based LNP, we synthesized a mannose conjugated DoGo lipid (denotes D-DvMa) as well as a D-glucuronic acid modified D-DoGo1 (denotes D-DvGlu) as a control for the comparison study (Scheme 1, 2 and Fig. S1†).
 |
| | Scheme 1 Synthesis of D-DvGlu. | |
 |
| | Scheme 2 Synthesis of D-DvMa. | |
Formulation of D-DvGlu LNP and D-DvMa LNP
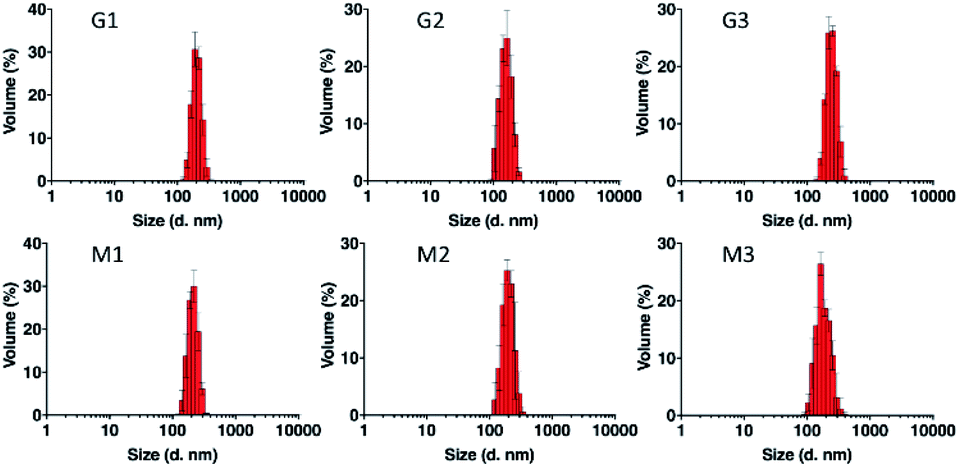
LNPs comprised of ligand conjugated lipids may recognize and bind cell surface receptors, leading to the cell type specific internalization of the resulting LNPs. To evaluate the receptor specificity of LNPs containing the novel lipid D-DvMa, we conducted six lipoplex formulations by including of 5%, 10%, or 15% of D-DvGlu (formulation G1, G2, and G3) or D-DvMa (formulation M1, M2, M3), respectively, and 50% D-DoGo2, 20% 1,2-dioleoyl-sn-glycero-3-phosphatidyl-ethanolamine (DOPE), 10% cholesterol, and 5% DPPE-mPEG. D-DoGo2 could condense negatively charge siRNA via electrostatic interaction.24 As a helper lipid, DOPE could enhance transfection and endosomal escape through promoting fusion between cells and endosome membrane.30 Cholesterol is a major component of cell membrane which could improve the stability of LNPs via altering the hydrophobic interactions within the LNPs.31 DPPE-mPEG could reduce the nonspecific adsorption of protein and prolong circulation time in vivo.32 Measurement of particle size the formulations by dynamic light scattering revealed that the lipoplexes have monodisperse peaks and high dispersion, which lay in the range of optimal size of lipoplex for nucleic acid delivery to various cell lines and tissues (Table 1, Fig. 1 and S2†). Although both G and M formulations had similar particle size (170 nm to 230 nm), M formulations had apparently smaller polydispersity index (PDI) compared to the G formulations, indicating that the lipoplexes containing D-DvMa have higher homogeneity (Table 1).
Table 1 Particle size distribution of lipid formulations
| Name |
Particle size (d. nm) ± SD |
PDI |
| G1 |
212.5 ± 0.14 |
0.197 |
| G2 |
170.5 ± 0.92 |
0.204 |
| G3 |
229.8 ± 0.33 |
0.209 |
| M1 |
216.8 ± 0.29 |
0.096 |
| M2 |
191.0 ± 0.03 |
0.106 |
| M3 |
180.0 ± 0.49 |
0.166 |
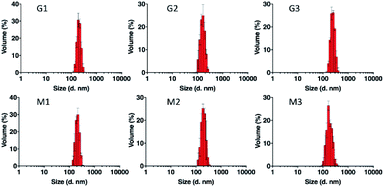 |
| | Fig. 1 Particle size distribution of G and M formulations measured by dynamic light scattering. | |
Electrostatic interaction assay
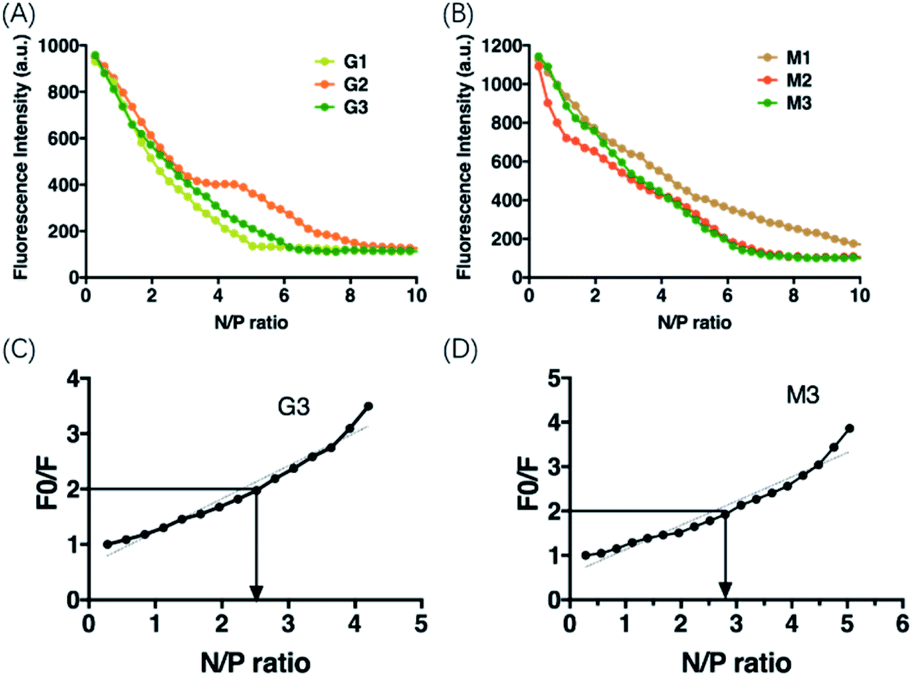
Cationic lipid based LNPs encapsulate nucleic acids via electrostatic interaction, and incorporation of ligand functionalized components in the LNP formulations may affect the binding affinity of LNP to siRNA. To measure the binding affinity of G and M formulations, we first performed electrophoresis analysis for gel shift assay on all formulations at various cationic lipid (amine, N) to siRNA (phosphate, P) ratio. The results showed that the migration of siRNA in gel was retarded with the increasing N/P ratio in all formulations, indicating that lipoplexes and siRNA can form a complete complex through electrostatic interactions at this condition (ESI Fig. S3†). All formulations completely bound to siRNA at N/P ratio 5, 7, 9, 3, 5, and 9, respectively. Furthermore, we used fluorescence quenching experiments to calculate the apparent dissociation constant (KD) of the formulations. The results showed that, with the increase of N/P ratio, the fluorescence intensity decreased gradually. G3 and M3 achieved about 95% quenching of fluorescence at N/P ratio is 6 and 7, respectively (Fig. 2A and B). In Stern–Volmer equation, KD equal to the reciprocal of quencher's concentration at which F0/F = 2, or 50% of the intensity is quenched. Therefore, from the linear fitting of the graph of F0/F–N/P ratio, it can be calculated that at F0/F = 2 corresponding the KD of G3 and M3 are 0.12 μg mL−1 and 0.11 μg mL−1, respectively (Fig. 2C and D).
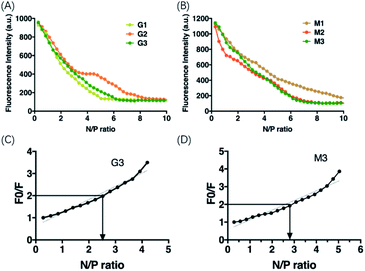 |
| | Fig. 2 Measurement of apparent dissociation constant of G and M formulations. (A) and (B) The siRNA binding efficiency of G and M formulations at various N/P ratio was measured by fluorescence quenching experiments. (C) and (D) Stern–Volmer plot for fluorescence quenching of G3 and M3. | |
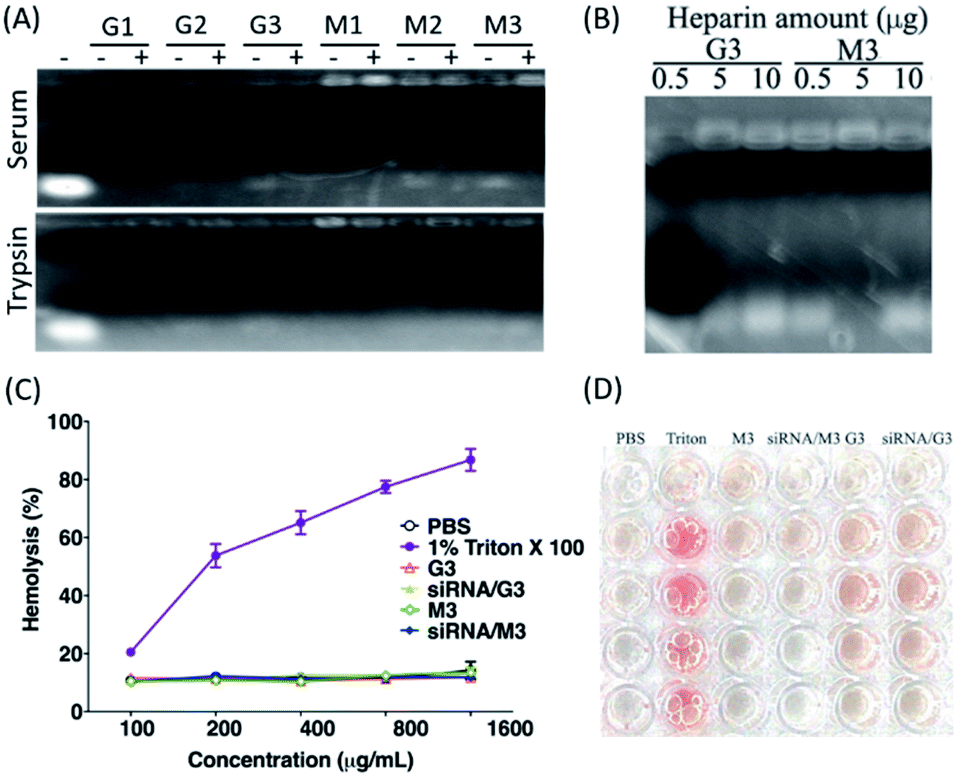
Stability assay, release assay and hemolysis effect
The stability and safety properties are both essential parameters for a drug carrier, especially for the systemic delivery systems. To test the stability of the novel formulations, we complexed siRNA with the G and M formulations, respectively, and examined their stability by incubation with trypsin or serum at 37 °C for 2 h, followed by an electrophoresis mobility shift analysis. At N/P ratios above 9, which gave complete binding and retardation of siRNA mobility, all complexes showed effectively resistant to enzymatic hydrolysis by trypsin or nuclease digestion by serum, demonstrating that all formulations can potentially protect siRNA against serum enzyme digestion (Fig. 3A). The dissociation property of the formulations was investigated by exposing the LNPs loaded with siRNA to heparin sulphate solutions with a range of concentrations. The results suggested that, as the amount of heparin increased, the siRNA was released from the complex and visual bands were observed in the gel, suggesting that siRNA drugs can be dissociate from both G3 and M3 LNPs to achieve intracellular release of siRNA (Fig. 3B). To assess the hemolysis effect of the novel LNPs, both G3 and M3 alone or loaded with siRNA was incubated with 2% red blood cells for 2 h at 37 °C. Hemolysis is mainly defined as the destruction of red blood cells (RBCs) and release of their contents (hemoglobin) into the surrounding fluids. Intravascular rupture of RBCs leading to endothelial cell dysfunction and vascular thrombosis, even cause multiple organ failure and death.33 As a result, hemolysis can be used as the main index to evaluate whether lipoplexes have side effects. The results showed that both G3 and M3, alone or siRNA loads, had no apparent hemolysis effect (Fig. 3C and D), indicating that both G3 and M3 had a high biocompatibility and may be applicable for in vivo drug delivery.
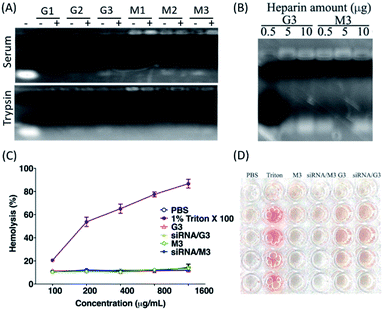 |
| | Fig. 3 Stability, siRNA release and hemolysis assay. (A) siRNA was complexed to G and M formulations, respectively, and incubated with or without serum or trypsin, respectively. Then agarose gel electrophoresis was performed to detect the released siRNA from the LNPs. (B) Replacement assay. G3 and M3 LNP were loaded with siRNA, respectively, and the indicated amount of heparin was added to the complex. The released siRNA was detected on agarose gel. (C) and (D) Hemolysis assay. Mouse red blood cells were incubated with PBS, Triton X100, G3 alone, G3 loaded with siRNA, M3 alone, and M3 loaded with siRNA at the indicated concentrations. | |
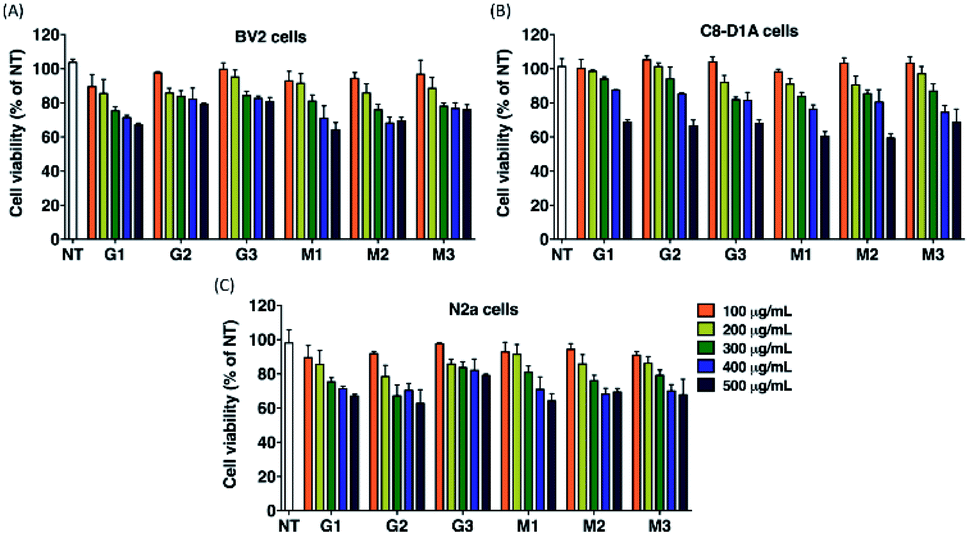
Cytotoxicity
To examine the cytotoxicity of G and M formulations, glial cell lines (BV2, mouse microglia cell line; C8-D1A, mouse astrocyte cell line) and neural cell line (N2a, mouse neuroblastoma cell line) were treated with various concentration of the formulations, respectively, and the cell viability was assessed by 3-(4,5-dimethylthiazol-2-yl)-2,5-diphenyl tetrazolium bromide (MTT) assay. The results showed that, although all lipoplexes had low cytotoxicity, and the cell viabilities on three types cell lines that treated with M3 at the maximum concentration of 500 μg mL−1 were in the range of 70–80%, indicating that the cytotoxicity of M3 was negligible in comparison with others (Fig. 4). Based on these results, we chose M3 for further evaluation for receptor mediated delivery efficiency in the following studies, by choosing G3 as a control.
 |
| | Fig. 4 Measurement of cytotoxicity of G and M formulations. BV2 cells, C8-D1A cells and N2a cells were treated with the indicated concentration of G1, G2, G3 and M1, M2, M3 formulations, respectively for 24 h. The cell viability was then measured using MTT reagent. | |
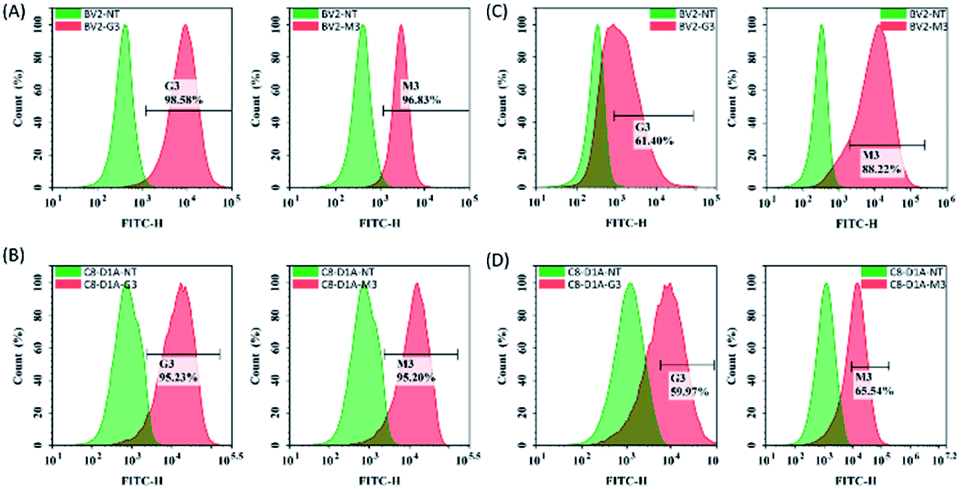
Cellular uptake assay
Next, we evaluated the cell type specific uptake efficiency of M3 by BV2 microglia cell, which expresses MR, and C8-D1A cells, without mannose receptor, using G3 as control carrier. To do this, we first prepared LNPs with positive or neutral surface by complexing FITC-siRNA with either G3 or M3, at two different N/P ratios (Table 2, ESI Fig. S3†). At F0/F = 2 (i.e. 50% of the fluorescence intensity is quenched), the N/P ratio for G3 and M3 were 2.5 and 2.8, respectively. Thus, it can be deduced that the fluorescence intensity is completely quenched at N/P ratio of G3 and M3 were 5 and 5.6, respectively, generating the neutral LNPs.
Table 2 Transfection efficiency of G3 and M3 LNPs at different N/P ratios
| LNP |
N/P ratio |
ζ Potential (mV) |
Particle size (d. nm) |
Transfection efficiency (%) |
| G3 |
10/1 |
+16.9 ± 1.05 |
241.1 ± 1.2 |
98.6 |
| M3 |
11.2/1 |
+27.3 ± 0.31 |
245.0 ± 0.6 |
96.8 |
| G3 |
5/1 |
−0.41 ± 0.31 |
264.1 ± 0.6 |
61.4 |
| M3 |
5.6/1 |
−0.18 ± 0.04 |
243.6 ± 0.6 |
88.2 |
We performed FITC-siRNA transfection experiment on BV2 cells and C8-D1A cells by using either positively charged or neutral G3 and M3 LNPs. Flow cytometry analysis showed that positively charged G3 and M3 LNPs had good transfection efficiency on both cell lines, which could reach about 95% (Fig. 5A and B). Due to the positive charge on their surface, both G3 and M3 LNPs efficiently delivery siRNA into the cells via electrostatic interaction between the particles and cell surface, resulting in the disruption of the membrane and internalization of the particles. However, transfection of both cell lines with neutral LNPs showed that, compared to G3 LNP, M3 LNP showed significantly higher transfection only in BV2 cells. In contrast, in C8-D1A cells without mannose receptor, both G3 and M3 showed weak green fluorescence signal. These data indicated that siRNA/M3 complexes enter the BV2 cells through mannose receptor mediated endocytosis (Fig. 5C, D and ESI Fig. S4†).
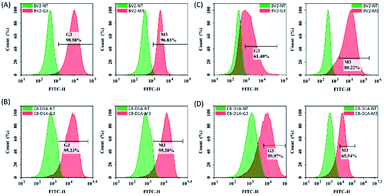 |
| | Fig. 5 Transfection efficiency of G3 LNP and M3 LNP at different N/P ratios. (A) Positively charged particles on BV2 cells; left, G3 LNP; right, M3 LNP. (B) Positively charged particles on C8-D1A cells; left, G3 LNP; right, M3 LNP. (C) Neutral particles on BV2 cells; left, G3 LNP; right, M3 LNP. (D) Neutral particles on C8-D1A cells; left, G3 LNP; right, M3 LNP. | |
Competitive binding and receptor blocking
To elucidate the uptake mechanism of M3 LNP in BV2 cells, a low temperature assay was performed to evaluate whether internalization of M3 was energy dependent. In this experimental approach, BV2 cells were treated with siRNA/M3 complexes at either low temperature (4 °C) or at normal incubation temperature (37 °C), followed by the measurement of fluorescence intensity by flow cytometry. Here, it was observed that the fluorescence intensity of the cells treated with M3 LNP at all time points at 4 °C were very low compared to the cells treated with M3 LNP at 37 °C, whereas the overall cellular uptake increased with time, indicating that the energy dependent uptake occurred at 37 °C (Fig. 6A). This result can be explained as follows: the increase of fluorescence intensity at 4 °C reflects the number of siRNA/M3 complexes binding to mannose receptors on the cell surface, and at 37 °C reflects the endocytic uptake of siRNA/M3 complexes plus the amount of binding to the cellular surface. These data suggested that M3 LNP was taken up by the BV2 through an energy-dependent endocytic process.
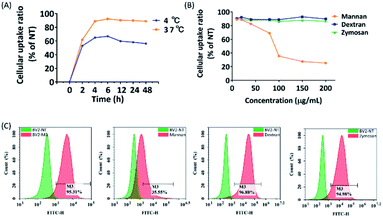 |
| | Fig. 6 Temperature and CD206 receptor dependency of M3 LNP internalization by BV2 cells. (A) Time dependent cellular uptake of a FITC-labeled siRNA complexed to M3 LNP at 4 °C and 37 °C, respectively. (B) and (C) Quantification of cellular uptake of a FITC-labeled siRNA complexed to M3 LNP at 37 °C. | |
To further verify that M3 LNP enters BV2 cells through CD206 receptor-mediated endocytosis, we conducted a competitive blocking experiment. To do this, we selected mannan (a natural ligand for the CD206 receptor), dextran (a complex branched glucan), and zymosan (ligand for dectin-1 receptor) as receptor binding competitive inhibitors to evaluate ligand–receptor binding specificity of M3. We pretreated BV2 cells with different concentrations of mannan, dextran, and zymosan, respectively, and then treated the cells with siRNA/M3 complexes. After that, the transfection efficiencies were quantitatively analyzed by flow cytometry. The results showed that the cellular uptake of siRNA/M3 complexes were significantly inhibited only by mannan in a dose-dependent manner, while dextran and zymosan had no inhibitory effect to M3 LNP mediated transfection. At the concentration of 80 μg mL−1, about 50% cellular uptake of M3 LNP was inhibited by mannan; at 100–200 μg mL−1, 80% of transfection efficiency was inhibited (Fig. 6B and C), suggesting that M3 may have been internalized through recognition and binding to CD206 receptor, followed by receptor-mediated internalization.
Microglia polarization in vitro
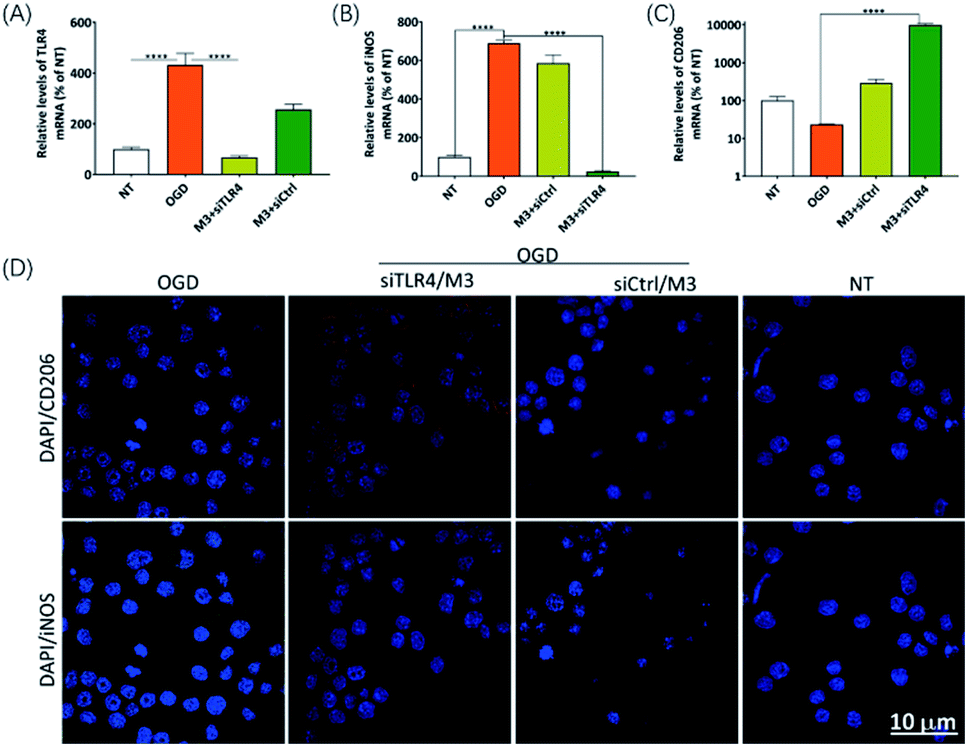
To confirm the RNAi efficiency induced by CD206-mediated internalization of M3 LNP loaded with siRNA, we treated BV2 cells with siTLR4 or nontargeting control siRNA (siCtrl) complexed to M3 LNP, followed by the OGD treatment. After 24 h, we extracted total RNA from the cells and measured TLR4 expression at the mRNA level by RT-qPCR. The expression level of TLR4 in BV2 microglia rapidly increased upon OGD treatment, which was remarkably decreased upon pretreated with siTLR4/M3 (Fig. 7A). In addition, the expression level of CD206 (M2 marker), which has a basic level of expression in nontreated and OGD-treated microglia, significantly increased in siTLR4/M3-transfected microglia, while iNOS (M1 marker), which has dramatically upregulated after OGD treatment, was significantly silenced only in siTLR4/M3 transfected BV2 microglia (Fig. 7B–D). These results suggested that the silencing of TLR4 by siTLR4/M3 can regulate the gene expression characteristics in activated microglia and promote the transition of microglia from pro-inflammatory to anti-inflammatory polarization in vitro.
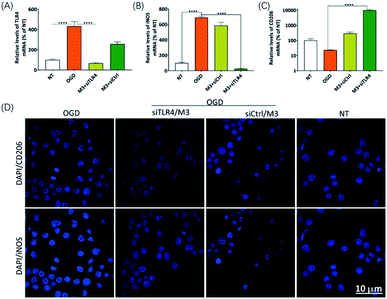 |
| | Fig. 7 Knockdown of TLR4 by M3 LNP mediated delivery of siTLR4. (A) RT-qPCR analysis of expression level of TLR4, iNOS and CD206 after transfecting BV2 cells. ****p < 0.0001 compared to NT. (B) Immunocytochemistry analysis of OGD treated BV2 cells transfected with either siTLR4 or siCtrl complexed to M3 LNP. | |
Moreover, the supernatant of BV2 microglia culture transfected with siTLR4/M3 complexes rescued Neu2a cells from OGD-induce apoptosis (Fig. 8), suggesting that the supernatant may contain anti-inflammatory cytokines and growth factors that protect neurons from apoptotic cell death under ischemic condition.
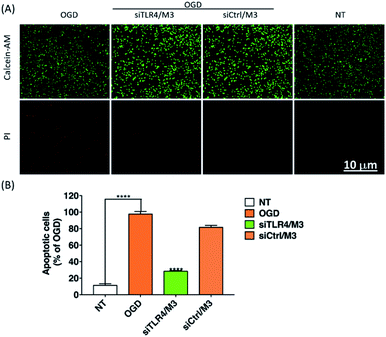 |
| | Fig. 8 Neuroprotective effect of alternatively polarized microglia induced by M3 LNP mediated knockdown of TLR4 in OGD treated BV2 cells. (A) Staining of OGD-induced apoptotic cells using a calcein AM/PI double staining kit. (B) Quantification of dead cells. | |
4. Conclusions
The LNPs created from mannose functionalized DoGo lipids have negligible cytotoxicity and hemolytic effect. The M3 LNP but not the control G3 LNP, specifically enters BV2 cells that expresses CD206 via receptor-mediated endocytosis. M3 LNP delivers siTLR4 against to BV2 cells, attenuates the expression of pro-inflammatory marker (iNOS), elevated the expression of anti-inflammatory marker (CD206), and rescued OGD-induced neuronal cell death in vitro. In general, our data prove that M3 LNP is a high biocompatibility and microglia specific siRNA delivery agent. The further in vivo experiments are currently undergoing in our laboratory for CNS targeted drug delivery.
Author contributions
H. X.: methodology, investigation, writing – original draft preparation. S. H.: software, validation. H. B.: conceptualization, supervision, writing – original draft preparation, reviewing and editing.
Conflicts of interest
There are no conflicts to declare.
Acknowledgements
This research was kindly supported by the National Natural Science Foundation of China (grant number: 21875124) and Natural Science Foundation of Inner Mongolia Autonomous Region (grant number: 2019MS02009).
Notes and references
- S. M. Hammond, A. A. Caudy and G. J. Hannon, Nat. Rev. Genet., 2001, 2, 110–119 CrossRef CAS.
- A. Chicas and G. Macino, EMBO Rep., 2001, 2, 992–996 CrossRef CAS.
- D. Adams, A. Gonzalez-Duarte, W. D. O'Riordan, C. C. Yang, M. Ueda, A. V. Kristen, I. Tournev, H. H. Schmidt, T. Coelho, J. L. Berk, K. P. Lin, G. Vita, S. Attarian, V. Plante-Bordeneuve, M. M. Mezei, J. M. Campistol, J. Buades, T. H. Brannagan 3rd, B. J. Kim, J. Oh, Y. Parman, Y. Sekijima, P. N. Hawkins, S. D. Solomon, M. Polydefkis, P. J. Dyck, P. J. Gandhi, S. Goyal, J. Chen, A. L. Strahs, S. V. Nochur, M. T. Sweetser, P. P. Garg, A. K. Vaishnaw, J. A. Gollob and O. B. Suhr, N. Engl. J. Med., 2018, 379, 11–21 CrossRef CAS.
- S. Agarwal, A. R. Simon, V. Goel, B. A. Habtemariam, V. A. Clausen, J. B. Kim and G. J. Robbie, Clin. Pharmacol. Ther., 2020, 108, 63–72 CrossRef CAS.
- L. J. Scott and S. J. Keam, Drugs, 2021, 81, 277–282 CrossRef CAS.
- Y. N. Lamb, Drugs, 2021, 81, 389–395 CrossRef CAS.
- R. R. Nikam and K. R. Gore, Nucleic Acid Ther., 2018, 28, 209–224 CrossRef CAS PubMed.
- J. J. Turner, S. W. Jones, S. A. Moschos, M. A. Lindsay and M. J. Gait, Mol. BioSyst., 2007, 3, 43–50 RSC.
- A. L. Jackson and P. S. Linsley, Nat. Rev. Drug Discovery, 2010, 9, 57–67 CrossRef CAS PubMed.
- T. M. Allen and P. R. Cullis, Adv. Drug Delivery Rev., 2013, 65, 36–48 CrossRef CAS.
- Q. Leng, M. C. Woodle and A. J. Mixson, J. Drug Delivery, 2017, 2017, 6971297 Search PubMed.
- A. J. Debacker, J. Voutila, M. Catley, D. Blakey and N. Habib, Mol. Ther., 2020, 28, 1759–1771 CrossRef CAS.
- L. Martinez-Pomares, J. Leukocyte Biol., 2012, 92, 1177–1186 CrossRef CAS.
- H. Zimmer, S. Riese and A. Regnier-Vigouroux, Glia, 2003, 42, 89–100 CrossRef.
- T. Ganbold, Q. Bao, J. Zandan, A. Hasi and H. Baigude, ACS Appl. Mater. Interfaces, 2020, 12, 11363–11374 CrossRef CAS.
- W. J. Streit, R. E. Mrak and W. S. Griffin, J. Neuroinflammation, 2004, 1, 14 CrossRef PubMed.
- S. Girard, D. Brough, G. Lopez-Castejon, J. Giles, N. J. Rothwell and S. M. Allan, Glia, 2013, 61, 813–824 CrossRef PubMed.
- Y. Ma, J. Wang, Y. Wang and G. Y. Yang, Prog. Neurobiol., 2017, 157, 247–272 CrossRef CAS.
- M. Mecha, A. Feliu, F. J. Carrillo-Salinas, A. Rueda-Zubiaurre, S. Ortega-Gutierrez, R. G. de Sola and C. Guaza, Brain, Behav., Immun., 2015, 49, 233–245 CrossRef CAS PubMed.
- C. H. Latta, T. L. Sudduth, E. M. Weekman, H. M. Brothers, E. L. Abner, G. J. Popa, M. D. Mendenhall, F. Gonzalez-Oregon, K. Braun and D. M. Wilcock, J. Neuroinflammation, 2015, 12, 41 CrossRef.
- J. M. Pradillo, D. Fernandez-Lopez, I. Garcia-Yebenes, M. Sobrado, O. Hurtado, M. A. Moro and I. Lizasoain, J. Neurochem., 2009, 109, 287–294 CrossRef CAS PubMed.
- S. C. Tang, T. V. Arumugam, X. Xu, A. Cheng, M. R. Mughal, D. G. Jo, J. D. Lathia, D. A. Siler, S. Chigurupati, X. Ouyang, T. Magnus, S. Camandola and M. P. Mattson, Proc. Natl. Acad. Sci. U. S. A., 2007, 104, 13798–13803 CrossRef CAS PubMed.
- H. Xiao, A. Altangerel, G. Gerile, Y. Wu and H. Baigude, ACS Appl. Mater. Interfaces, 2016, 8, 7638–7645 CrossRef CAS PubMed.
- T. Ganbold, G. Gerile, H. Xiao and H. Baigude, RSC Adv., 2017, 7, 8823–8831 RSC.
- A. Henn, S. Lund, M. Hedtjarn, A. Schrattenholz, P. Porzgen and M. Leist, ALTEX, 2009, 26, 83–94 CrossRef.
- E. Blasi, R. Barluzzi, V. Bocchini, R. Mazzolla and F. Bistoni, J. Neuroimmunol., 1990, 27, 229–237 CrossRef PubMed.
- R. Milner, S. Hung, X. Wang, G. I. Berg, M. Spatz and G. J. del Zoppo, Stroke, 2008, 39, 191–197 CrossRef PubMed.
- M. Ghosh, Y. Xu and D. D. Pearse, J. Neuroinflammation, 2016, 13, 9 CrossRef PubMed.
- M. Ghosh, D. Garcia-Castillo, V. Aguirre, R. Golshani, C. M. Atkins, H. M. Bramlett, W. D. Dietrich and D. D. Pearse, Glia, 2012, 60, 1839–1859 CrossRef PubMed.
- N. R. M. Saunders, M. S. Paolini, O. S. Fenton, L. Poul, J. Devalliere, F. Mpambani, A. Darmon, M. Bergere, O. Jibault, M. Germain and R. Langer, Nano Lett., 2020, 20, 4264–4269 CrossRef CAS PubMed.
- K. A. Hajj and K. A. Whitehead, Nat. Rev. Mater., 2017, 2, 1–17 Search PubMed.
- P. P. Lei, J. Feng and H. J. Zhang, Nano Today, 2020, 35, 1–32 CrossRef.
- K. Saha, D. F. Moyano and V. M. Rotello, Mater. Horiz., 2014, 2014, 102–105 RSC.
Footnote |
| † Electronic supplementary information (ESI) available. See DOI: 10.1039/d1ra04293a |
|
| This journal is © The Royal Society of Chemistry 2021 |
Click here to see how this site uses Cookies. View our privacy policy here. 
 Open Access Article
 This Open Access Article is licensed under a Creative Commons Attribution-Non Commercial 3.0 Unported Licence
 ,
Shuqin Han and
Huricha Baigude
,
Shuqin Han and
Huricha Baigude