 Open Access Article
Fourier-transform infrared and X-ray diffraction analyses of the hydration reaction of pure magnesium oxide and chemically modified magnesium oxide†
Ryo Kurosawaa,
Masato Takeuchib and
Junichi Ryu *a
*a
aGraduate School of Engineering, Chiba University, 1-33, Yayoi-cho, Inage-ku, Chiba, Japan. E-mail: jryu@chiba-u.jp
bDepartment of Applied Chemistry, Graduate School of Engineering, Osaka Prefecture University, 1-1, Gaku-en-cho, Naka-ku, Sakai, Osaka 599-8531, Japan
First published on 9th July 2021
Abstract
The magnesium hydroxide/magnesium oxide (Mg(OH)2/MgO) system is a promising chemical heat storage system that utilizes unused heat at the temperature range of 200–500 °C. We have previously reported that the addition of lithium chloride (LiCl) and/or lithium hydroxide (LiOH) promotes the dehydration of Mg(OH)2. The results revealed that LiOH primarily catalyzed the dehydration of the surface of Mg(OH)2, while LiCl promoted the dehydration of bulk Mg(OH)2. However, the roles of Li compounds in the hydration of MgO have not been discussed in detail. X-ray diffraction (XRD) and Fourier-transform infrared (FT-IR) techniques were used to analyze the effects of adding the Li compounds. The results revealed that the addition of LiOH promoted the diffusion of water into the MgO bulk phase and the addition of LiCl promoted the hydration of the MgO bulk phase. It was also observed that the concentration (number) of OH− affected hydration. The mechanism of hydration of pure and LiCl- (or LiOH)-added MgO has also been discussed.
1. Introduction
In recent years, the depletion of energy resources and global warming have become critical issues. Thus, energy conservation techniques that can help address these issues are crucial. Renewable energy resources (such as solar, wind, and geothermal energy) have gained attention worldwide. There are some disadvantages of using these energy resources. Inefficient power generation, difficulty in installation, and a gap between energy supply and demand limit the practical use of the resources. Nuclear power plants have been limited in operation since the Japan earthquake of 2011. Hence, alternative energy resources should be identified and techniques that can help generate energy should be developed to meet the energy demand.It is important that unused heat (industrial waste heat and surplus solar heat) be used as the sources of heat energy to meet the energy demand. Heat storage techniques (sensible, latent, and chemical heat storage (CHS) techniques) that can help utilize unused heat have been developed. It has been reported that water, molten salts, and concrete can be used as energy sources when the sensible heat storage technique is used to address the energy problems and mannitol and micro-capsulated phase change materials (PCMs) can be used as energy sources when the latent heat storage technique is used to meet the energy demand.1–7 The heat storage density and long-term heat storage capacity achieved using the CHS technique was better than the heat storage density and long-term heat storage capacity achieved using the other two techniques.8–13 Therefore, in our previous studies, the CHS technique has received attention for energy conservation.
Salt hydrates such as MgCl2·6H2O,14,15 LiOH·H2O,16 and metal sulfates15,17–19 have been used as CHS materials in the temperature range of 100–250 °C. Mg(OH)2,20–34 Ca(OH)2,28,35–37 and MgCO3 (ref. 38) can be used to store energy in the temperature range of 200–500 °C. These materials exhibit high energy density and the property of reversibility. Metal oxides, carbonates, and lithium orthosilicates have been used to conserve thermal energy in the temperature range of 800–1000 °C. The energy densities recorded for these materials are higher than those recorded for other CHS materials.39–44
We have focused on Mg(OH)2 (CHS material) to effectively store thermal energy in the temperature range of 200–300 °C. This material can be dehydrated under mild conditions and it exhibits high reversibility. The dehydration reaction of Mg(OH)2 and the hydration reaction of MgO correspond to the heat storage and output operations, respectively. The rate of dehydration of Mg(OH)2 is significantly slow when the temperature is <300 °C. A significantly low hydration reactivity is observed for MgO in the temperature range of 150–200 °C.24,31,33 Therefore, the difference in the dehydration and hydration temperatures is one of the problems for the widespread application of CHS materials because the difference leads to the waste of sensible heat.18
We proposed that the addition of LiCl and/or LiOH to Mg(OH)2 samples can help improve the dehydration reactivity.22–24,32,33 The rate of dehydration of Mg(OH)2 in the temperature range of 270–300 °C increased significantly when Li compounds were added.22–24,32,33 The hydration reactivity of the MgO system where both LiCl and LiOH were used as additives (at 200 °C) was significantly higher than the hydration reactivity of the MgO system containing either LiCl or LiOH.33 We have identified the roles played by LiCl and LiOH during the dehydration of Mg(OH)2. LiOH primarily catalyzes the dehydration of the Mg(OH)2 surface, while LiCl helps increase the rate of dehydration of the bulk Mg(OH)2 system.45 The effect of the addition of these Li compounds on the hydration of MgO is yet to be fully understood. Now the most efficient additives for the Mg(OH)2/MgO-based CHP materials have not been found and proposed, thus, the understanding must be required to elucidate the critical roles of Li-compounds in the MgO hydration. These insights will help us to predict some other more effective additives.
MgO has been investigated as a catalyst for hept-1-ene isomerization, 2-methyl-3-butyn-2-ol reaction, transesterification, oxidative coupling of methane, and so on.46–50 Furthermore, many studies for MgO surface hydration has also been focused by combination with simulations and experiments as follows.
Refson et al. suggested that the surface structures of the samples under study were similar to the surface structures of Mg(OH)2 (0001) when MgO (111) was protonated during the hydration process.51 This suggestion was in agreement with the suggestions presented in other studies where it was revealed that the Mg(OH)2 (0001) plane was parallel to the MgO (111) plane during the process of dehydration.52,53 Refson et al. calculated the energy required for the chemisorption of water on MgO. It was reported that the hydroxylation of the (001) surface of MgO was energetically unstable, whereas the (111) surface of MgO was stabilized by hydroxylation based on density functional theory (DFT) calculations.51 It can be interpreted that compared to the (100) and (001) planes, it was easier to hydrate the (111) plane.54 Some researchers have reported similar results.55,56 The surface was reconstructed to obtain the lowest energy structure.56 Finocchi and Goniakowski57 performed DFT calculations to investigate the hydration properties of MgO. They reported that a strong bond was formed between the O atom of H2O and the surface Mg atom present on the defective surface.57 The O atom filled the oxygen vacancy.57 Hu et al.58 reported that the water dimer was adsorbed on the MgO (001) surface. They also reported that proton transfer between H2O and the MgO surface resulted in the dissociation of one H2O molecule.58 Laporte et al. showed the proton transfer occurred at the MgO (001)/water interface and in the zone close to the surface where the electric field was strongest.59 However, the adsorption of a water monolayer is more natural to consider. Asaduzzaman60 performed the first-principle DFT calculations to investigate the hydration of MgO. The interaction between H2O and the (001) and (111) planes of MgO was studied. The results revealed that the interaction between the monolayer of water and the (111) surface of MgO resulted in the formation of Mg(OH)2.60 The author demonstrated that surface defects helped reduce the hydration energy barrier.60 Kato et al.20 reported the results of a kinetic study of the hydration of MgO. They assumed that the hydration reaction had four regimes.20 Asaduzzaman simulated the first two mechanisms.60 Pimminger et al.53 and Iwasaki et al.61 used the thermogravimetric analysis (TGA) technique to conduct their studies. The results revealed the presence of structural water. Sharma et al. studied the dehydroxylation/rehydroxylation of Mg(OH)2/MgO using the transmission electron microscopy (TEM) technique.54 During the rehydroxylation of the dehydroxylated Mg(OH)2, the associated hydroxide species exhibited high mobility. The number of dislocations and other defects increased during the initial stages of crystallization of the rehydroxylated material.54 Chizallet et al.46 identified the sites where the units were present and presented molecular descriptions of the different types of OH groups. They also identified the different catalytically active sites participating in the 2-methylbut-3-yn-2-ol reaction.46 Rimsza et al. investigated the reaction between commercial MgO and deionized water. They used the proton magic-angle spinning nuclear magnetic resonance (1H MAS NMR) technique to characterize the compounds.62 They observed several MgOH-type phases that were not strongly hydrogen-bonded to nearby atoms. These phases were the dominant intermediate species produced during hydration. The MgOH-type species were identified to be Mg5O4(OH)2, Mg4O3(OH)2, Mg3O2(OH)2, Mg2O(OH)2, Mg3O(OH)4, and Mg5O(OH)8.62 The studies focused only on the hydration of pure MgO. The effects of adding LiCl and/or LiOH during the hydration process should be studied to further improve the reactivity of the Mg(OH)2/MgO system that can be potentially used for the effective utilization of waste heat.
Fourier-transform infrared (FT-IR) spectroscopy is a qualitative analytical technique. Researchers have studied the role of hydroxyl groups on MgO. They proposed a stoichiometric equation for the adsorption and dissociation reactions involving molecular H2O. The equation can be represented as follows (eqn (1)63–68):
 | (1) |
Knözinger et al. classified OH groups into four types based on the coordination number and the presence and absence of hydrogen bonds.65 Based on the results obtained from the experiments conducted using the FT-IR and DFT techniques, Chizallet et al.66,68 proposed a new OH group classification. We have69 discussed the mechanism for Mg(OH)2 dehydration and MgO hydration using near infrared (NIR) spectroscopy.
The hydration properties of pure MgO and doped MgO have rarely been investigated using the FT-IR technique. This study provides information on hydration based on previously reported results63–68 obtained by studying the characteristics of OH groups on the MgO surface. We aim to determine the effects of the addition of LiCl and/or LiOH on the hydration properties (heat output operation) of MgO using two characterization techniques: X-ray diffraction (XRD) and FT-IR. Insight into the role of Li compounds can help identify dopants that can effectively catalyze the Mg(OH)2 dehydration and MgO hydration processes in the future. It can also help in the development of other CHS systems.
2. Experimental
2.1. Sample preparation
LiCl·H2O (99.9%), LiOH·H2O, and Mg(OH)2 (99.9%, 0.07 μm) were purchased from Wako Pure Chemical Industries, Ltd. (Japan) and used as precursors to prepare the LiCl and LiOH co-added Mg(OH)2 (referred to as LiCl/LiOH/Mg(OH)2) and LiCl- or LiOH-added Mg(OH)2 (referred to as LiCl/Mg(OH)2 and LiOH/Mg(OH)2, respectively) samples.LiCl/Mg(OH)2, LiOH/Mg(OH)2, and LiCl/LiOH/Mg(OH)2 were prepared following an impregnation method. Aqueous solutions of LiCl and LiOH were prepared using LiCl·H2O and LiOH·H2O, respectively. Ultrapure water was used to prepare the samples. Following this, Mg(OH)2 powder (pure) was dissolved in the prepared solution and the resulting solution was stirred for 30 min. Subsequently, the water was evaporated under reduced pressure using a rotary evaporator operated at a temperature of 40 °C. Finally, the samples were dried overnight at 120 °C. All samples appeared white and were obtained in their powdered forms.23,24,32–34,45 LiCl-added Mg(OH)2 with an Mg(OH)2![[thin space (1/6-em)]](https://www.rsc.org/images/entities/char_2009.gif) :
:![[thin space (1/6-em)]](https://www.rsc.org/images/entities/char_2009.gif) LiCl mole ratio of 100
LiCl mole ratio of 100![[thin space (1/6-em)]](https://www.rsc.org/images/entities/char_2009.gif) :
:![[thin space (1/6-em)]](https://www.rsc.org/images/entities/char_2009.gif) 10 (referred to as L10), LiOH-added Mg(OH)2 with an Mg(OH)2
10 (referred to as L10), LiOH-added Mg(OH)2 with an Mg(OH)2![[thin space (1/6-em)]](https://www.rsc.org/images/entities/char_2009.gif) :
:![[thin space (1/6-em)]](https://www.rsc.org/images/entities/char_2009.gif) LiOH mole ratio of 100
LiOH mole ratio of 100![[thin space (1/6-em)]](https://www.rsc.org/images/entities/char_2009.gif) :
:![[thin space (1/6-em)]](https://www.rsc.org/images/entities/char_2009.gif) 20 (referred to as LO20), and LiCl and LiOH co-added Mg(OH)2 with an Mg(OH)2
20 (referred to as LO20), and LiCl and LiOH co-added Mg(OH)2 with an Mg(OH)2![[thin space (1/6-em)]](https://www.rsc.org/images/entities/char_2009.gif) :
:![[thin space (1/6-em)]](https://www.rsc.org/images/entities/char_2009.gif) LiCl
LiCl![[thin space (1/6-em)]](https://www.rsc.org/images/entities/char_2009.gif) :
:![[thin space (1/6-em)]](https://www.rsc.org/images/entities/char_2009.gif) LiOH mole ratio of 100
LiOH mole ratio of 100![[thin space (1/6-em)]](https://www.rsc.org/images/entities/char_2009.gif) :
:![[thin space (1/6-em)]](https://www.rsc.org/images/entities/char_2009.gif) 10
10![[thin space (1/6-em)]](https://www.rsc.org/images/entities/char_2009.gif) :
:![[thin space (1/6-em)]](https://www.rsc.org/images/entities/char_2009.gif) 10 (referred to as L10/LO10) were prepared following this method. Mg(OH)2 and MgO (99.9%, 0.05 μm, Wako Pure Chemical Industries, Ltd.), devoid of Li compounds, referred to as Mg(OH)2–W and MgO–W, respectively, were prepared following the same method. Details of all the prepared samples have been presented in Table 1. Results from our previous studies revealed that the best mixing ratios could be expressed as L10, LO20, and L10/LO10 (with respect to the activation energy for dehydration). Increased dehydration and hydration reactivities could also be achieved.23,24,32,33 These samples were used to compare the reactivities of the samples under study. The samples used in this study were the same as those used in our previous study.45
10 (referred to as L10/LO10) were prepared following this method. Mg(OH)2 and MgO (99.9%, 0.05 μm, Wako Pure Chemical Industries, Ltd.), devoid of Li compounds, referred to as Mg(OH)2–W and MgO–W, respectively, were prepared following the same method. Details of all the prepared samples have been presented in Table 1. Results from our previous studies revealed that the best mixing ratios could be expressed as L10, LO20, and L10/LO10 (with respect to the activation energy for dehydration). Increased dehydration and hydration reactivities could also be achieved.23,24,32,33 These samples were used to compare the reactivities of the samples under study. The samples used in this study were the same as those used in our previous study.45
| Sample | Mixing ratio [mole ratio] |
|---|---|
| Mg(OH)2–W | Mg(OH)2 sample devoid of Li compounds |
| L10 | Mg(OH)2![[thin space (1/6-em)]](https://www.rsc.org/images/entities/char_2009.gif) : :![[thin space (1/6-em)]](https://www.rsc.org/images/entities/char_2009.gif) LiCl = 100 LiCl = 100![[thin space (1/6-em)]](https://www.rsc.org/images/entities/char_2009.gif) : :![[thin space (1/6-em)]](https://www.rsc.org/images/entities/char_2009.gif) 10 10 |
| LO20 | Mg(OH)2![[thin space (1/6-em)]](https://www.rsc.org/images/entities/char_2009.gif) : :![[thin space (1/6-em)]](https://www.rsc.org/images/entities/char_2009.gif) LiOH = 100 LiOH = 100![[thin space (1/6-em)]](https://www.rsc.org/images/entities/char_2009.gif) : :![[thin space (1/6-em)]](https://www.rsc.org/images/entities/char_2009.gif) 20 20 |
| L10/LO10 | Mg(OH)2![[thin space (1/6-em)]](https://www.rsc.org/images/entities/char_2009.gif) : :![[thin space (1/6-em)]](https://www.rsc.org/images/entities/char_2009.gif) LiCl LiCl![[thin space (1/6-em)]](https://www.rsc.org/images/entities/char_2009.gif) : :![[thin space (1/6-em)]](https://www.rsc.org/images/entities/char_2009.gif) LiOH = 100 LiOH = 100![[thin space (1/6-em)]](https://www.rsc.org/images/entities/char_2009.gif) : :![[thin space (1/6-em)]](https://www.rsc.org/images/entities/char_2009.gif) 10 10![[thin space (1/6-em)]](https://www.rsc.org/images/entities/char_2009.gif) : :![[thin space (1/6-em)]](https://www.rsc.org/images/entities/char_2009.gif) 10 10 |
| MgO–W | MgO samples devoid of the Li compounds |
2.2. Hydration reaction test conducted using thermobalance
The reactivities of all the samples were determined using a thermobalance (TGD-9600 series, ADVANCE RIKO, Inc.). The samples (20 mg) were charged into a Pt cell.The conditions for the hydration reaction have been presented: the sample was heated from room temperature (r. t.) to 120 °C at a heating rate of 20 °C min−1. The temperature was maintained at 120 °C for 30 min. The flow of Ar gas was maintained at 100 mL min−1 to remove traces of physically adsorbed water. Following this, the sample was dehydrated at a temperature of 350 °C at a rate of 20 °C min−1. The dehydration process was allowed to proceed for 30 min. Dehydration at 350 °C can achieve dehydration of 90% or more, which enables the sample to be hydrated from almost complete MgO. Subsequently, the sample was hydrated at different hydration temperatures (Th; 110 °C, 170 °C, or 200 °C) at a rate of −20 °C min−1. The hydration process was allowed to proceed for every 10 min up to 80 min under a mixture of Ar gas and water vapor. The saturated vapor pressures (PH2O) were 31.2 and 57.8 kPa, respectively when the saturated vapor temperatures were 70 °C and 85 °C, respectively. The pressure was controlled by controlling the water flow using a micro feeder (NP-KX-101, Nihon Seimitsu Kagaku Co. Ltd., Japan). An Ar balance was also used during the process. Subsequently, the sample was dried at the hydration temperature (110 °C, 170 °C, or 200 °C) for 30 min under an atmosphere of Ar (Fig. S1†). Following the completion of the hydration reaction, XRD and FT-IR techniques were used to characterize the obtained samples. The experiments were conducted in air at r. t. The samples dehydrated at a temperature of 350 °C (before carrying out the hydration process) have been represented as de-samples (dehydrated Mg(OH)2–W has been represented as de-Mg(OH)2–W) to distinguish them from the synthesized samples.
2.3. Sample characterization using the XRD technique
XRD technique was used to investigate the crystal structures of the samples. The experiments were conducted using an X-ray diffractometer (Ultima IV, Rigaku Corp., Japan) in the air at r. t. The 2θ values were in the range of 10–80° and the scan rate was 1.0° min−1 to confirm the successful preparation of the desired samples. The scan width was set at 0.01°. The scan rate was set at 10° min−1 (for reacted samples) to avoid further hydration or adsorption of water vapor on the reacted samples. The Cu-Kα radiation was used for the studies. The generator voltage was 40 kV and the current was 40 mA. Prior to conducting the experiments, the prepared samples were dried overnight at 120 °C to remove all traces of physically adsorbed water.2.4. Sample characterization using the FT-IR technique
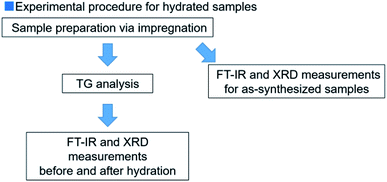
FT-IR technique was used to obtain additional information on the hydration reaction of pure and doped MgO. The spectra were recorded using an FT-IR spectrophotometer (FT/IR-4200, JASCO Corporation, Japan) in the diffuse reflectance mode in air at r. t. The spectra were recorded before and after the hydration reaction was carried out in the thermobalance. Calcium fluoride (CaF2) powder was used to calibrate the baseline values. The scan range was 5000–350 cm−1, resolution was 4.0 cm−1, and 64 scans were accumulated. The prepared samples were dried overnight at 120 °C to remove traces of physically adsorbed water prior to recording the FT-IR spectra. We reported the FT-IR spectra in the range of 5000–2750 cm−1 because we focused on the peaks derived from Mg(OH)2. The experimental procedure followed has been presented in Fig. 1.The influence of physically adsorbed water and CO2 on the results was investigated. The influence exerted by water vapor on the experimental results could be ignored because the intensities of the OH groups did not change significantly (Fig. S3†).45 We also observed that the adsorption of CO2 did not affect the reactivity of the Mg(OH)2/MgO system (Fig. S4†).45,48,70
3. Results
3.1. Sample (as-synthesized) characterization using the XRD and FT-IR techniques
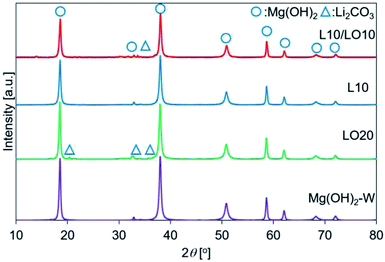 | ||
| Fig. 2 XRD patterns recorded for prepared samples. This figure is the same as the figure previously reported by us45 with permission from American Chemical Society, Copyrights 2021. | ||
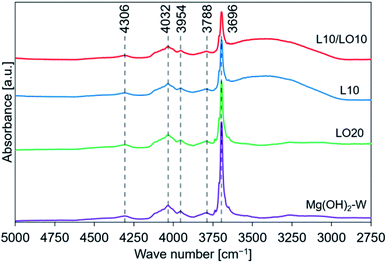 | ||
| Fig. 3 FT-IR spectral profiles recorded for prepared samples. This figure is the same as the figure previously reported by us45 with permission from American Chemical Society, Copyrights 2021. | ||
We have previously characterized the samples to investigate the states of LiCl and LiOH in the samples and reported the results.45 The previous study showed that the FT-IR spectra of LO20 prepared by physically mixing presented the peak by LiOH·H2O, while LO20 prepared by the impregnation method has no peaks due to LiOH·H2O.45 Therefore, a solid solution consisting of Mg(OH)2 and LiOH·H2O (or LiOH) could be produced by the impregnation method for LO20. A solid solution of Mg(OH)2 and LiCl could also be produced by the impregnation method because a peak shift in the XRD pattern was detected when the spectra were recorded for the LiCl-added samples (L10 and L10/LO10).45 The absence of the diffraction patterns due to LiCl can potentially account for the formation of the solid solution in LiCl-added samples (L10 and L10/LO10). It has been reported28,48,50 that a metal ion can potentially occupy the site of a magnesium ion or formation of defect sites by the metal compound doping. A literature by Housecroft et al.75 reported that the properties of magnesium and lithium are typically similar (diagonal relationships). Therefore, the formation of the solid solution by a Li+ ion substitution into a Mg2+ ion site can be reasonable.
3.2. Characterization of hydrated samples using the XRD and FT-IR techniques
| LiCl + nH2O ↔ LiCl·nH2O. | (2) |
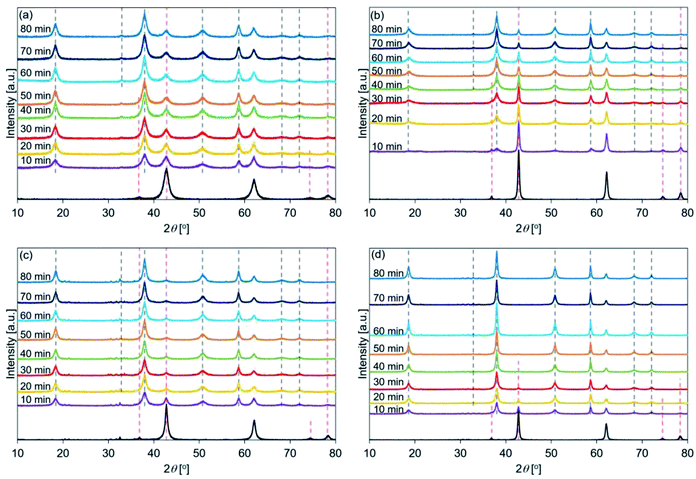
Fig. 4(c) shows that the peak intensity at 38°, corresponding to the Mg(OH)2 (002) plane in de-LO20, was stronger (post hydration; 10 min) than the peak intensity at 42° (corresponding to the MgO (200) plane). This result indicated that the addition of LiOH promoted the hydration of MgO at an early stage. Interestingly, a weak peak at 36°, corresponding to the MgO (111) plane, was detected when the de-LO20 sample was hydrated and the spectra were recorded (time: 80 min). Fig. 4(d) revealed that the peak corresponding to MgO could not be detected post hydration (time range: 50–80 min; Table 5). This indicated that the unreacted core and the inert portion of water were completely hydrated. Therefore, the addition of LiCl and LiOH resulted in the significant enhancement of the hydration reactivity of MgO.33
The patterns recorded immediately before de-L10 samples were hydrated (black line in Fig. 4(b)) present the full width at half maximum (FWHM) of the peak at 42°. This peak was sharper than the peak representing de-Mg(OH)2–W (black line in Fig. 4(a)). The FWHM recorded for de-LO20 (black line in Fig. 4(c)) was sharper than that recorded for de-Mg(OH)2–W. These results indicated that the surface states of de-L10 and de-LO20 (before hydration) were different from the surface states of de-Mg(OH)2–W. The crystallinities exhibited by de-L10 and de-LO20 were significantly higher than the crystallinity exhibited by de-Mg (OH)2–W. The order of crystallinity of the samples (before hydration) was determined: de-Mg(OH)2–W < de-LO20 < de-L10.
Fig. 5 shows the XRD patterns of the de-Mg(OH)2–W, de-L10, de-LO20, and de-L10/LO10 samples after hydration at 170 °C. The black line represents the patterns recorded immediately before the samples were hydrated at 170 °C. The hydration behavior is shown in Fig. S6.† Fig. 5 shows that the intensity of the peak corresponding to Mg(OH)2 increased with increasing hydration reaction time. Fig. 5(a) shows that the peak at 38° (in de-Mg(OH)2–W) appeared when the sample was hydrated for 30 min and the peak was assigned to Mg(OH)2 when the hydration time was 40 min (Table 2). The results revealed that the surface of MgO could be potentially hydrated during the first 10–30 min of hydration. A peak at 38° was observed in the spectra recorded with de-L10 (Fig. 5(b)). The peak was assigned to Mg(OH)2 (post hydration; 10 min; 170 °C) for the de-L10. The time taken for the peak to assign to Mg(OH)2 was shorter when de-L10 was studied than the time taken for the peak to assign to Mg(OH)2 when de-Mg(OH)2–W was studied. Fig. 5(c) reveals that for de-LO20, the peak corresponding to Mg(OH)2 appeared when the hydration time was 10 min and the temperature was 170 °C. The results obtained by analyzing the XRD data revealed that the addition of LiCl (or LiOH) promoted the hydration of MgO. The results agreed well with the results obtained by analyzing the data obtained using the TG technique (Fig. S8(b)†). Fig. 5(d) shows that the intensity of the peak corresponding to MgO (de-L10/LO10) was significantly weaker than the intensity of the peak corresponding to MgO, recorded for other samples. This indicated that the hydration process proceeded well at 170 °C. This result is in agreement with the results obtained using the TG technique (Fig. S8(b)†).
| Hydration time [min] | Th = 110 °C, peak position [cm−1] | XRD: Mg(OH)2 | XRD: MgO | |||||
|---|---|---|---|---|---|---|---|---|
| 80 | 4298 | 4036 | 3953 | 3798 | 3698 | ○ | ○ | |
| 70 | 4305 | 4033 | 3951 | 3785 | 3698 | ○ | ○ | |
| 60 | 4312 | 4036 | 3957 | 3796 | 3698 | ○ | ○ | |
| 50 | 4302 | 4034 | 3959 | 3799 | 3698 | ○ | ○ | |
| 40 | 4309 | 4032 | 3955 | 3797 | 3698 | ○ | ○ | |
| 30 | 4311 | 4032 | 3959 | 3796 | 3698 | ○ | ○ | |
| 20 | 4308 | 4030 | 3961 | 3794 | 3698 | ○ | ○ | |
| 10 | 4305 | 4034 | 3955 | 3795 | 3698 | ○ | ○ | |
| 0 | 3712 | ○ | ||||||
| Hydration time [min] | Th = 170 °C, peak position [cm−1] | XRD: Mg(OH)2 | XRD: MgO | |||||
|---|---|---|---|---|---|---|---|---|
| 80 | 4298 | 4031 | 3955 | 3699 | ○ | ○ | ||
| 70 | 4314 | 4034 | 3960 | 3700 | ○ | ○ | ||
| 60 | 4026 | 3700 | ○ | ○ | ||||
| 50 | 4029 | 3701 | ○ | ○ | ||||
| 40 | 4026 | 3701 | ○ | ○ | ||||
| 30 | 4024 | 3701 | ○ | |||||
| 20 | 3703 | ○ | ||||||
| 10 | 3707 | ○ | ||||||
| 0 | 3712 | ○ | ||||||
| Hydration time [min] | Th = 200 °C, peak position [cm−1] | XRD: Mg(OH)2 | XRD: MgO | |||||
|---|---|---|---|---|---|---|---|---|
| 80 | 3715 | ○ | ||||||
| 70 | 3761 | 3714 | ○ | |||||
| 60 | 3711 | ○ | ||||||
| 50 | 3715 | ○ | ||||||
| 40 | 3715 | ○ | ||||||
| 30 | 3714 | ○ | ||||||
| 20 | 3716 | ○ | ||||||
| 10 | 3713 | ○ | ||||||
| 0 | 3712 | ○ | ||||||
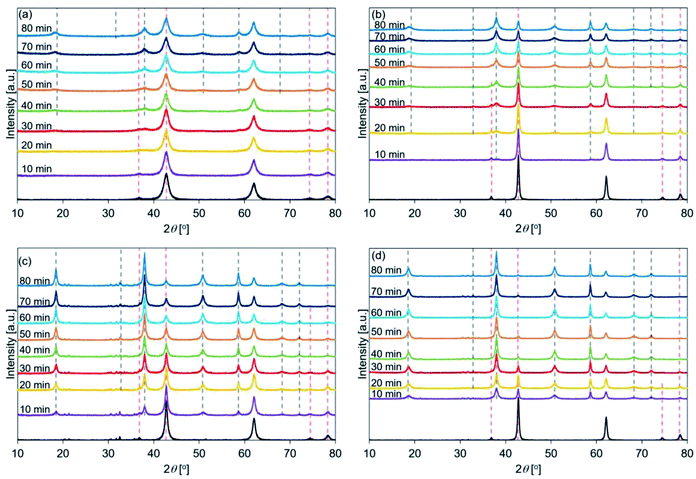
Fig. 6 shows the XRD patterns of de-Mg(OH)2–W, de-L10, de-LO20, and de-L10/LO10 post hydration at 200 °C. The black line represents the patterns recorded with the samples immediately before hydration at 200 °C. The hydration behavior is shown in Fig. S7.† Fig. 6(a) reveals that the peaks corresponding to Mg(OH)2 (in de-Mg(OH)2–W) could not be detected post hydration. This result is in agreement with the results obtained using the TG technique (Fig. S7†). Most of the samples remained as MgO. Lower hydration reactivity was achieved as the hydration temperature was increased. This agrees well with the previously reported results.24,31 These results can be attributed to the exothermic hydration reaction and/or the small driving force of the hydration reaction recorded at a high temperature (the temperature can approach the equilibrium).31,77 Fig. 6(b) shows the peaks corresponding to Mg(OH)2 in de-L10 were observed after hydration at 200 °C only for 80 min. Fig. 6(c) shows that a 10 min hydration process at a temperature of 200 °C can result in the formation of the Mg(OH)2 phase in de-LO20. This result indicated that the addition of LiOH resulted in an increase in the hydration reactivity of MgO. The extent of the increase in reactivity was larger when LiOH was added than when LiCl was added. The results agreed well with the results obtained using the TG technique and the results reported previously33 (Fig. S7†). Fig. 6(d) shows that the Mg(OH)2 peak at 38° appears post hydration (time: 10 min). The intensity of the Mg(OH)2 peak was higher than the intensity of the peaks of the other samples. We used the XRD technique to confirm that de-L10/LO10 exhibited high hydration reactivity. These results agreed well with the results obtained using the TG technique and results reported previously by us (Fig. S5–S7†).33
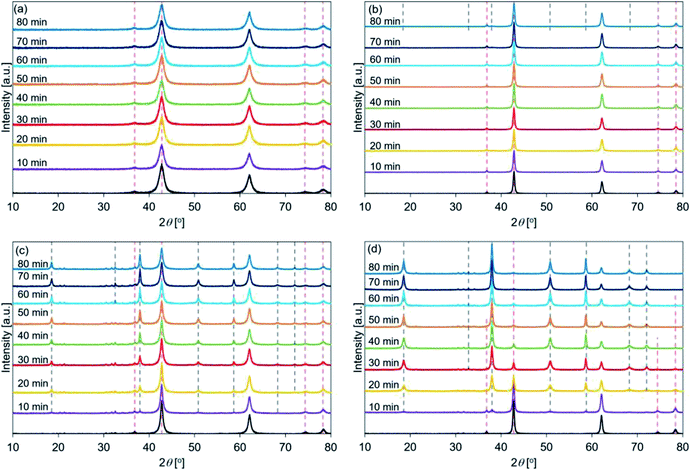
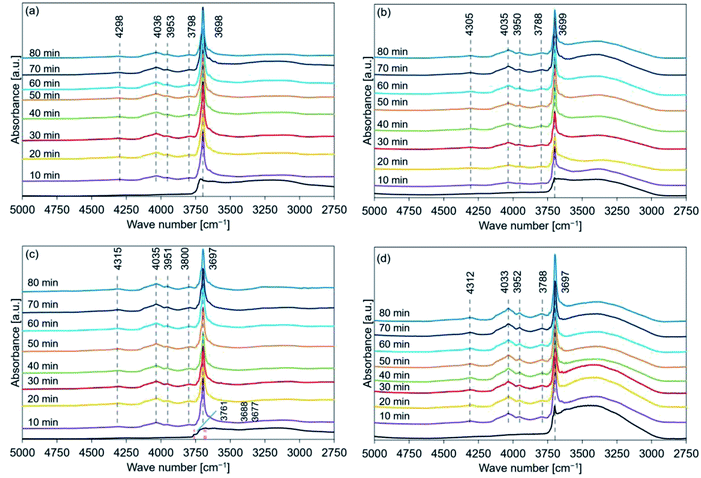
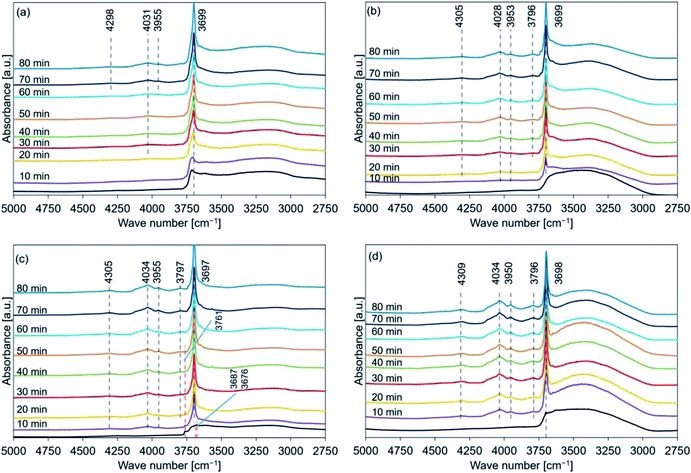
Fig. 8 shows the FT-IR spectral profiles of de-Mg(OH)2–W, de-L10, de-LO20, and de-L10/LO10 post hydration at 170 °C. The black lines represent the spectral profiles recorded immediately before hydration at 170 °C. The hydration behavior is shown in Fig. S6.† Fig. 8(a) revealed that the peak at 4030 cm−1 was detected post hydration (time: 30 min) in de-Mg(OH)2–W. A diffraction peak corresponding to Mg(OH)2 was observed at 38° (Fig. 4(a)) at this time. Surface hydration was favored when the hydration time was in the range of 10–20 min. Bulk hydration proceeded at 170 °C when the hydration time was in the range of 30–40 min. Bands at 4298 and 3955 cm−1 were observed, while the peak at 3790 cm−1 could not be detected (Table 2) when the samples were allowed to hydrate for 70 min. The peak at 3700 cm−1 shifted to a lower wavenumber region as the hydration time increased. The band at 3700 cm−1 (spectra recorded immediately before hydration at 170 °C; de-L10; black line in Fig. 8(b)) was absent. The absence of the peak could be attributed to the low intensity of the band and the presence of a prominent broad absorption band in the region of 3600–3200 cm−1. Peaks at 3699, 4028, 3953, 4305, and 3796 cm−1 were observed post hydration at a temperature of 170 °C when the hydration times were 10, 10, 10, 20, and 30 min, respectively (Table 3). The black line in Fig. 8(c) represents the shoulder (3761 cm−1) and split peaks (3687 and 3676 cm−1). These were detected in the spectra recorded with de-LO20. The spectra were recorded immediately before hydration at 170 °C. The two split peaks coalesced to form one sharp peak, which shifted to a lower wavenumber region. The peaks at 4305, 4034, 3955, and 3797 cm−1 were observed post hydration when the hydration times were 10, 10, 10, and 20 min, respectively (Table 4). The peak at 3761 cm−1 could be detected even after hydration (time: 50 min, Table 4). An analysis of the black line in Fig. 8(d) revealed that the intensity of the peak at 3700 cm−1 was significantly weak. The intensity was similar to the intensity of the peak recorded for L10 (black line in Fig. 8(b)). The peaks at 4309, 4034, 3950, and 3796 cm−1 were observed post hydration at 170 °C (time: 10 min; de-L10/LO10; Table 5). The time taken for these peaks to appear in the spectral profile was shorter in de-L10/LO10 than the time taken for these peaks to appear in the profiles recorded for other samples.
| Hydration time [min] | Th = 110 °C, peak position [cm−1] | XRD: Mg(OH)2 | XRD: MgO | ||||
|---|---|---|---|---|---|---|---|
| 80 | 4305 | 4035 | 3950 | 3788 | 3699 | ○ | ○ |
| 70 | 4310 | 4034 | 3953 | 3788 | 3699 | ○ | ○ |
| 60 | 4306 | 4031 | 3954 | 3793 | 3699 | ○ | ○ |
| 50 | 4310 | 4035 | 3950 | 3790 | 3699 | ○ | ○ |
| 40 | 4308 | 4034 | 3954 | 3787 | 3699 | ○ | ○ |
| 30 | 4310 | 4034 | 3956 | 3792 | 3699 | ○ | ○ |
| 20 | 4297 | 4035 | 3950 | 3796 | 3700 | ○ | ○ |
| 10 | 4302 | 4032 | 3959 | 3792 | 3700 | ○ | ○ |
| 0 | 3700 | ○ | |||||
| Hydration time [min] | Th = 170 °C, peak position [cm−1] | XRD: Mg(OH)2 | XRD: MgO | ||||
|---|---|---|---|---|---|---|---|
| 80 | 4305 | 4028 | 3953 | 3796 | 3699 | ○ | ○ |
| 70 | 4309 | 4036 | 3950 | 3789 | 3700 | ○ | ○ |
| 60 | 4309 | 4032 | 3956 | 3796 | 3700 | ○ | ○ |
| 50 | 4316 | 4035 | 3954 | 3792 | 3699 | ○ | ○ |
| 40 | 4306 | 4032 | 3956 | 3788 | 3700 | ○ | ○ |
| 30 | 4293 | 4030 | 3953 | 3789 | 3700 | ○ | ○ |
| 20 | 4291 | 4028 | 3953 | 3700 | ○ | ○ | |
| 10 | 4031 | 3958 | 3701 | ○ | ○ | ||
| 0 | ○ | ||||||
| Hydration time [min] | Th = 200 °C, peak position [cm−1] | XRD: Mg(OH)2 | XRD: MgO | ||||
|---|---|---|---|---|---|---|---|
| 80 | 3699 | ○ | ○ | ||||
| 70 | 3699 | ○ | |||||
| 60 | 3699 | ○ | |||||
| 50 | 3699 | ○ | |||||
| 40 | 3699 | ○ | |||||
| 30 | 3699 | ○ | |||||
| 20 | ○ | ||||||
| 10 | ○ | ||||||
| 0 | ○ | ||||||
| Hydration time [min] | Th = 110 °C, peak position [cm−1] | XRD: Mg(OH)2 | XRD: MgO | ||||||
|---|---|---|---|---|---|---|---|---|---|
| 80 | 4315 | 4035 | 3951 | 3800 | 3697 | ○ | ○ | ||
| 70 | 4305 | 4034 | 3955 | 3792 | 3696 | ○ | ○ | ||
| 60 | 4308 | 4035 | 3953 | 3796 | 3697 | ○ | ○ | ||
| 50 | 4305 | 4036 | 3955 | 3791 | 3697 | ○ | ○ | ||
| 40 | 4307 | 4033 | 3956 | 3793 | 3696 | ○ | ○ | ||
| 30 | 4305 | 4035 | 3953 | 3786 | 3697 | ○ | ○ | ||
| 20 | 4300 | 4035 | 3955 | 3787 | 3697 | ○ | ○ | ||
| 10 | 4299 | 4034 | 3954 | 3798 | 3698 | ○ | ○ | ||
| 0 | 3761 | 3688 | 3677 | ○ | |||||
| Hydration time [min] | Th = 170 °C, peak position [cm−1] | XRD: Mg(OH)2 | XRD: MgO | ||||||
|---|---|---|---|---|---|---|---|---|---|
| 80 | 4305 | 4034 | 3955 | 3797 | 3697 | ○ | ○ | ||
| 70 | 4312 | 4032 | 3953 | 3792 | 3697 | ○ | ○ | ||
| 60 | 4310 | 4033 | 3951 | 3794 | 3697 | ○ | ○ | ||
| 50 | 4314 | 4035 | 3953 | 3792 | 3757 | 3697 | ○ | ○ | |
| 40 | 4304 | 4032 | 3955 | 3787 | 3757 | 3698 | ○ | ○ | |
| 30 | 4298 | 4031 | 3951 | 3794 | 3756 | 3697 | ○ | ○ | |
| 20 | 4301 | 4035 | 3958 | 3794 | 3757 | 3697 | ○ | ○ | |
| 10 | 4302 | 4035 | 3953 | 3761 | 3697 | ○ | ○ | ||
| 0 | 3762 | 3687 | 3676 | ○ | |||||
| Hydration time [min] | Th = 200 °C, peak position [cm−1] | XRD: Mg(OH)2 | XRD: MgO | ||||||
|---|---|---|---|---|---|---|---|---|---|
| 80 | 4302 | 4032 | 3956 | 3794 | 3758 | 3697 | ○ | ○ | |
| 70 | 4304 | 4034 | 3951 | 3788 | 3761 | 3697 | ○ | ○ | |
| 60 | 4300 | 4032 | 3951 | 3788 | 3763 | 3696 | ○ | ○ | |
| 50 | 4301 | 4033 | 3957 | 3762 | 3696 | ○ | ○ | ||
| 40 | 4305 | 4033 | 3953 | 3761 | 3696 | ○ | ○ | ||
| 30 | 4297 | 4034 | 3952 | 3761 | 3696 | ○ | ○ | ||
| 20 | 4296 | 4034 | 3952 | 3761 | 3696 | ○ | ○ | ||
| 10 | 4031 | 3950 | 3761 | 3696 | ○ | ○ | |||
| 0 | 3761 | 3686 | 3676 | ○ | |||||
| Hydration time [min] | Th = 110 °C, peak position [cm−1] | XRD: Mg(OH)2 | XRD: MgO | ||||
|---|---|---|---|---|---|---|---|
| 80 | 4312 | 4033 | 3952 | 3788 | 3697 | ○ | |
| 70 | 4308 | 4034 | 3954 | 3793 | 3697 | ○ | |
| 60 | 4309 | 4033 | 3952 | 3793 | 3697 | ○ | |
| 50 | 4307 | 4032 | 3951 | 3787 | 3698 | ○ | |
| 40 | 4312 | 4031 | 3955 | 3788 | 3697 | ○ | ○ |
| 30 | 4300 | 4032 | 3950 | 3788 | 3698 | ○ | ○ |
| 20 | 4302 | 4034 | 3951 | 3799 | 3698 | ○ | ○ |
| 10 | 4316 | 4034 | 3956 | 3794 | 3698 | ○ | ○ |
| 0 | 3700 | ○ | |||||
| Hydration time [min] | Th = 170 °C, peak position [cm−1] | XRD: Mg(OH)2 | XRD: MgO | ||||
|---|---|---|---|---|---|---|---|
| 80 | 4309 | 4034 | 3950 | 3796 | 3698 | ○ | ○ |
| 70 | 4306 | 4035 | 3953 | 3788 | 3698 | ○ | ○ |
| 60 | 4303 | 4034 | 3953 | 3793 | 3698 | ○ | ○ |
| 50 | 4307 | 4032 | 3955 | 3793 | 3698 | ○ | ○ |
| 40 | 4307 | 4033 | 3953 | 3787 | 3698 | ○ | ○ |
| 30 | 4312 | 4032 | 3957 | 3790 | 3698 | ○ | ○ |
| 20 | 4310 | 4036 | 3956 | 3793 | 3698 | ○ | ○ |
| 10 | 4308 | 4031 | 3954 | 3787 | 3699 | ○ | ○ |
| 0 | 3699 | ○ | |||||
| Hydration time [min] | Th = 200 °C, peak position [cm−1] | XRD: Mg(OH)2 | XRD: MgO | ||||
|---|---|---|---|---|---|---|---|
| 80 | 4311 | 4033 | 3953 | 3787 | 3698 | ○ | ○ |
| 70 | 4303 | 4033 | 3952 | 3788 | 3698 | ○ | ○ |
| 60 | 4310 | 4033 | 3951 | 3794 | 3698 | ○ | ○ |
| 50 | 4308 | 4032 | 3951 | 3788 | 3698 | ○ | ○ |
| 40 | 4313 | 4033 | 3952 | 3788 | 3698 | ○ | ○ |
| 30 | 4303 | 4035 | 3954 | 3800 | 3698 | ○ | ○ |
| 20 | 4306 | 4031 | 3951 | 3788 | 3698 | ○ | ○ |
| 10 | 4031 | 3948 | 3699 | ○ | ○ | ||
| 0 | 3699 | ○ | |||||
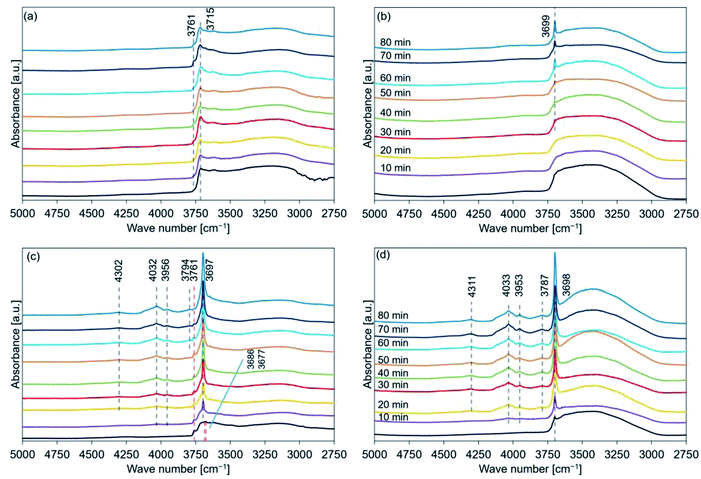
Fig. 9 shows the FT-IR spectral profiles of de-Mg(OH)2–W, de-L10, de-LO20, and de-L10/LO10. The spectra were recorded post hydration at a temperature of 200 °C. The black lines represent the spectra recorded immediately before the samples were hydrated. The hydration behavior is shown in Fig. S7.† Absorption bands were observed at 3761 and 3715 cm−1 for de-Mg(OH)2–W (Fig. 9(a)). The intensity and the position of the band originally at 3715 cm−1 (in the spectral profile of de-Mg(OH)2–W) hardly changed when the temperature was 200 °C. The shoulder band at 3761 cm−1 (assigned to the hydroxyl groups present on the MgO surface) appeared post hydration. This indicated that the decomposition of Mg(OH)2 was favored over the hydration of MgO at 200 °C. Fig. 9(b) shows that the peak at 3700 cm−1 (in the spectral profile of de-L10) did not appear during the first 20 min of hydration when the temperature was 200 °C. The absence could be attributed to the weak peak intensity. The intensity of the peak increased when the sample was hydrated over a period of 30 min. This indicated that the sample surface was continuously getting hydrated. However, bands in the range of 4300–3790 cm−1, attributable to the bulk OH groups, were not observed. The black line in Fig. 9(c) shows a shoulder peak at 3761 cm−1 and split peaks at approximately 3700 cm−1 (3686 and 3676 cm−1). These peaks appeared in the spectral profiles when the spectra were recorded with de-LO20 immediately before hydration at 200 °C. The two split peaks coalesced to form one sharp peak post hydration (time: 10 min). The single peak shifted to a lower wavenumber region. The peaks at 4032, 3956, 4302, and 3794 cm−1 were observed post hydration when the hydration times were 10, 10, 20, and 60 min, respectively (Table 4). The shoulder peak at 3761 cm−1 was observed in the spectral profile (Fig. 9(c)). This indicated that the hydration reaction path was influenced by the addition of LiOH and/or the hydration temperature. We used the FT-IR technique to confirm that the addition of LiCl (or LiOH) promoted the hydration of MgO. Results from the experiments conducted using the FT-IR technique also revealed that the extent of the positive effect exerted by LiOH on the hydration process was larger than the extent of the positive effect exerted by LiCl. These results agreed well with the results obtained using the TG and XRD techniques. Fig. 9(d) shows that the peaks at 4033, 3953, 4311, and 3787 cm−1 appeared post hydration when the hydration times were 10, 10, 20, and 20 min, respectively (Table 5). Fig. 7–9(d) reveal that the addition of LiCl and LiOH result in a significant increase in the hydration reactivity of MgO. This result agreed well with the results obtained using the TG and XRD techniques and the results previously reported by us.33
The data presented in Tables 2–5 reveal the relationship between the peak positions (in the FT-IR spectral profiles) and the hydration reaction time (at three different hydration reaction temperatures). The circles in the tables indicate the presence of the Mg(OH)2 (or MgO) phase. Peaks corresponding to these phases were observed in the recorded XRD patterns.
Analysis of the Fig. S8(b) and (c)† revealed that the measured Δx1 values (expressed as percentages) for de-Mg(OH)2–W hydrated at 170 °C (time: 30 min) and de-L10 hydrated at 200 °C for 70 min were 11% and 5%, respectively. Peaks indicating the presence of the Mg(OH)2 phases were not observed in the diffraction patterns recorded for de-Mg(OH)2–W and de-L10 (Fig. 5(a) and 6(b), respectively). The FT-IR spectra of the de-Mg(OH)2–W and de-L10 samples post hydration at 170 °C (time: 30 min) and 200 °C (time: 70 min), respectively, revealed the presence of the absorption bands at 3700 cm−1. These bands were assigned to the surface OH groups (Fig. 8(a) and 9(b)).63–66,68 The results indicated that bulk information could be obtained by analyzing the XRD patterns. Peaks corresponding to structural water (described as Δxs; Experimental section in ESI†) were not observed in the XRD patterns recorded with the samples immediately before they were hydrated (black lines in Fig. 4–6). A peak at 3700 cm−1 was observed in the FT-IR spectral profiles recorded immediately before the samples were hydrated (black lines in Fig. 7–9). The absorption band corresponding to the surface OH groups present on Mg(OH)2 or MgO did not completely disappear post dehydration at a temperature of 350 °C. Therefore, the mole fraction of Mg(OH)2 remaining as structural water (see the ESI†) post dehydration at 350 °C can be attributed to such surface OH groups, indicating that magnesium oxide could potentially form the bulk state of the samples.
Mutch et al. investigated the ability of MgO to capture carbon. They reported that MgO calcined at 800 °C exhibited a higher carbon capacity (for CO2) compared to that calcined at 400 °C.79 In their study, the peak at 3760 cm−1, in the spectral profile recorded for MgO calcined at 800 °C, was assigned to a 100% H-covered O-terminated (111) plane. They used DFT calculations to arrive at the conclusions.79 The position of this peak and the position of the shoulder peak (3761 cm−1) observed by us agreed well with each other (Fig. 7–9(c)). Fig. S10† (previously reported by us45) was revised as shown in Fig. 10.
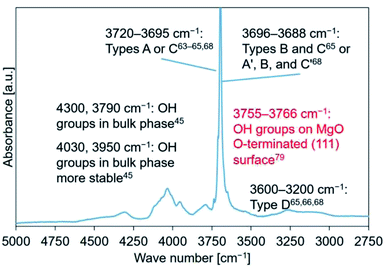 | ||
| Fig. 10 FT-IR spectral profile recorded for Mg(OH)2–W. Literature reports were referred to for peak assignment.45,63–66,68,79 | ||
4. Discussion
4.1. Effect of the addition of LiCl and/or LiOH on the hydration of MgO
The XRD data presented in Section 3.2.1 suggested the presence of an unreacted core and/or inert portion of water in de-Mg(OH)2–W, de-L10, and de-LO20. The Δx1 values recorded for de-L10, de-LO20, and de-L10/LO10 were always higher (at all hydration temperatures) than the Δx1 values recorded for the de-Mg(OH)2–W samples (Fig. S8†). These results indicated that the addition of LiCl and/or LiOH promoted the hydration of MgO in the unreacted core and/or inert portion of water. The addition can also help lower the activation energy of the process.For the hydration of the MgO with added-LiCl (de-L10, and de-L10/LO10) at 110 °C, the hydration of LiCl was favored at this temperature. The water molecules present in hydrated LiCl species interacted with MgO.24,33 This can be one of the effects of the addition of LiCl on the hydration. The hydration of LiCl, however, unnecessarily positively affected the hydration of MgO, because the value of Δx1 for de-L10 at 110 °C and 31.2 kPa for 80 min was lower than that for de-Mg(OH)2–W (Fig. S11†). At higher temperatures of 170 °C and 200 °C, the hydration of LiCl was not favored (the values of Δx2 recorded for de-L10 and de-L10/LO10 (Fig. S8(b) and (c),† respectively) were low). Hence, the hydration of LiCl did not exert a significant effect on the hydration of MgO. However, the fact that the addition of LiCl enhanced the hydration reactivity of MgO suggested that other factors affected the hydration of MgO. Finocchi et al.57 performed DFT calculations to investigate the process of water adsorption on a MgO (100) surface containing an oxygen vacancy. They reported that the lattice defect was occupied by the O atom of H2O.57 Asaduzzaman performed DFT-based calculations. The results revealed that the adsorption energy for water molecules adsorbed on the MgO (111) surface containing the lattice defects was significantly low.60 We have previously reported that lattice defects (such as OH−) could be produced by Li+ ion substitution into Mg2+ sites.45 This indicated that dehydration could result in the creation of oxygen vacancies. These results indicated that the substitution with Li+ could promote the process of hydration (in defect sites). We have previously reported45 that OH− defects in bulk Mg(OH)2 can be created in the presence of LiCl. The addition of LiCl probably results in the formation of O2− vacancies in MgO bulk post dehydration. This process promotes the hydration process in the bulk phase. On the other hand, effective hydration could not be achieved for de-L10 at a temperature of 200 °C. Rapid hydration can be observed in the bulk phase if the surface hydration and/or water adsorption process proceeds smoothly.
The Δx1 values recorded at 200 °C for de-LO20 and de-L10/LO10 were significantly higher than those recorded for de-Mg(OH)2–W and de-L10 (Fig. S8(c)†). It is worth noting that the Δx1 value recorded for de-L10/LO10 reached 90% when the sample was hydrated at a temperature of 200 °C for 80 min. The addition of LiOH exerted a positive effect on the MgO hydration process. A cumulative effect was observed when LiCl was added. We have discussed the reasons behind the significant increase in the hydration reactivity of the samples (de-LO20 and de-L10/LO10) containing LiOH as the additive. We have previously reported45 that the addition of LiOH results in the formation of surface defects on the surface of Mg(OH)2. The number of surface defects produced was larger when LiOH was added than the number of surface defects produced when LiCl was added. Thus, the surface defects possibly promoted the process of surface hydration (for MgO) in the presence of LiOH. The shoulder peak at 3760 cm−1 (assigned to the isolated hydroxyl groups on the MgO (111) surface;79 de-LO20) should have disappeared in the spectral profiles recorded during the early stages of hydration if the surface defects produced following the process of Li+ ion substitution promotes surface hydration (Fig. 8(c) and 9(c)). Therefore, it is believed that the addition of LiOH promotes the diffusion of water into the bulk phase through the surface defects. The (111) plane can be observed in the XRD patterns recorded for de-LO20 (Fig. 3–5(c)) post hydration (time: 80 min). Some researchers have reported that compared to the MgO (100) plane, it is easier to hydrate the MgO (111) plane.51,55,56,60 These results indicate that the sites that can be easily hydrated can be potentially generated by adding LiOH.
Amaral et al. reported a probable mechanism for the hydration of MgO. The hydration process proceeded in the presence of liquid water and the mechanism can be expressed as follows:80
(1) MgO-alkaline oxide plays an electron donator role in water:
| MgO(s) + H2O(l) → MgOH(surface)+ + OH(aq)−. | (3) |
(2) OH− anions are adsorbed in the positively charged surface:
| MgOH(surface)+ + OH(aq)− → MgOH+·OH(surface)−. | (4) |
(3) OH− anions are desorbed from the surface, releasing magnesium ions into the solution:
| MgOH+·OH(surface)− → Mg(aq)2+ + 2OH(aq)−. | (5) |
(4) Ions concentration reaches the solution super-saturation, at which point the hydroxide starts to precipitate on the oxide surface:
| Mg(aq)2+ + 2OH(aq)− → Mg(OH)2(s). | (6) |
Amaral et al.80 reported that the extent of hydration of MgO in the presence of a solution of KOH increased with an increase in the concentration of the solution. A high concentration of OH− (a solution of KOH is being used) can potentially cause a shift in the equilibrium, resulting in the promotion of hydration (eqn (6)).80 The data presented in Fig. S12 and Table S1† show that the hydration reactivity of LiOH/MgO increase with an increase in the mole ratio of LiOH (used as an additive). Fig. S13(a) and (b)† show the FT-IR spectral profiles of LO20, LO25, LO30, and LO50 prepared following the impregnation and physical mixing methods, respectively. The absence of the peaks corresponding to LiOH·H2O revealed that a solid solution of LiOH and Mg(OH)2 (for LO20) could be produced following the impregnation method. When the spectra were recorded for LO20 (prepared following the physical mixing method), peaks corresponding to LiOH·H2O were observed.45 A peak at 3654 cm−1 was observed in the spectra recorded for impregnated LO25, LO30, and LO50 (Fig. S13(a)†). This indicated that limited numbers of Mg2+ ion sites could be substituted by Li+ ions. It was observed that the number (concentration) of OH− in LiOH potentially affected the hydration of MgO (Fig. S12 and Table S1†). However, the effects of other hydroxides (e.g., NaOH and KOH) on the extent of hydration should be studied to determine if the concentration of OH− affects the hydration reactivity.
It was observed that the addition of LiOH could potentially promote the diffusion of H2O into the MgO bulk phase (particularly at higher temperatures) because the number of surface defects produced was large under the reported conditions and a shift in the equilibrium toward the direction of the formation of Mg(OH)2 could be achieved. The addition of LiCl could potentially promote the hydration of the MgO bulk phase. The extent of hydration depended on the rate of the surface hydration reaction. For the hydration of LiCl and LiOH co-added MgO, these two effects simultaneously contributed to the promotion of the diffusion of H2O into the bulk phase. The hydration process (MgO bulk phase) was also promoted.
4.2. Hydration of pure and chemically-modified MgO: probable hydration pathway
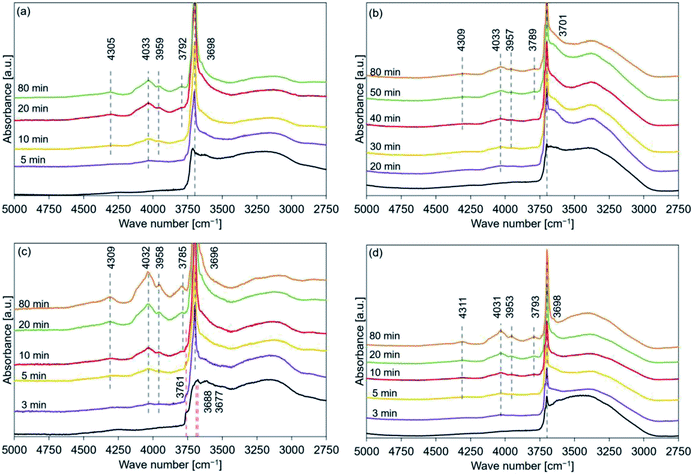
The data presented in Tables 2–5 reveal that the major peaks at 4300, 4030, 3950, 3790, and 3700 cm−1 could be observed in the spectral profiles of all the samples hydrated at 110 °C (time: 10 min). The peaks at 4030 and 3950 cm−1 appeared during the early stages of the hydration process at 170 and 200 °C (after the peak at 3700 cm−1 appeared). The peaks at 4030 and 3950 cm−1 were assigned to the OH groups present in the stable bulk phase.45 The peaks at 4300 and/or 3790 cm−1 should appear during the early stages of hydration if the hydration process progresses starting from the sample surface (the peaks at 4300 and 3790 cm−1 could not be detected during the early stages of dehydration45). FT-IR spectra were recorded for samples hydrated at 110 °C (PH2O: 31.2 kPa) to detect the order of peak appearance when the effect of hydration temperature could be neglected (Fig. 11). Analysis of the figures revealed that the peaks at 4030 and 3950 cm−1 appeared after the peak at 3700 cm−1 appeared. Following this, the peak at 4300 cm−1 appeared and finally, the peak at 3790 cm−1 appeared. The trend of peak detection was found to be similar for all the samples and was independent of the hydration temperatures.Therefore, the hydration of MgO (stable bulk phase) could proceed when the surface hydration process had proceeded to some extent. These results indicated that the hydration reaction was not merely a backward reaction of the dehydration reaction involving Mg(OH)2.69 This can be potentially attributed to the fact that the dehydration process resulted in the formation of the defect sites54,81,82 and cracks. A reduction in the particle volume52–54 and/or an increase in the specific surface area could also be achieved.53,81,83,84 These can potentially promote the process of diffusion of water into the porous bulk structure.76 Water diffusion could be ascribed to the drastic hydration conversion change at the initial hydration stage76 (Fig. S5(a)†).
Some researchers have reported the mechanism of MgO hydration. Kato et al. studied the kinetics of the MgO hydration process and assumed that the process could be divided into four stages: (1) containment of water as fixed structural water, (2) physical adsorption of water, (3) chemical reaction with water producing Mg(OH)2, and (4) the participation of the inert portion of water.20 Sharma et al. concluded that the hydroxylation of the dehydroxylated Mg(OH)2 occurs over several steps: In the first step, Mg(OH)2 nanocrystal form. In the second step, rapid intergrowth of the Mg(OH)2 nanocrystals can be observed. The third step involves the rapid formation, and annealing out of the resulting crystal defects (e.g., edge dislocations) formed during the intergrowth of the nanocrystals. Fast mobility of the hydroxides can also be observed at this stage. High surface mobility of the participating Mg-containing species is observed in the fourth stage. This further promotes the growth of the Mg(OH)2 crystals.54 Rocha et al. investigated the MgO hydration process in the presence of liquid water: (1) water is first adsorbed on the surface. Simultaneous diffusion of water into the porous MgO particles can also be observed, (2) dissolution of oxide occurs within the particles. The porosity of the samples changes with time, and (3) nucleation and growth of Mg(OH)2 on the surface of MgO occurs. The surface becomes supersaturated.76 We referred to the previously reported results and the results presented in Fig. 11 and modeled the hydration reaction pathway of pure MgO (Fig. 12). The relevant FT-IR spectral profiles have been shown in Fig. 10. Initially, the sample surface adsorbs the water molecules. Following this, the surface is hydrated. Subsequently, water vapor diffuses into the porous MgO particles and the nucleation of Mg(OH)2 occurs. Finally, the intergrowth of the Mg(OH)2 layer is favored. Kondo et al. investigated the hydration mechanism of MgO by NIR spectroscopy, indicating that Mg(OH)2 sheets were stacked on MgO surface.69 This mechanism can be the detail surface hydration of MgO. To the contrary, the hydration mechanism cannot be the same as our case because the pretreatment temperature of Mg(OH)2 to form MgO was 600 °C in the previous study. Therefore, the state of MgO before the hydration could affect the mechanism.
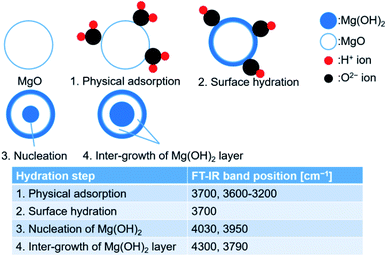 | ||
| Fig. 12 Probable mechanism of hydration for pure MgO. Corresponding FT-IR spectral profiles have been presented in Fig. 10. | ||
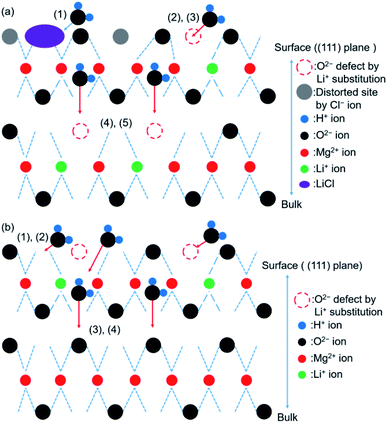
A schematic representation of the probable mechanism of the hydration reaction involving LiCl/MgO has been presented in Fig. 13(a). We assumed that the first step of hydration involved the adsorption of water on the (111) surface of MgO.60 The hydration of LiCl was favored under conditions suitable for the formation of the hydrated LiCl species (e.g., Th = 110 °C, PH2O = 57.8 kPa). The formation of the defect sites (Li+ substitution) promoted the process of surface hydration. The hydration steps 4 and 5 in LiCl/MgO are the same as the steps 3 and 4 shown in Fig. 12. The pathway of hydration was the same as the pathway followed for the hydration of pure MgO under unfavorable conditions (Th = 170 or 200 °C) of forming hydrated LiCl species (Fig. 12).
A schematic representation of the probable mechanism of the hydration reaction involving LiOH/MgO has been presented in Fig. 13(b). The overall reaction steps involved in the hydration of LiOH/MgO are similar to the reaction steps involved in the hydration process of pure MgO. The first step involves the hydration of the sample. This step is different for different samples (pure MgO and LiCl/MgO). It took 10–20 min for the peak at 3760 cm−1 to disappear when the sample was de-LO20 (Fig. 11(c)) and ∼5 min when the sample was de-MgO–W (Fig. S14†). Despite the high hydration reactivity exhibited by de-LO20, the time taken for the peak to disappear was longer. As the peak at 3760 cm−1 (ascribed to the hydrogen-covered O-terminated (111) plane) did not disappear during the early stages of hydration, water vapor could diffuse from the (111) plane into the bulk MgO phase. This resulted in an increase in the rate of hydration (steps 3 and 4; Fig. 12). The increase in the rate can be attributed to the addition of LiOH.
The hydration process of LiCl and/or LiOH-added MgO, of course, should be studied in detail using computational simulation methods.
5. Conclusions
The effect of the addition of LiCl and/or LiOH on the hydration reaction and the MgO hydration mechanism was studied using the XRD and FT-IR techniques. It was confirmed that the addition of LiCl and/or LiOH resulted in an increase in the hydration reactivity of MgO. The addition of LiOH promoted hydration at 200 °C. We indicated that the addition of Li compounds promoted the reaction occurring on the defect sites. Substitution using Li+ helped the promotion of the reactions. Similar observations have been reported in the literature. The addition of LiCl resulted in the formation of defect sites in the bulk phase. This promoted the hydration of the samples in the bulk phase of MgO. The addition of LiOH promoted the diffusion of H2O into bulk MgO through the surface O2− defects. Results obtained from the experiments conducted using the TG technique revealed that the concentration of OH− can potentially influence the hydration reactivity of the samples. The hydration reactivity increased with an increase in the LiOH content. Therefore, the addition of LiCl and LiOH affected the extent of hydration of LiCl and LiOH-added MgO.It has been proposed that the hydration reaction (hydration of pure MgO) proceeds over four steps:
(1) Physical adsorption, (2) surface hydration, (3) nucleation of Mg(OH)2, and (4) inter-growth of the Mg(OH)2 layer.
The hydration of LiCl (for LiCl/MgO) is favored under conditions of Th = 110 °C and PH2O = 57.8 kPa. After that, the MgO hydration reaction proceeded. The initial step involved in the hydration of LiOH/MgO was different from the initial step involved in the hydration of pure MgO and LiCl/MgO samples. The results and observations indicated that the diffusion of water from the (111) surface of MgO into the bulk phase could be promoted.
Further studies on the reaction mechanism involving LiCl and/or LiOH-added MgO should be conducted. In addition, the hydration behavior of MgO is typically affected by pretreatment condition of Mg(OH)2.84 Therefore, considered the combination with chemical heat pump, the investigation of pretreat condition is necessary to optimize the reaction condition for future study. The properties that affect the reactivity of the Mg(OH)2/MgO system should be studied in detail for the further development of the system. This can also help in designing the materials that can be used for storing chemical heat.
Author contributions
Ryo Kurosawa has carried out the overall experimental procedures and written and edited the present manuscript. Masato Takeuchi has discussed the spectra assignment and reviewed the manuscript. Junichi Ryu has supervised and reviewed the manuscript, and acquired the founding resources.Conflicts of interest
There are no conflicts to declare.Acknowledgements
This study was supported by the Frontier Science Program of Chiba University, VBL Program of Chiba University, Center for Analytical Instrumentation in Chiba University, Futaba Research Grant Program of the Futaba Foundation, Tanigawa Foundation, and Strategic Innovation Program for Energy Conservation Technologies (New Energy and Industrial Technology Development Organization; NEDO, Japan). We would also like to thank Editage (https://www.editage.com) for English language editing.Notes and references
- R. Tiskatine, R. Oaddi, R. Ait El Cadi, A. Bazgaou, L. Bouirden, A. Aharoune and A. Ihlal, Suitability and characteristics of rocks for sensible heat storage in CSP plants, Sol. Energy Mater. Sol. Cells, 2017, 169, 245–257 CrossRef CAS.
- J. Liu, Z. Chang, L. Wang, J. Xu, R. Kuang and Z. Wu, Exploration of basalt lasses as high-temperature sensible heat storage materials, ACS Omega, 2020, 5, 19236–19246 CrossRef CAS PubMed.
- T. Nomura, C. Zhu, N. Sheng, G. Saito and T. Akiyama, Microencapsulation of metal-based phase change material for high-temperature thermal energy storage, Sci. Rep., 2015, 5, 9117 CrossRef CAS PubMed.
- T. Nomura, N. Sheng, C. Zhu, G. Saito, D. Hanzaki, T. Hiraki and T. Akiyama, Microencapsulated phase change materials with high heat capacity and high cyclic durability for high-temperature thermal energy storage and transportation, Appl. Energy, 2017, 188, 9–18 CrossRef CAS.
- H. Neumann, D. Burger, Y. Taftanazi, M. P. Alferez Luna, T. Haussmann, G. Hagelstein and S. Gschwander, Thermal stability enhancement of D-mannitol for latent heat storage applications, Sol. Energy Mater. Sol. Cells, 2019, 200, 109913 CrossRef CAS.
- D. G. Prajapati and B. Kandasubramanian, Biodegradable polymeric solid framework-based organic phase change materials for thermal energy storage, Ind. Eng. Chem. Res., 2019, 58, 10652–10677 CrossRef CAS.
- H. Sakai, N. Sheng, A. Kurniawan, T. Akiyama and T. Nomura, Fabrication of heat storage pellets composed of microencapsulated phase change material for high-temperature applications, Appl. Energy, 2020, 265, 114673 CrossRef CAS.
- L. André, S. Abanades and G. Flamant, Screening of thermochemical systems based on solid–gas reversible reactions for high temperature solar thermal energy storage, Renewable Sustainable Energy Rev., 2016, 64, 703–715 CrossRef.
- P. Pardo, A. Deydier, Z. Anxionnaz–Minvielle, S. Rougé, M. Cabassud and P. A. Cognet, Review on high temperature thermochemical heat energy storage, Renewable Sustainable Energy Rev., 2014, 32, 591–610 CrossRef CAS.
- T. Yan, R. Z. Wang, T. X. Li, L. W. Wang and I. T. Fred, A review of promising candidate reactions for chemical heat storage, Renewable Sustainable Energy Rev., 2015, 43, 13–31 CrossRef CAS.
- D. Aydin, S. P. Casey and S. Riffat, The latest advancements on thermochemical heat storage systems, Renewable Sustainable Energy Rev., 2015, 41, 356–367 CrossRef CAS.
- A. J. Carrillo, J. González-Aguilar, M. Romero and J. M. Coronado, Solar energy on demand: A review on high temperature thermochemical heat storage systems and materials, Chem. Rev., 2019, 119, 4777–4816 CrossRef CAS PubMed.
- J. S. Prasad, P. Muthukumar, F. Desai, D. N. Basu and M. M. Rahman, A critical review of high-temperature reversible thermochemical energy storage systems, Appl. Energy, 2019, 254, 113733 CrossRef.
- P. F. Weck and E. Kim, Solar energy storage in phase change materials: First-principles thermodynamic modeling of magnesium chloride hydrates, J. Phys. Chem. C, 2014, 118, 4618–4625 CrossRef CAS.
- H. U. Rammelberg, T. Osterland, B. Priehs, O. Opel and W. K. L. Ruck, Thermochemical heat storage materials – Performance of mixed salt hydrates, Sol. Energy, 2016, 136, 571–589 CrossRef CAS.
- S. Li, H. Huang, X. Yang, Y. Bai, J. Li, N. Kobayashi and M. Kubota, Hydrophilic substance assisted low temperature LiOH·H2O based composite thermochemical materials for thermal energy storage, Appl. Therm. Eng., 2018, 128, 706–711 CrossRef CAS.
- P. A. J. Donkers, S. Beckert, L. Pel, F. Stallmach, M. Steiger and O. C. G. Adan, Water transport in MgSO4·7H2O during dehydration in view of thermal storage, J. Phys. Chem. C, 2015, 119, 28711–28720 CrossRef CAS.
- K. Shizume, N. Hatada, K. Toyoura and T. Uda, Characteristic microstructure underlying the fast hydration–dehydration reaction of β-La2(SO4)3: “fine platy joints” with “loose grain boundaries”, J. Mater. Chem. A, 2018, 6, 24956–24964 RSC.
- K. Shizume, N. Hatada and T. Uda, Experimental study of hydration/dehydration behaviors of metal sulfates M2(SO4)3 (M = Sc, Yb, Y, Dy, Al, Ga, Fe, In) in search of new low-temperature thermochemical heat storage materials, ACS Omega, 2020, 5, 13521–13527 CrossRef CAS PubMed.
- Y. Kato, N. Yamashita, K. Kobayashi and Y. Yoshizawa, Kinetic study of the hydration of magnesium oxide for a chemical heat pump, Appl. Therm. Eng., 1996, 16, 853–862 CrossRef CAS.
- J. Ryu, R. Takahashi, N. Hirao and Y. Kato, Effect of transition metal mixing on reactivities of magnesium oxide for chemical heat pump, J. Chem. Eng. Jpn., 2007, 40, 1281–1286 CrossRef.
- J. Ryu, N. Hirao, R. Takahashi and Y. Kato, Dehydration behavior of metal-salt-added magnesium hydroxide as chemical heat storage media, Chem. Lett., 2008, 37, 1140–1141 CrossRef CAS.
- H. Ishitobi, K. Uruma, M. Takeuchi, J. Ryu and Y. Kato, Dehydration and hydration behavior of metal–salt-modified materials for chemical heat pumps, Appl. Therm. Eng., 2013, 50, 1639–1644 CrossRef CAS.
- H. Ishitobi, N. Hirao, J. Ryu and Y. Kato, Evaluation of heat output densities of lithium chloride-modified magnesium hydroxide for thermochemical energy storage, Ind. Eng. Chem. Res., 2013, 52, 5321–5325 CrossRef CAS.
- J. Ryu, T. Mizuno, H. Ishitobi and Y. Kato, Dehydration and hydration behavior of Mg–Co mixed hydroxide as a material for chemical heat storage, J. Chem. Eng. Jpn., 2014, 47, 579–586 CrossRef CAS.
- A. Shkatulov, T. Krieger, V. Zaikovskii, Y. Chesalov and Y. Aristov, Doping magnesium hydroxide with sodium nitrate: A new approach to tune the dehydration reactivity of heat-storage materials, ACS Appl. Mater. Interfaces, 2014, 6, 19966–19977 CrossRef CAS PubMed.
- O. Myagmarjav, J. Ryu and Y. Kato, Lithium bromide-mediated reaction performance enhancement of a chemical heat-storage material for magnesium oxide/water chemical heat pumps, Appl. Therm. Eng., 2014, 63, 170–176 CrossRef CAS.
- A. Shkatulov and Y. Aristov, Modification of magnesium and calcium hydroxides with salts: An efficient way to advanced materials for storage of middle-temperature heat, Energy, 2015, 85, 667–676 CrossRef CAS.
- O. Myagmarjav, J. Ryu and Y. Kato, Dehydration kinetic study of a chemical heat storage material with lithium bromide for a magnesium oxide/water chemical heat pump, Prog. Nucl. Energy, 2015, 82, 153–158 CrossRef CAS.
- O. Myagmarjav, M. Zamengo, J. Ryu and Y. Kato, Energy density enhancement of chemical heat storage material for magnesium oxide/water chemical heat pump, Appl. Therm. Eng., 2015, 91, 377–386 CrossRef CAS.
- A. Shkatulov, H. Takasu, Y. Kato and Y. Aristov, Thermochemical energy storage by LiNO3-doped Mg(OH)2: Rehydration study, J. Energy Storage, 2019, 22, 302–310 CrossRef.
- R. Kurosawa and J. Ryu, Effect of LiOH addition on dehydration reaction of Mg(OH)2, J. Chem. Eng. Jpn., 2019, 52, 152–158 CrossRef CAS.
- R. Kurosawa, M. Takeuchi and J. Ryu, Comparison of the effect of coaddition of Li compounds and addition of a single Li compound on reactivity and structure of magnesium hydroxide, ACS Omega, 2019, 4, 17752–17761 CrossRef CAS PubMed.
- K. Saitou, R. Kurosawa and J. Ryu, Dehydration and hydration reactivity of citrate-added Mg(OH)2 for thermochemical energy storage, Tetsu to Hagane, 2020, 106, 546–555 Search PubMed.
- H. Ogura, T. Yamamoto and H. Kage, Efficiencies of CaO/H2O/Ca(OH)2 chemical heat pump for heat storing and heating/cooling, Energy, 2003, 28, 1479–1493 CrossRef CAS.
- J. Yan and C. Y. Zhao, Thermodynamic and kinetic study of the dehydration process of CaO/Ca(OH)2 thermochemical heat storage system with Li doping, Chem. Eng. Sci., 2015, 138, 86–92 CrossRef CAS.
- A. Maruyama, R. Kurosawa and J. Ryu, Effect of lithium compound addition on the dehydration and hydration of calcium hydroxide as a chemical heat storage material, ACS Omega, 2020, 5, 9820–9829 CrossRef CAS.
- A. I. Shkatulov, S. T. Kim, H. Miura, Y. Kato and Y. I. Aristov, Adapting the MgO–CO2 working pair for thermochemical energy storage by doping with salts, Energy Convers. Manag., 2019, 185, 473–481 CrossRef CAS.
- S. M. Babiniec, E. N. Coker, J. E. Miller and A. Ambrosini, Investigation of LaxSr1−xCoyM1−yO3−δ (M = Mn, Fe) perovskite materials as thermochemical energy storage media, Sol. Energy, 2015, 118, 451–459 CrossRef CAS.
- Z. Zhang, L. Andre and S. Abanades, Experimental assessment of oxygen exchange capacity and thermochemical redox cycle behavior of Ba and Sr series perovskites for solar energy storage, Sol. Energy, 2016, 134, 494–502 CrossRef CAS.
- A. Zaki, J. Carrasco, D. Bielsa and A. Faik, Tunable redox temperature of a Co3−xMnxO4 (0 ≤ x ≤ 3) continuous solid solution for thermochemical energy storage, ACS Appl. Mater. Interfaces, 2020, 12, 7010–7020 CrossRef CAS.
- M. Xiang, Y. Zhang, M. Hong, S. Liu, Y. Zhang, H. Liu and C. Gu, CO2 absorption properties of Ti- and Na-doped porous Li4SiO4 prepared by a sol–gel process, J. Mater. Sci., 2015, 50, 4698–4706 CrossRef CAS.
- K. Wang, W. Li, Z. Yin, Z. Zhou and P. Zhao, High-capacity Li4SiO4-based CO2 sorbents via a facile hydration–NaCl doping technique, Energy Fuels, 2017, 31, 6257–6265 CrossRef CAS.
- H. Takasu, J. Ryu and Y. Kato, Application of lithium orthosilicate for high-temperature thermochemical energy storage, Appl. Energy, 2017, 193, 74–83 CrossRef CAS.
- R. Kurosawa, M. Takeuchi and J. Ryu, Fourier-transform infrared analysis of the dehydration mechanism of Mg(OH)2 and chemically modified Mg(OH)2, J. Phys. Chem. C, 2021, 125, 5559–5571 CrossRef CAS.
- C. Chizallet, H. Petitjean, G. Costentin, H. Lauron-Pernot, J. Maquet, C. Bonhomme and M. Che, Identification of the OH groups responsible for kinetic basicity on MgO surfaces by 1H MAS NMR, J. Catal., 2009, 268, 175–179 CrossRef CAS.
- D. Cornu, H. Petitjean, G. Costentin, H. Guesmi, J. M. Krafft and H. Lauron-Pernot, Influence of natural adsorbates of magnesium oxide on its reactivity in basic catalysis, Phys. Chem. Chem. Phys., 2013, 15, 19870–19878 RSC.
- J. Sivasankari, S. Selvakumar, K. Sivaji and S. Sankar, Structural and optical characterization of MgO:X (X = Li, Na, and K) by solution combustion technique, J. Alloys Compd., 2014, 616, 51–57 CrossRef CAS.
- D. Cornu, H. Guesmi, G. Laugel, J. M. Krafft and H. Lauron-Pernot, On the relationship between the basicity of a surface and its ability to catalyze transesterification in liquid and gas phases: the case of MgO, Phys. Chem. Chem. Phys., 2015, 17, 14168–14176 RSC.
- S. Arndt, U. Simon, K. Kiefer, T. Otremba, K. Siemensmeyer, M. Wollgarten, A. Berthold, F. Schmidt, O. Görke, R. Schomäcker and K. Dinse, Li/MgO catalysts doped with alio-valent ions. Part 1: Structure, composition, and catalytic properties, ChemCatChem, 2017, 9, 3583–3596 CrossRef CAS.
- K. Refson, R. A. Wogelius and D. G. Fraser, Water chemisorption and reconstruction of the MgO surface, Phys. Rev. B: Condens. Matter Mater. Phys., 1995, 52, 10823–10826 CrossRef CAS PubMed.
- M. J. McKelvy, R. Sharma, A. V. G. Chizmeshya, R. W. Carpenter and K. Streib, Magnesium hydroxide dehydration: In situ nanoscale observations of lamellar nucleation and growth, Chem. Mater., 2001, 13, 921–926 CrossRef CAS.
- H. Pimminger, G. Habler, N. Freiberger and R. Abart, Evolution of nanostructure and specific surface area during thermally driven dehydration of Mg(OH)2, Phys. Chem. Miner., 2016, 43, 59–68 CrossRef CAS.
- R. Sharma, M. J. McKelvy, H. Béarat, A. V. G. Chizmeshya and R. W. Carpenter, In-situ nanoscale observations of the Mg(OH)2 dehydroxylation and rehydroxylation mechanisms, Philos. Mag., 2007, 84, 2711–2729 CrossRef.
- P. Geysermans, F. Finocchi, J. Goniakowski, R. Hacquart and J. Jupille, Combination of (100), (110) and (111) facets in MgO crystals shapes from dry to wet environment, Phys. Chem. Chem. Phys., 2009, 11, 2228–2233 RSC.
- D. Spagnoli, J. P. Allen and S. C. Parker, The structure and dynamics of hydrated and hydroxylated magnesium oxide nanoparticles, Langmuir, 2011, 27, 1821–1829 CrossRef CAS PubMed.
- F. Finocchi and J. Goniakowski, Interaction of a water molecule with the oxygen vacancy on the MgO(100) surface, Phys. Rev. B: Condens. Matter Mater. Phys., 2001, 64, 125426 CrossRef.
- X. L. Hu, J. Klimeš and A. Michaelides, Proton transfer in adsorbed water dimers, Phys. Chem. Chem. Phys., 2010, 12, 3953–3956 RSC.
- S. Laporte, F. Finocchi, L. Paulatto, M. Blanchard, E. Balan, F. Guyot and A. M. Saitta, Strong electric fields at a prototypical oxide/water interface probed by ab initio molecular dynamics: MgO(001), Phys. Chem. Chem. Phys., 2015, 17, 20382–20390 RSC.
- A. Asaduzzaman, The hydration of periclase: atomistic insights from quantum-chemical look, Chem. Phys., 2020, 532, 110694 CrossRef CAS.
- S. Iwasaki, S. Kodani and N. Koga, Physico-geometrical kinetic modeling of the thermal decomposition of magnesium hydroxide, J. Phys. Chem. C, 2020, 124, 2458–2471 CrossRef CAS.
- J. M. Rimsza, E. G. Sorte and T. M. Alam, Hydration and hydroxylation of MgO in solution: NMR identification of proton-containing intermediate phases, ACS Omega, 2019, 4, 1033–1044 CrossRef CAS PubMed.
- P. J. Anderson, R. F. Horlock and J. F. Oliver, Interaction of water with the magnesium oxide surface, Trans. Faraday Soc., 1965, 61, 2754–2762 RSC.
- S. Coluccia, L. Marchese, S. Lavagnino and M. Anpo, Hydroxyls on the surface of MgO powders, Spectrochim. Acta, Part A, 1987, 43, 1573–1576 CrossRef.
- E. Knözinger, K. H. Jacob, S. Singh and P. Hofman, Hydroxyl groups as IR active surface probes on MgO crystallites, Surf. Sci., 1993, 290, 388–402 CrossRef.
- C. Chizallet, G. Costentin, H. Lauron-Pernot, J. M. Krafft, P. Bazin, J. Saussey, F. Delbecq, P. Sautet and M. Che, Role of hydroxyl groups in the basic reactivity of MgO: a theoretical and experimental study, Oil Gas Sci. Technol., 2006, 61, 479–488 CrossRef CAS.
- C. Chizallet, G. Costentin, M. Che, F. Delbecq and P. Sautet, Revisiting acido-basicity of the MgO surface by periodic density functional theory calculations: Role of surface topology and ion coordination on water dissociation, J. Phys. Chem. B, 2006, 110, 15878–15886 CrossRef CAS.
- C. Chizallet, G. Costentin, M. Che, F. Delbecq and P. Sautet, Infrared characterization of hydroxyl groups on MgO: A periodic and cluster density functional theory study, J. Am. Chem. Soc., 2007, 129, 6442–6452 CrossRef CAS.
- A. Kondo, R. Kurosawa, J. Ryu, M. Matsuoka and M. Takeuchi, Investigation on the mechanism of Mg(OH)2 dehydration and MgO hydration by near-infrared spectroscopy, J. Phys. Chem. C, 2021, 2021(125), 10937–10947 CrossRef.
- N. Sutradhar, A. Sinhamahapatra, B. Roy, H. C. Bajaj, I. Mukhopadhyay and A. B. Panda, Preparation of MgO nano-rods with strong catalytic activity via hydrated basic magnesium carbonates, Mater. Res. Bull., 2011, 46, 2163–2167 CrossRef CAS.
- Y. Hase, Raman spectroscopic study of four isotopically substituted lithium hydroxide monohydrates, Monatsh. Chem., 1981, 112, 73–82 CrossRef CAS.
- M. Takeuchi, G. Martra, S. Coluccia and M. Anpo, Investigation of the structure of H2O clusters adsorbed on TiO2 surface by near-infrared absorption spectroscopy, J. Phys. Chem. B, 2005, 109, 7387–7391 CrossRef CAS.
- M. Takeuchi, L. Bertinetti, G. Martra, S. Coluccia and M. Anpo, States of H2O adsorbed on oxides: An investigation by near and mid infrared spectroscopy, Appl. Catal., A, 2006, 307, 13–20 CrossRef CAS.
- M. Takeuchi, G. Martra, S. Coluccia and M. Anpo, Evaluation of the adsorption states of H2O on oxide surface by vibrational absorption: near-and mid-infrared spectroscopy, J. Near Infrared Spectrosc., 2009, 17, 373–384 CrossRef CAS.
- C. E. Housecroft and A. G. Sharpe, The group 2 metals, Inorganic Chemistry, Tokyo Kagaku Dozin Co., Ltd, 3rd edn (in Japanese), 2012, ch. 12, pp. 311–312 Search PubMed.
- S. D. Rocha, M. B. Mansur and V. S. T. Ciminelli, Kinetics and mechanistic analysis of caustic magnesia hydration, J. Chem. Technol. Biotechnol., 2004, 79, 816–821 CrossRef CAS.
- H. Kuleci, C. Schmidt, E. Rybacki, E. Petrishcheva and R. Abart, Hydration of periclase at 350 °C to 620 °C and 200 MPa: experimental calibration of reaction rate, Mineral. Petrol., 2016, 110, 1–10 CrossRef CAS.
- G. Cassone, J. Sponer, S. Trusso and F. Saija, Ab initio spectroscopy of water under electric fields, Phys. Chem. Chem. Phys., 2019, 21, 21205–21212 RSC.
- G. A. Mutch, S. Shulda, A. J. McCue, M. J. Menart, C. V. Ciobanu, C. Ngo, J. A. Anderson, R. M. Richards and D. Vega-Maza, Carbon capture by metal oxides: Unleashing the potential of the (111) facet, J. Am. Chem. Soc., 2018, 140, 4736–4742 CrossRef CAS.
- L. F. Amaral, I. R. Oliveira, R. Salomão, E. Frollini and V. C. Pandolfelli, Temperature and common-ion effect on magnesium oxide (MgO) hydration, Ceram. Int., 2010, 36, 1047–1054 CrossRef CAS.
- I. F. Mironyuk, V. M. Gun'ko, M. O. Povazhnyak, V. I. Zarko, V. M. Chelyadin, R. Leboda, J. Skubiszewska-Zięba and W. Janusz, Magnesia formed on calcination of Mg(OH)2 prepared from natural bischofite, Appl. Surf. Sci., 2006, 252, 4071–4082 CrossRef CAS.
- E. N. Gribov, S. Bertarione, D. Scarano, C. Lamberti, G. Spoto and A. Zecchina, Vibrational and thermodynamic properties of H2 adsorbed on MgO in the 300–20 K interval, J. Phys. Chem. B, 2004, 108, 16174–16186 CrossRef CAS.
- T. Yoshida, T. Tanaka, H. Yoshida, T. Funabiki and S. Yoshida, Study of dehydration of magnesium hydroxide, J. Phys. Chem., 1995, 99, 10890–10896 CrossRef CAS.
- D. Müller, C. Knoll, G. Gravogl, W. Artner, J. M. Welch, E. Eitenberger, G. Friedbacher, M. Schreiner, M. Harasek, K. Hradil, A. Werner, R. Miletich and P. Weinberger, Turning the performance of MgO for thermochemical energy storage by dehydration – From fundamentals to phase impurities, Appl. Energy, 2019, 253, 113562 CrossRef.
Footnote |
| † Electronic supplementary information (ESI) available. See DOI: 10.1039/d1ra04290d |
| This journal is © The Royal Society of Chemistry 2021 |

