 Open Access Article
PCN-222@g-C3N4 cathodic materials for “signal-off” photoelectrochemical sensing of kanamycin sulfate†
Wenxia Donga,
Zhongping Li *a,
Wen Wena,
Sisi Feng
 c,
Yuanjian Zhang
 d and
Guangming Wen
 *ab
*ab
aSchool of Chemistry and Chemical Engineering, Institute of Environmental Science, Shanxi University, Taiyuan 030006, China. E-mail: zl104@sxu.edu.cn
bSchool of Chemistry and Chemical Engineering, Jinzhong University, Jinzhong, 030619, China
cInstitute of Molecular Science, Key Laboratory of Chemical Biology and Molecular Engineering of the Education Ministry, Shanxi University, Taiyuan, Shanxi 030006, China
dSchool of Chemistry and Chemical Engineering, Southeast University, Nanjing 211189, China
First published on 20th August 2021
Abstract
A novel cathodic photoelectrochemical (PEC) sensor was developed for the ultrasensitive detection of kanamycin sulfate (KAM) based on the g-C3N4 coupled zirconium-based porphyrinic metal–organic framework (PCN-222). Photocathodes made by double n-type semiconductors, which was attributed to the transfer of electrons and holes from g-C3N4 broad band to PCN-222 with narrow band gap. The photocurrent decreased when KAM was added, which was conducive to the construction of the PEC sensor. Then, the PCN-222@g-C3N4 was used as a photosensitive platform to construct a label-free strategy and ultrasensitive detection of KAM with wide linear range from 1 to 1000 nM and a low detection limit of 0.127 nM. Moreover, this sensing platform shows good selectivity, favourable reproducibility and brilliant stability. The reported sensors provided great potential for the detection of KAM in actual samples.
1 Introduction
Kanamycin sulfate (KAM) is a common aminoglycoside antibiotic fabricated by the fermentation of streptomyces kanamyceticus.1 Due to its strong antibacterial activity and low cost, KAM has been widely used to prevent infections, treat diseases and promote growth.2,3 The antimicrobial property of KAM is mainly reflected in its ability to induce mistranslation and indirectly inhibit translocation during protein synthesis, resulting in the production of abnormal proteins harmful to bacteria.4 However, the abuse of antibiotics has caused environmental pollution, leading to the global aggravation in antibiotic resistance. In addition, antibiotics can accumulate through the food chain and eventually transfer to humans, inevitably leading to disease problems such as ototoxicity and nephrotoxicity.5–8 Therefore, from the perspective of human security and environment safety, it is urgent to establish a sufficiently selective and sensitive method for the detection of KAM residue. Currently, several analytical methods have been developed for the determination of KAM from such as high-performance liquid chromatography method,9 mass spectrometry method,10 colorimetric analysis,11 fluorescence method12 and electrochemical aptasensors.13–21 Among them, electrochemical aptamer sensors have attracted more and more attention due to some unique advantages such as high specificity and sensitivity.Willner et al. reported the photoelectric (PEC) chemistry sensor for the first time in 2001, PEC sensing has been extensively studied in different fields.22–26 Due to the elegant merits of low background, high sensitivity and easy minimization, this technique has unique advantages in the detection of biomolecules and environmental pollutants.27 The sensing principle mainly depends on the electron transfer among target, semiconductor, and electrode with photoirradiation.28 The photoelectric material will generate an electric current under illumination, and the final detection signal as the form of electrochemical expression.29 Generally, PEC sensing platform consists of two parts, including an appropriate PEC sensor and an electron/hole donor.30 When the photoactive material is excited by light, the electron–hole pair will be generated, and the charge recombination will reduce the photoelectric conversion efficiency. However, in the presence of the electron donor, the pores are cleared, resulting in a significant enhancement of the photocurrent signal. Dopamine (DA), an amine neurotransmitter, has been used as an electron donor for photoelectric materials because it is oxidized to generate electrons when it is adsorbed on the receptor.31 In this study, DA was selected as the electron donor and directly added in the system in advance.
In general, the characteristics of photoactive materials determine the performance of PEC biosensors to a large extent. Among them, semiconductor nanomaterials have been regarded as the most promising photoactive materials because of their special valence band (VB) and conduction band (CB) electronic states as well as suitable band gaps.32 Graphitic carbon nitride (g-C3N4), a metal-free semiconducting polymer possessing the strong covalent bonding within adjacent C–N layers, is a two-dimensional layered material similar to graphene.33 In addition, the formation of the p-conjugated graphitic planes due to sp2 hybridization is the key to making g-C3N4 possessing the smallest direct band gap width of 2.7 eV, which results in excellent chemical and thermal stability of g-C3N4 under 460 nm light irradiation.34–36 PCN-222, with zirconium (Zr) as the metal center and porphyrin as the organic ligand, is an important branch of metal–organic frameworks (MOFs) material.37–40 In comparison with porphyrin ligand, the HOMO–LUMO energy gap of PCN-222 is smaller, which is beneficial for a photoinduced electron transfer (PET) process.41 Therefore, PCN-222 provides a platform to prepare new heterogeneous catalysis with highly accessible external and internal surface and evenly distributed active sites. However, we found that when g-C3N4 or PCN-222 was applied to the photoelectrochemical sensing platform alone, the photoelectronic performance would be relatively poor even in the presence of DA. But the synergy between g-C3N4 with PCN-222 resulted in the generation of obvious photocurrent signal.
In this work, a novel strategy was explored that integrating g-C3N4 to PCN-222 by simple method of physical microwave mixing. And then, we designed a label-free photocurrent strategy for the efficient and ultrasensitive detection of KAM. In addition, the method can be used to specifically identify the content of KAM in milk and KAM injection.
2 Experimental
2.1 Reagents
Zirconium(IV) chloride, meso-tetra (4-carboxyphenyl) porphyrin (TCPP) benzoic acid, N,N-dimethylformamide (DMF), ascorbic acid (AA), dopamine (DA), N-2-hydroxyethylpiperazine-N′-2-ethanesulfonic acid (HEPES), potassium chloride (KCl), urea (AR, 99%), sodium sulfate solution (Na2SO4, 0.1 M) were supplied by Aladdin (Shanghai, China). Amoxicillin (AMX), kanamycin sulfate (KAM), enrofloxacin (NFX), erythromycin (ERY), chloramphenicol (CRY) and tetracycline (TE) were all antibiotics from Aladdin (Shanghai, China). All reagents were of analytical reagent grade and used as received. Deionized water was from Millipore water purification system (≥18 MΩ cm−1, Milli-Q, Millipore).2.2 Apparatus
All the PEC measurements were carried on a RST5200F electrochemical workstation (Zhengzhou Shi Ruisi Instrument Technology Co., Ltd.). Xenon lamp (λ > 420 nm) was used as the irradiation source. The fluorine-doped SnO2 conductive glass (FTO) (15 × 50 mm, resistance = 10 Ω) was purchased from Wuhan Crystal Solar Energy Technology Co. Ltd. The UV spectrum was measured on the TU-1950 spectrophotometer (Beijing, China). Electron spectrometer (Shimadzu, Japan) was used to obtain X-ray photoelectron spectroscopy (XPS) data. The Transmission electron microscopy (TEM) image was obtained from JSM-7900F (Japan). A Rigaku Dmax 2000 X-ray diffractometer containing graphite monochromatic CuKα radiation (λ = 0.154 nm) was used to obtain the X-ray diffraction pattern (XRD). Fourier transform infrared spectroscopy (FTIR) was recorded on a Bruker IR spectrometer.2.3 Preparation of PCN-222@g-C3N4
The preparation method of g-C3N4 adopted the reported method.42 The urea was heated in a muffle furnace at a rate of 5 °C min−1 to 500 °C for 3 h. The yellow product obtained (g-C3N4) was collected for future use. ZrCl4 (75 mg), TCPP (30 mg) and benzoic acid (1750 mg) were dissolved in 10 mL DMF, and the above solution was ultrasound dissolved in a glass vial. The above mixture was heated to 120 °C, for 48 h. The synthesized PCN-222 was cooled to room temperature, purple needle crystals were collected under centrifugal conditions. 0.005 g g-C3N4 dissolved in 5 mL methanol, ultrasound dissolve for 20 h. 0.005 g PCN-222 dissolved in 5 mL methanol, ultrasound dissolve for 2 h. Mixing g-C3N4 solution and PCN-222 solution at a mass ratio of 1![[thin space (1/6-em)]](https://www.rsc.org/images/entities/char_2009.gif) :
:![[thin space (1/6-em)]](https://www.rsc.org/images/entities/char_2009.gif) 0.75, ultrasound dissolve for 2 h to prepare composite solution, and reserve at 4 °C.
0.75, ultrasound dissolve for 2 h to prepare composite solution, and reserve at 4 °C.
2.4 Preparation of modified electrode
The FTO electrode was respectively cleaned in acetone, ethanol and secondary water for 30 min sequentially. The cleaned FTO electrode was stored in ethanol solution. PCN-222@g-C3N4 was modified onto the FTO electrode by drop casting. PCN-222@g-C3N4/FTO electrode, Pt electrode and Ag/AgCl constituted a three-electrode system, and the 0.01 M HEPES solution used as electrolyte. Turned on/off the Xe lamp light source for 60 s, and tested for 60 seconds with the light source turned on. Repeated the above experiment several times until the photocurrent was stable. The aqueous solution of KAM was added by dropping to the electrolyte, and allowed to standing for 5 min for detection.3 Results and discussion
3.1 Detection strategy
Under simulated sunlight, the PEC sensor for detection KAM was developed based on rod-shaped PCN-222 and flake-shaped g-C3N4 (Scheme 1). The composite of g-C3N4 and PCN-222 can effectively reduce carrier recombination and improve the photocatalytic performance. The addition of KAM can effectively inhibit the electron transfer behavior to reduce the photocurrent in the system.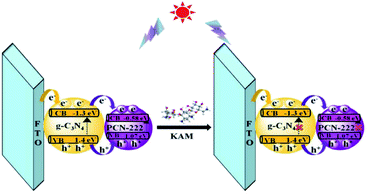 | ||
| Scheme 1 The mechanism of charge recombination suppression-based photoelectrochemical strategy for the detection of KAM. | ||
3.2 Phase and chemical structure
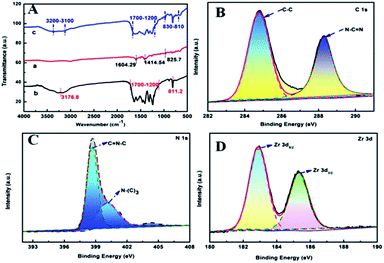 | ||
| Fig. 2 (A) FTIR spectra of (a) PCN-222, (b) g-C3N4, and (c) PCN-222@g-C3N4 materials. Binding energy regions of (B) C 1s, (C) N 1s, (D) Zr 3d. | ||
XPS technology can be used to analyze the surface elements of the sample. The main elements contained in the PCN-222@g-C3N4 composite are C 1s, N 1s, O 1s and Zr 3d (Fig. S1†). C 1s contains two main peaks, the peak at 284.6 eV corresponds to the C–C bond of the indeterminate carbon or sp2 hybridization on the surface of the substance, and the peak at 288.3 eV corresponds to the N–C![[double bond, length as m-dash]](https://www.rsc.org/images/entities/char_e001.gif) N bond (Fig. 2B). N 1s contains two main peaks, the peak at 398.7 eV belongs to the C
N bond (Fig. 2B). N 1s contains two main peaks, the peak at 398.7 eV belongs to the C![[double bond, length as m-dash]](https://www.rsc.org/images/entities/char_e001.gif) N–C bond, the peak at 400.2 eV corresponds to the N–(C)3 bond (Fig. 2C). The peaks of Zr 3d at 182.9 eV and 185.35 eV correspond to Zr 3d5/2 and Zr 3d3/2 (Fig. 2D).47
N–C bond, the peak at 400.2 eV corresponds to the N–(C)3 bond (Fig. 2C). The peaks of Zr 3d at 182.9 eV and 185.35 eV correspond to Zr 3d5/2 and Zr 3d3/2 (Fig. 2D).47
3.3 Morphological characterization
Transmission electron microscopy (TEM) and scanning electron microscopy (SEM) characterized the morphology of the materials. Pure g-C3N4 has tulle-like thickness, the TEM image shows that g-C3N4 has a large specific surface area and a smooth surface (Fig. 3A). The SEM morphology of pure g-C3N4 has many thin corrugated sheets that provide predominate anchor sites for loading of PCN-222 (Fig. 3D). Pure PCN-222 exists uniformly in a three-dimensional rod shape of 3–4 μm (Fig. 3B and E). After PCN-222 was combined with g-C3N4, PCN-222 was successfully reorganized on the surface of g-C3N4 (Fig. 3C and F), the recombined PCN-222@g-C3N4 prolonged the charge transfer rate, thereby enhancing the photoelectric activity.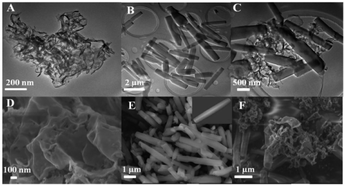 | ||
| Fig. 3 TEM of (A) g-C3N4 (B) PCN-222 (C) PCN-222@g-C3N4; SEM of (D) g-C3N4 (E) PCN-222 (inset: single PCN-222 nanorod) (F) PCN-222@g-C3N4. | ||
3.4 Material properties
The solid UV of PCN-222 and g-C3N4 is shown in Fig. S2.† Pure g-C3N4 has strong absorption at 200–460 nm, and the band gap of g-C3N4 is about 2.7 eV (Fig. 4A). PCN-222 has relatively strong absorption in the range of 200–800 nm, it shows that PCN-222 can perform electronic transition under visible light. From Fig. 4B, the band gap of pure PCN-222 is obtained in 1.65 eV. The Mott–Schottky measurement is used to determine the energy band position of a substance, the positive slop of Mott–Schottky curves proved that PCN-222 and g-C3N4 are both n-type semiconductors. The corresponding conduction band position of the specimen lies at ∼−1.3 eV and −0.58 eV (versus NHE) for pure g-C3N4 (Fig. 4C) and PCN-222 (Fig. 4D), respectively. Therefore, the valence and conduction bands of g-C3N4 are 1.4 eV and −1.3 eV. the valence and conduction bands of PCN-222 are 1.07 eV and −0.58 eV.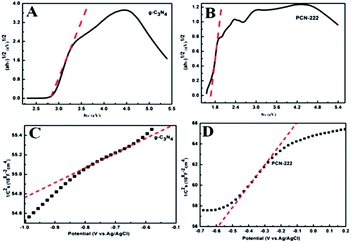 | ||
| Fig. 4 UV-vis diffuse absorbance spectra of (A) g-C3N4 (B) PCN-222. Mott–Schottky plots of (C) g-C3N4 (D) PCN-222. | ||
To study the performance of this sensor in the detection of KAM, the pH, modification amount, reducing agent and ratio were optimized. The result was shown in Fig. S3.† When the modification amount was 60 μL and pH = 6.4, the photocurrent showed the highest value. The photocurrent intensity successively was DA, H2O2, AA, L-Cys, indicating that DA was the most excellent substance as an electron donor. A rate of g-C3N4 to PCN-222 is 1![[thin space (1/6-em)]](https://www.rsc.org/images/entities/char_2009.gif) :
:![[thin space (1/6-em)]](https://www.rsc.org/images/entities/char_2009.gif) 0.75 had strongest photocurrent, it showed that the mass ratio of 1
0.75 had strongest photocurrent, it showed that the mass ratio of 1![[thin space (1/6-em)]](https://www.rsc.org/images/entities/char_2009.gif) :
:![[thin space (1/6-em)]](https://www.rsc.org/images/entities/char_2009.gif) 0.75 was the best condition. The possible reason is that PCN-222 can supply more holes to join in photoelectrochemical processes. However, a large number of PCN-222 prevents the transfer of photogenerated electrons on the surface.
0.75 was the best condition. The possible reason is that PCN-222 can supply more holes to join in photoelectrochemical processes. However, a large number of PCN-222 prevents the transfer of photogenerated electrons on the surface.
3.5 Sensor performance
Electrochemical impedance spectroscopy (EIS) technique is used to characterize the properties of various materials modified (Fig. 5A). The blank electrode FTO was 65 Ω (curve a). When g-C3N4 was applied to the FTO electrode, the resistance value of g-C3N4/FTO was 55 Ω (curve b). When PCN-222 was applied onto the FTO electrode, the resistance value decreased significantly to 45 Ω (curve c). PCN-222@g-C3N4 was present on the FTO electrode, the resistance value dropped to 35 Ω (curve d). This was consistent with our experimental results. As shown in Fig. 5B, the composite PCN-222@g-C3N4 had higher photocurrent than pure PCN-222 and pure g-C3N4, indicating that the composite had a better light response.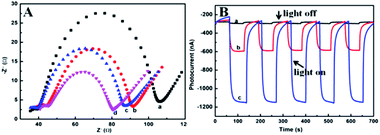 | ||
| Fig. 5 (A) EIS of (a) FTO, (b) g-C3N4/FTO, (c) PCN-222/FTO, (d) PCN-222@g-C3N4/FTO; (B) photocurrent response curve (a) g-C3N4/FTO, (b) PCN-222/FTO, (c) PCN-222@g-C3N4/FTO. | ||
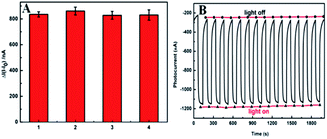
Obviously, the sensor was also examined four individual photoelectrodes. The sensors containing 100 nM KAM displayed reproducible photocurrent responses (Fig. 6A). After 15 times testing based on the off–on irradiation cycle, the photocurrent intensity remained 94.7% of the initial one which shows accredited stability (Fig. 6B). All these above results verified that the as-prepared PCN-222@g-C3N4 composite had good reproducibility and stability.
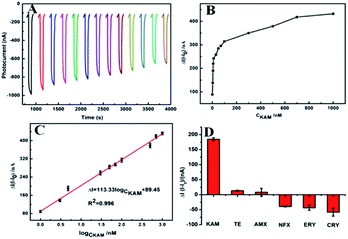
Comparing the response of PCN-222, g-C3N4 and PCN-222@g-C3N4 to antibiotics, it was found that PCN-222@g-C3N4 had a good response to KAM (Fig. S4†). Under the optimal conditions, the analytical performance of the designed PEC sensor was tested. As shown in Fig. 7A, we can observe that the photocurrent decreased with the increase of KAM concentration. The corresponding linear graph is shown in Fig. 7B, and the corresponding calibration curve is shown in Fig. 7C (ΔI = I − I0, I: photocurrent when KAM is added I0: photocurrent without KAM). The concentration of ΔI and KAM has a linear relationship between 1 to 1000 nM, the detection limit is 0.127 nM (3σ), the linear regression equation is ΔI (nA) = 113.33![[thin space (1/6-em)]](https://www.rsc.org/images/entities/char_2009.gif) log
log![[thin space (1/6-em)]](https://www.rsc.org/images/entities/char_2009.gif) CKAM + 89.45 (R2 = 0.996). Compared with the existing methods, the PEC sensor for KAM detection has a lower detection limit and a wider linear range (Table S1†). Fig. 7D displays the effect of other antibiotics (such as AMX, NFX, ERY, CRY, and TE) on KAM detection. It can be seen that these antibiotics had little effect on the detection of KAM at the same concentration.
CKAM + 89.45 (R2 = 0.996). Compared with the existing methods, the PEC sensor for KAM detection has a lower detection limit and a wider linear range (Table S1†). Fig. 7D displays the effect of other antibiotics (such as AMX, NFX, ERY, CRY, and TE) on KAM detection. It can be seen that these antibiotics had little effect on the detection of KAM at the same concentration.
3.6 Detection of KAM in kanamycin sulfate injection (for veterinary use) and milk
In order to evaluate the applicability of the sensor prepared in the actual sample, the PCN-222@g-C3N4/FTO sensor was used to determine the KAM concentration in the injection. Diluted a certain amount of milk into 0.01 M HEPES solution, and added the KAM of different concentrations (5, 50, and 100 nM) for the spike recovery test. As shown in Table 1, the recovery rate reached 92.60–99.01%, the relative standard deviation (RSD, n = 3) was 1.87–2.10%. The kanamycin sulfate injection was diluted 10 times and added dropwise to the 0.01 M HEPES solution. After repeated determination three times, a satisfactory recovery rate of 95.24–100.10% was obtained, and the relative standard deviation (RSD, n = 3) was 1.43–1.70%.| Sample | Added (nM) | Found (nM) | Recovery (%) | RSD (%) |
|---|---|---|---|---|
| Milk | 5 | 5.4 | 92.60 | 2.10 |
| 50 | 50.5 | 99.01 | 1.90 | |
| 100 | 102.6 | 97.47 | 1.87 | |
| Injection | 5 | 5.25 | 95.24 | 1.70 |
| 25 | 25.12 | 99.52 | 1.43 | |
| 250 | 249.74 | 100.10 | 1.46 |
4 Conclusions
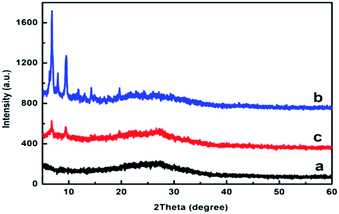
In summary, we have designed a new double n-type of PEC for efficient and ultrasensitive detection of KAM. The PCN-222@g-C3N4 nanocomposite was used as photoelectric material to obtain stronger photoelectric signal, which was mainly attributed to assisted and cooperative effect between g-C3N4 and PCN-222. The so-obtained PCN-222@g-C3N4 was characterized separately by UV, TEM, XRD, XPS, and FTIR. It was discovered that the nanocomposite distributed on the electrode surface uniformly. Particularly, that photoelectrochemical tests showed that g-C3N4 could present dramatically enhanced photocurrent response of PCN-222. The PCN-222@g-C3N4 showed that the initial photocurrent is 2.78 times and 49 times compared with pure PCN-222 and g-C3N4, respectively. The designed sensor showed low detection limit, good repeatability and selectivity for the detection of KAM. The designed nanocomposite sensing platform can pave the way for PEC-based applications and overcome many problems in the material development process. The simplicity, stability and repeatability of this method provide a broad prospect for photoelectric sensing and monitoring platforms.Conflicts of interest
There are no conflicts to declare.Acknowledgements
The project was supported by the National Natural Science Foundation of China (21575083), Jinzhong College “1331 Project” Innovation Team (jzxycxtd2019007) the 12th “Hundred Talents Plan” in Shanxi Province (128,129), the 2019 Graduate Education Innovation Program (2019SY018). And we are very grateful to Prof. Feng for providing us with MOFs.Notes and references
- E. Adams, J. Dalle, E. D. Bie, I. D. Smedt and J. Hoogmartens, J. Chromatogr. A, 1997, 766, 133 CrossRef CAS PubMed.
- Q. Luo, K. Qin, F. Liu, X. Zheng, Y. Ding, C. Zhang, M. Xu, X. Liu and Y. Wei, Analyst, 2021, 146, 1965–1972 RSC.
- H. Wang, W. Wu, D. Wei, Z. Guo and S. Wang, J. Electroanal. Chem., 2014, 735, 136–141 CrossRef CAS.
- H. Shuang, B. Li, Z. Song, S. Pan, Z. Zhang, Y. Hui, S. Zhu and G. Xu, Analyst, 2017, 142, 218 RSC.
- B. J. Stoll, J. Pediatr., 2012, 160, 344 CrossRef.
- L. Ma, N. Sun, C. Tu, Q. Zhang and A. Diao, RSC Adv., 2017, 7, 38512–38518 RSC.
- Y. Yao, C. M. Jiang and J. F. Ping, Biosens. Bioelectron., 2019, 123, 178–184 CrossRef CAS PubMed.
- J. Yu, W. X. Tang, F. Wang, F. Zhang, Q. J. Wang and P. G. He, Sens. Actuators, B, 2020, 311, 127857 CrossRef CAS.
- B. Blanchaert, E. Poderós Jorge, P. Jankovics, E. Adams and A. Van Schepdael, Chromatographia, 2013, 76, 1505–1512 CrossRef CAS.
- I. Nina and S. Stefan, J. AOAC Int., 1999, 1017 Search PubMed.
- C. K. Wang, D. Chen, Q. Q. Wang and R. Tan, Biosens. Bioelectron., 2017, 91, 262–267 CrossRef CAS PubMed.
- H. Li, D. E. Sun, Y. J. Liu and Z. H. Liu, Biosens. Bioelectron., 2014, 55, 149–156 CrossRef CAS PubMed.
- M. A. Rostagno, M. D'Arrigo and J. A. Mart'nez, TrAC, Trends Anal. Chem., 2010, 29, 553–561 CrossRef CAS.
- F. Bottari, R. Blust and K. D. Wael, Curr. Opin. Electrochem., 2018, 10, 136–142 CrossRef CAS.
- W. J. Guo, N. Sun, X. L. Qin, M. S. Pei and L. Y. Wang, Biosens. Bioelectron., 2015, 74, 691–697 CrossRef CAS PubMed.
- Y. L. Zhou, F. Li, H. W. Wu, Y. Chen, H. S. Yin, S. Y. Ai and J. Wang, Sens. Actuators, B, 2019, 296, 126664 CrossRef CAS.
- J. Yu, W. X. Tang, F. Wang, F. Zhang, Q. J. Wang and P. G. He, Sens. Actuators, B, 2020, 311, 127857 CrossRef CAS.
- Y. Yao, T. Y. Chen, W. Mao, Y. Zhong, S. S. Dai, X. M. Zeng, C. Liu, S. Tang, F. Qiao, E. Shi, W. Shen and H. K. Lee, Sens. Actuators, B, 2021, 343, 130082 CrossRef CAS.
- X. L. Qin, Y. Yin, H. J. Yu, W. J. Guo and M. S. Pei, Biosens. Bioelectron., 2016, 77, 752–758 CrossRef CAS PubMed.
- A. Sharma, G. Istamboulie, A. Hayat, G. Catanante, S. Bhand and J. L. Marty, Sens. Actuators, B, 2017, 245, 507–515 CrossRef CAS.
- F. Hong, X. X. Chen, Y. T. Cao, Y. R. Dong, D. Z. Wu, F. T. Hu and N. Gan, Biosens. Bioelectron., 2018, 112, 202–208 CrossRef CAS PubMed.
- I. Willner, F. Patolsky and J. Wasserman, Angew. Chem., Int. Ed., 2001, 40(10), 1861–1864 CrossRef CAS PubMed.
- V. Pardo-Yissar, E. Katz, J. Wasserman and I. Willner, J. Am. Chem. Soc., 2003, 125, 622–623 CrossRef CAS PubMed.
- F. A. L. Laskowski, M. R. Nellist, J. Qiu and S. W. Boettcher, J. Am. Chem. Soc., 2019, 141, 1394–1405 CrossRef CAS PubMed.
- L. n. Zhao, Z. Li, H. You and W. r. Li, Int. J. Hydrogen Energy, 2021, 46, 18305–18317 CrossRef CAS.
- N. Haddour, J. Chauvin, C. Gondran and S. Cosnier, J. Am. Chem. Soc., 2006, 128, 9693–9698 CrossRef CAS PubMed.
- S. Wu, H. Song, J. Song, C. He, J. Ni, Y. Zhao and X. Wang, Anal. Chem., 2014, 86, 5922–5928 CrossRef CAS PubMed.
- H. Li, J. Li, Q. Xu and X. Hu, Anal. Chem., 2011, 83, 9681–9686 CrossRef CAS PubMed.
- L. Fan, C. Zhang, H. Shi and G. Zhao, Biosens. Bioelectron., 2019, 124–125, 8–14 CrossRef CAS PubMed.
- W. W. Zhao, Z. Y. Ma, D. Y. Yan, J. J. Xu and H. Y. Chen, Anal. Chem., 2012, 84, 10518–10521 CrossRef CAS PubMed.
- T. M. Prado, A. Carrico, F. H. Cincotto, O. Fatibello-Filho and F. C. Moraes, Sens. Actuators, B, 2019, 285, 248–253 CrossRef CAS.
- P. P. Li, Y. Cao, C. J. Mao, B. K. Jin and J. J. Zhu, Anal. Chem., 2019, 91, 1563–1570 CrossRef CAS PubMed.
- M. Zhang, Y. Liu, D. Zhang, T. Chen and Z. Li, Anal. Chem., 2017, 89, 8064–8069 CrossRef CAS PubMed.
- X. Li, L. Zhu, Y. Zhou, H. Yin and S. Ai, Anal. Chem., 2017, 89, 2369–2376 CrossRef CAS PubMed.
- X. Zhang, X. Xie, H. Wang, J. Zhang, B. Pan and Y. Xie, J. Am. Chem. Soc., 2013, 135, 18–21 CrossRef CAS PubMed.
- G. Gao, Y. Jiao, E. R. Waclawik and A. Du, J. Am. Chem. Soc., 2016, 138, 6292–6297 CrossRef CAS PubMed.
- P. Deria, D. A. Gomez-Gualdron, I. Hod, R. Q. Snurr, J. T. Hupp and O. K. Farha, J. Am. Chem. Soc., 2016, 138, 14449–14457 CrossRef CAS PubMed.
- R. Hariri and S. Dehghanpour, J. Phys. Chem. Solids, 2021, 155, 110126 CrossRef CAS.
- S. Nazri, M. Khajeh, A. R. Oveisi, R. Luque, E. Rodríguez-Castellón and M. Ghaffari-Moghaddam, Sep. Purif. Technol., 2021, 259, 118197 CrossRef CAS.
- J. He, X. Wu, Z. Long and X. Hou, Microchem. J., 2019, 145, 68–73 CrossRef CAS.
- H. J. Jia, D. X. Ma, S. W. Zhong, L. J. Li, L. Li, L. Xu and B. Y. Li, Chem. Eng. J., 2019, 368, 165–174 CrossRef CAS.
- Z. P. Li, W. X. Dong, X. Y. Du, G. M. Wen and X. J. Fan, Microchem. J., 2020, 152, 104259 CrossRef CAS.
- P. Yang, J. C. Wang, G. Z. Yue, R. Z. Yang, P. X. Zhao, L. J. Yang, X. C. Zhao and D. Astrucc, J. Photochem. Photobiol., A, 2020, 388, 112169 CrossRef.
- D. W. Feng, Z. Y. Gu, J. R. Li, H. L. Jiang, Z. W. Wei and H. C. Zhou, Angew. Chem., Int. Ed., 2012, 51, 10307–10310 CrossRef CAS PubMed.
- W. L. Tan, T. Wei, J. Huo, M. Loubidi, T. T. Liu, Y. Liang and L. B. Deng, ACS Appl. Mater. Interfaces, 2019, 11, 36782–36788 CrossRef CAS PubMed.
- L. T. Ma, H. Q. Fan, K. Fu, S. H. Lei, Q. Z. Hu, H. T. Huang and G. P. He, ACS Sustainable Chem. Eng., 2017, 5, 7093–7103 CrossRef CAS.
- S. Biswas, Y. L. Chen, Y. Xie, X. Sun and Y. Wang, Anal. Chem., 2020, 92, 4566–4572 CrossRef CAS PubMed.
Footnote |
| † Electronic supplementary information (ESI) available. See DOI: 10.1039/d1ra04275k |
| This journal is © The Royal Society of Chemistry 2021 |

