 Open Access Article
A comparative study on the coordination of diglycolamide isomers with Nd(III): extraction, third phase formation, structure, and computational studies†
Yaoyang Liua,
Sheng Liua,
Zhibin Liua,
Chuang Zhaoa,
Chunhui Lia,
Yu Zhoua,
Caishan Jiaoa,
Yang Gao *a,
Hui He*ab and
Shaowen Zhang
 c
c
aFundamental Science on Nuclear Safety and Simulation Technology Laboratory, College of Nuclear Science and Technology, Harbin Engineering University, Harbin, Heilongjiang Province, China 150001. E-mail: gaoyang@hrbeu.edu.cn
bChina Institute of Atomic Energy, P. O. Box 275 (126), Beijing, 102413, China. E-mail: hehui@ciae.ac.cn
cSchool of Chemistry and Chemical Engineering, Key Laboratory of Cluster Science of Ministry of Education, Beijing Institute of Technology, Beijing, 100081, China
First published on 19th August 2021
Abstract
A novel asymmetric diglycolamide N,N-dimethyl-N′,N′-dioctyl diglycolamide (LII) was synthesized. The Nd(III) extraction behavior from HNO3 and loading capability of the solution of LII in 40/60 (v/v)% n-octanol/kerosene were studied. Analyses by the slope method, ESI-MS, and FT-IR indicated that, similar to the previously studied isomer ligand N,N′-dimethyl-N,N′-dioctyl diglycolamide (LI), 1![[thin space (1/6-em)]](https://www.rsc.org/images/entities/char_2009.gif) :
:![[thin space (1/6-em)]](https://www.rsc.org/images/entities/char_2009.gif) 3 Nd(III)/LII complexes formed. Under the same experimental conditions, the distribution ratio and limiting organic concentration of LII towards Nd(III) were smaller than those of LI, but the critical aqueous concentration of LII was larger, which implies that LII exhibited poorer extraction and loading capabilities towards Nd(III) than LI, and LII has a tendency to be less likely to form the third phase. The quasi-relativistic density functional theory (DFT) calculation was performed to provide some explanations for the differences in their extraction behaviors. The electrostatic potential of the ligands indicated that the electron-donating ability of the amide O atoms in LII displayed certain differences compared with LI. This inhomogeneity in LII affected the interaction between LII and Nd(III), as supported by QTAIM and bonding nature analysis, and it seemed to reflect in the extraction performance towards Nd(III).
3 Nd(III)/LII complexes formed. Under the same experimental conditions, the distribution ratio and limiting organic concentration of LII towards Nd(III) were smaller than those of LI, but the critical aqueous concentration of LII was larger, which implies that LII exhibited poorer extraction and loading capabilities towards Nd(III) than LI, and LII has a tendency to be less likely to form the third phase. The quasi-relativistic density functional theory (DFT) calculation was performed to provide some explanations for the differences in their extraction behaviors. The electrostatic potential of the ligands indicated that the electron-donating ability of the amide O atoms in LII displayed certain differences compared with LI. This inhomogeneity in LII affected the interaction between LII and Nd(III), as supported by QTAIM and bonding nature analysis, and it seemed to reflect in the extraction performance towards Nd(III).
Introduction
In order to meet the growing demand for energy and combat climate change, many countries have put forward the strategy of developing nuclear power. However, the treatment and disposal of radioactive waste, especially high-level liquid waste (HLLW) generated from spent fuel reprocessing, has always been a challenging and controversial issue associated with the sustainable use of nuclear fuels. Minor actinides (MAs) and long-lived fission product (FP) radionuclides are separated from HLLW and then incinerated into short-lived nuclides in nuclear reactors or accelerators, and this process is called partitioning & transmutation (P&T).1 Thus, the radiotoxicity and volume of HLLW can be decreased significantly. In the past few decades, diglycolamides (DGAs, Fig. 1) have been identified as one of the most up-and-coming extractants in the field of HLLW separation due to their strong affinity towards actinides (An) and lanthanides (Ln), which results in tridentate chelates with CHON compositions that are benign to the environment.2DGAs can be divided into two categories, namely symmetric DGAs (R1 = R2 = R3 = R4) and asymmetric DGAs (structure A: R1 = R3, R2 = R4 or structure B: R1 = R2, R3 = R4) on the basis of the alkyl substituent attached to the N atom of amide. N,N,N′,N′-Tetraoctyl diglycolamide (TODGA)3–5 and N,N,N′,N′-tetra(2-ethylhexyl) diglycolamide (TEHDGA) are the most extensively studied DGAs and have been applied in several HLLW separation processes.6,7 However, they suffer the problem of third phase formation in the extraction process. Although adding phase modifiers, such as tributyl phosphate (TBP), N,N-dihexyl octyl amide (DHOA), and n-octanol, can increase the metal loading capacity of the extractant, this adjustment complicates the solvents and causes more fission products like Zr(IV) and Mo(VI) to proceed to the organic phase.8 It was found that some asymmetric DGAs, such as N,N-di(2-ethylhexyl)-N′,N′-dioctyl diglycolamide and N,N-didecyl-N′,N′-dioctyl diglycolamide,9,10 improved the performance to a certain extent by inhibiting third phase formation, as well as extraction performance, and selectivity for An(III) and Ln(III). For example, N,N-didodecyl-N′,N′-dioctyl diglycolamide displayed the advantages of a high distribution ratio of Nd(III) and no third phase formation with Nd(III) even at the initial concentration of 600 mM in 3 to 4 M nitric acid medium.11 N,N-Dihexyl-N′,N′-didecyl diglycolamide could separate Ln(III) from Fe(III), Ni(II), Co(II) and Cs(I) effectively.12 N,N′-Dimethyl-N,N′-dioctyl diglycolamide exhibited the high LOC (the limiting organic concentration) and CAC (the critical aqueous concentration) of Nd(III) in nitric acid and considerably good extraction ability towards actinide and lanthanide ions with various oxidation states, such as Nd(III), Pu(IV), Np(V), and U(VI).13–17 These asymmetric DGAs are supposedly superior ligands for the separation of An(III)/Ln(III) from HLLW.
Although asymmetric DGAs have obtained extensive attention, most studies have focused on one type of asymmetric DGAs, either the A or B structure, while a few studies involve the comparison of the two types of asymmetric DGAs in terms of the loading capacity of acid and metal ions, and extraction behaviors, as well as separation performances. The two types of asymmetric DGAs differ in many characteristics, such as electron donor ability, space steric hindrance and coordination ability, which probably affect the interaction strength between metal ions and the ligands. Both theoretical and experimental studies on DGA-type or DAPhen-type soft ligands have shown that the subtle steric and electronic charge variations markedly affect the structure–activity relationship of the ligands,18–20 which is ultimately reflected in the metal-ion extraction performance. In this study, neodymium, a typical member of the lanthanide series, was selected as the target element because, on the one hand, high-level radioactive waste contains a large proportion of lanthanides (∼45%), and on the other hand, it has often been used as the research object in the formation of the third phase.22 Two types of DGAs (Fig. 2), N,N′-dimethyl-N,N′-dioctyl diglycolamide (LI) and N,N-dimethyl-N′,N′-dioctyl diglycolamide (LII), were used as the extractants, and the differences in their extraction performance, extraction thermodynamics, and loading capabilities towards Nd(III) were investigated through extraction experiments, in conjunction with the scalar-relativistic theoretical method.
Experimental methods
Materials
Diglycolic anhydride (98%), dioctylamine (95%), dimethylamine in tetrahydrofuran (THF) (2 M), isobutyl chloroformate (IBCF, 98%), 4-methylmorpholine (NMM, 98%), neodymium nitrate hexahydrate (99.9%) were supplied by Aladdin Industrial Corporation. The other chemicals (analytical grade) were supplied by Sinopharm Reagent Co., Ltd.Synthesis
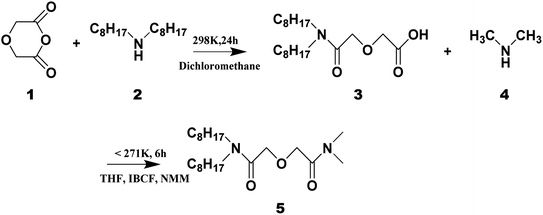
The ligand LI was synthesized by two-step method.21 The ligand LII was synthesized by a mixed anhydride method.23 The synthetic route of LII is depicted in Fig. 3. A brief description of the synthesis steps is given below:Dioctyldiglycolamic acid (3, DODGAA) was first synthesized by the reaction between diglycolic anhydride (1) and dialkylamine (2).9 A mixture of 0.03 mol DODGAA dissolved in 150 mL THF and 0.03 mol N-methylmorpholine was stirred in an ice brine bath. When the temperature dropped to −10 °C, a mixture of 3.8 mL (0.03 mol) isobutyl chloroformate and THF (volume ratio 1![[thin space (1/6-em)]](https://www.rsc.org/images/entities/char_2009.gif) :
:![[thin space (1/6-em)]](https://www.rsc.org/images/entities/char_2009.gif) 1) was slowly added. Then, 15 mL dimethylamine in THF (4, 2 M) was added dropwise at −2 °C. Excess THF was evaporated under reduced pressure. After washing, filtering, rotary evaporation and separation on a silica gel column, the target product LII ligand (5) was obtained with a yield of 80%. Characterization data from 1H NMR, 13C NMR and FT-IR spectroscopy are presented in the ESI.†
1) was slowly added. Then, 15 mL dimethylamine in THF (4, 2 M) was added dropwise at −2 °C. Excess THF was evaporated under reduced pressure. After washing, filtering, rotary evaporation and separation on a silica gel column, the target product LII ligand (5) was obtained with a yield of 80%. Characterization data from 1H NMR, 13C NMR and FT-IR spectroscopy are presented in the ESI.†
Solvent extraction and third phase formation
The aqueous solution containing Nd(III) and the organic phase were mixed in equal volumes for 30 min at 25 ± 0.2 °C (s100 oscillator, Dianshan Lake Instrument Company, Kunshan, Jiangsu, China). The equilibrium time experiments demonstrated that 30 min was enough for the two phases to reach equilibrium. The two phases were then separated by centrifugation (LG16B high-speed centrifuge, Leiboer Medical Devices Co., Ltd., Beijing, China) at 2500 rpm for 10 min. The Nd(III) concentration in the raffinate was assayed by inductively coupled plasma mass spectroscopy (X-II ICP-MS, Thermo Fisher Scientific, Waltham, MA, USA). The Nd(III) concentration in the organic phase was determined by subtracting the Nd(III) concentration in the raffinate from the initial aqueous Nd(III) concentration.The distribution ratio, DNd, was derived from:
 | (1) |
Two parameters, LOC and CAC, are usually used for evaluating the third phase formation behavior.24,25 The organic phase and the aqueous phase containing nitric acid or Nd(III) were mixed thoroughly in equal volume. The third phases formed by nitric acid and Nd(III) were yellowish-brown and light pink, respectively. Then, the third phase was dissolved cautiously by adding distilled water or the pre-equilibrated organic phase dropwise until it disappeared. The complexometric method and standard acid–base titration were used to determine the concentrations of Nd(III) and nitric acid in the organic and aqueous phases, respectively.10,26,27 All data were obtained from three sets of parallel tests, and the error was below 5%.
ESI-MS methods
Mass spectrometric measurements were recorded in the positive-ion mode using a Bruker micrOTOF Q II (Bruker Daltonics, Bremen, Germany), and an electrospray interface was used as the ionization source. The solutions for ESI-MS measurements were prepared by adding a certain volume of the metal stock solution (2 × 10⁻² M) to 5 mL of the ligand solution (5 × 10⁻⁴ M), and the ESI-MS spectra were obtained in the presence of excess extractant.Infrared spectroscopy
The IR spectra of the extracted species were recorded on a Fourier Transform Infrared Spectrometer (Spectrum 100 FT-IR, Perkin Elmer, Waltham, MA, USA), and the detailed procedure has been described in a previous study.26Theoretical calculations
The Gaussian 16 program package was used for structural optimization by DFT.28–30 The three-parameter hybrid functional common formulation, B3LYP,31,32 which has been demonstrated to produce reliable structural results for actinide and lanthanide complexes, was employed.33,34 The 28 electron core pseudopotentials (ECPs) and the corresponding ECP28MWB-SEG valence basis sets were applied for Nd,35–37 and the polarized 6-311G(d) basis set was used for the lighter atoms (H, C, N, and O).All the geometrical parameters were optimized at the B3LYP/6-311G(d)/RECP level of theory in the gas phase. M052X/6-31G(d)/RECP38 was chosen for the thermodynamics analysis based on the optimized molecular geometries to gain more accurate energies. Solvation effects were evaluated by the Solvation Model Based on Density (SMD) with the custom SMD mixing solvent parameters.39
The electrostatic potentials (ESP) and Mulliken charge population analysis of the two ligands were investigated. In order to understand the metal–ligand bonding properties, the Mayer bond order (MBO) was calculated at the same theory level,40 and the quantum theory of atoms in molecules (QTAIM) parameters were explored at the bond critical points (BCPs) using the Multiwfn software version 3.7.41–44
Results and discussion
Solvent extraction
| Nd(aq)3+ + 3NO3(aq)− + nLII(o) ↔ Nd(NO3)3·nLII(o) | (2) |
The extraction equilibrium constant K can be expressed as:
 | (3) |
The term DNd can be calculated as:
| DNd = γNd(NO3)34K[NO3−]aq3[LII]orgn | (4) |
Adjusting eqn (3) in the logarithmic form gives:
lg![[thin space (1/6-em)]](https://www.rsc.org/images/entities/char_2009.gif) DNd = n DNd = n![[thin space (1/6-em)]](https://www.rsc.org/images/entities/char_2009.gif) lg[LII]org + lg lg[LII]org + lg![[thin space (1/6-em)]](https://www.rsc.org/images/entities/char_2009.gif) Kγ±Nd(NO3)34[NO3−]aq3 Kγ±Nd(NO3)34[NO3−]aq3
| (5) |
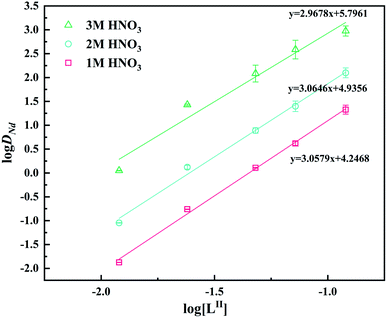
The ‘n’ values obtained by slope analysis are shown in Fig. 5. As seen, the slopes are all around 3, indicating that the stoichiometric ratio of Nd(III) to LII in the extracted species was 1![[thin space (1/6-em)]](https://www.rsc.org/images/entities/char_2009.gif) :
:![[thin space (1/6-em)]](https://www.rsc.org/images/entities/char_2009.gif) 3. This result is similar to the previously published results.53–56 Fig. 6 displays the ESI-MS of LI and LII ligands and their complexes with Nd(III). The characteristic peaks in the mass spectra of the two ligands are almost identical ([LI + H+, m/z 385.5; LII + H+, m/z 385.5]). When the ligands complexed with Nd(III), a peak appeared at m/z 681.6 corresponding to [Nd + 3LI + NO3]2+/[Nd + 3LII + NO3]2+. The structures of the complexes of LI and LII with Nd(III) could be identified as [NdLI3]3+ and [NdLII3]3+, respectively. Therefore, the compositions of the complexes formed by the two ligands and Nd(III) are the same.
3. This result is similar to the previously published results.53–56 Fig. 6 displays the ESI-MS of LI and LII ligands and their complexes with Nd(III). The characteristic peaks in the mass spectra of the two ligands are almost identical ([LI + H+, m/z 385.5; LII + H+, m/z 385.5]). When the ligands complexed with Nd(III), a peak appeared at m/z 681.6 corresponding to [Nd + 3LI + NO3]2+/[Nd + 3LII + NO3]2+. The structures of the complexes of LI and LII with Nd(III) could be identified as [NdLI3]3+ and [NdLII3]3+, respectively. Therefore, the compositions of the complexes formed by the two ligands and Nd(III) are the same.
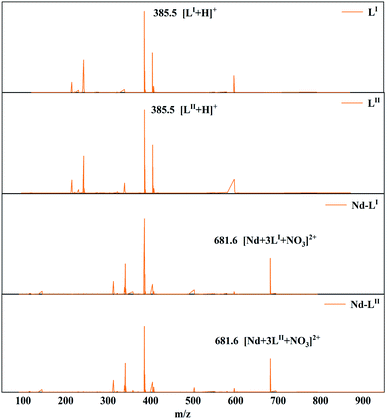 | ||
Fig. 6 ESI-MS analysis of the Nd(III) complexes with LI and LII in acetonitrile. M![[thin space (1/6-em)]](https://www.rsc.org/images/entities/char_2009.gif) : :![[thin space (1/6-em)]](https://www.rsc.org/images/entities/char_2009.gif) L = 1 L = 1![[thin space (1/6-em)]](https://www.rsc.org/images/entities/char_2009.gif) : :![[thin space (1/6-em)]](https://www.rsc.org/images/entities/char_2009.gif) 3; temperature: 25 ± 0.5 °C. 3; temperature: 25 ± 0.5 °C. | ||
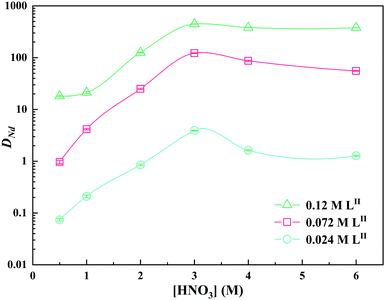
Table 1 compares the Nd(III) extraction performances of the LI and LII ligands and lists the distribution ratios at different concentrations of nitric acid and ligands. Under the same experimental conditions, the DNd of LI is higher than that of LII.
| Ligand | [L] (M) | [HNO3] (M) | ||||
|---|---|---|---|---|---|---|
| 1 | 2 | 3 | 4 | 6 | ||
| LI | 0.024 | 0.80 | 2.72 | 4.81 | 4.40 | 3.99 |
| 0.072 | 30.62 | 115.85 | 155.84 | 160.40 | 151.11 | |
| 0.12 | 117.94 | 306.42 | 490.55 | 466.24 | 347.20 | |
| LII | 0.024 | 0.21 | 0.85 | 3.92 | 1.62 | 1.27 |
| 0.072 | 4.16 | 25.02 | 122.22 | 86.89 | 55.51 | |
| 0.12 | 21.23 | 125.61 | 446.37 | 382.76 | 379.01 | |
![[thin space (1/6-em)]](https://www.rsc.org/images/entities/char_2009.gif) K vs. (1/T) are approximately linear, and the slope and intercept values can be used to calculate the values of ΔH and ΔS base on eqn (7).
K vs. (1/T) are approximately linear, and the slope and intercept values can be used to calculate the values of ΔH and ΔS base on eqn (7).
ΔG = ΔH − TΔS = −2.303RT![[thin space (1/6-em)]](https://www.rsc.org/images/entities/char_2009.gif) lg lg![[thin space (1/6-em)]](https://www.rsc.org/images/entities/char_2009.gif) K K
| (6) |
 | (7) |
Table 2 lists the thermodynamic data of Nd(III) extraction with the LII ligand, and the data of the LI ligand is also included for comparison. The ΔG values of the two ligands are negative, implying that the two extraction processes are exothermic. The absolute value of log![[thin space (1/6-em)]](https://www.rsc.org/images/entities/char_2009.gif) K of LI is larger than that of LII, which means that Nd(III) is more prone to complexation with LI ligand than with LII ligand at 298 K. The negative values of ΔS is because the degree of disorder in the extraction systems is reduced by the formation of the extracted species.57 The thermodynamic data on the extraction reaction combined with the results of the DNd demonstrates that the LI ligand has better Nd(III) extraction capability.
K of LI is larger than that of LII, which means that Nd(III) is more prone to complexation with LI ligand than with LII ligand at 298 K. The negative values of ΔS is because the degree of disorder in the extraction systems is reduced by the formation of the extracted species.57 The thermodynamic data on the extraction reaction combined with the results of the DNd demonstrates that the LI ligand has better Nd(III) extraction capability.
| Species | ΔH (kJ mol−1) | ΔS (J mol−1) | ΔG (298 K) (kJ mol−1) | log![[thin space (1/6-em)]](https://www.rsc.org/images/entities/char_2009.gif) K (298 K) K (298 K) |
|---|---|---|---|---|
| LI–Nd26 | −33.20 | −32.53 | −23.51 | 4.13 |
| LII–Nd | −22.82 | −24.69 | −15.46 | 4.08 |
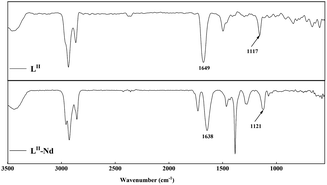
![[double bond, length as m-dash]](https://www.rsc.org/images/entities/char_e001.gif) O absorption band is blue-shifted from its position in the pure LII ligand spectrum at 1649 cm−1 to 1638 cm−1. The asymmetric stretching vibration band of the ether bond is locates at 1117 cm−1. After complexing with the metal ions, the absorption band of the ether bond is red-shifted to 1121 cm−1. This suggests that the LII molecule might form a tridentate complex with Nd(III) through two carbonyl groups and one ether group.60,61
O absorption band is blue-shifted from its position in the pure LII ligand spectrum at 1649 cm−1 to 1638 cm−1. The asymmetric stretching vibration band of the ether bond is locates at 1117 cm−1. After complexing with the metal ions, the absorption band of the ether bond is red-shifted to 1121 cm−1. This suggests that the LII molecule might form a tridentate complex with Nd(III) through two carbonyl groups and one ether group.60,61
Third phase formation
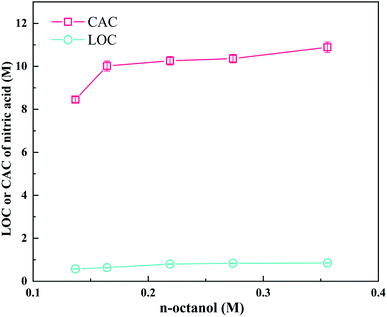
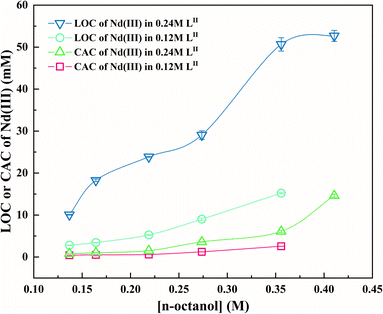
Fig. 8 exhibits the LOC and CAC of nitric acid depending on the concentration of n-octanol. LOC and CAC increase with an increase in the n-octanol concentration, which is consistent with previous results.9,10,62 The variation in the LOC and CAC of Nd(III) in LII with n-octanol concentration at 298 K for two different concentrations are shown in Fig. 9. It was found that n-octanol, as a phase modifier, effectively inhibited the third phase formation; moreover, at the same n-octanol concentration, the LOC and CAC of Nd(III) in the 0.24 M LII system are larger than those in the 0.12 M LII system. Generally, the formation of the third phase is owing to the increased polarity of the complexes after the Nd ions be extracted, which decreases their solubility in the non-polar diluent.27 Therefore, the degree of solvation of the complexes increase with the increasing of the n-octanol concentration.Fig. S4 and S5† show the trends of the LOC of Nd(III) with the initial HNO3 acidity and LII concentration, respectively. The LOC values decrease with an increasing of the nitric acid concentration on account of the competition between nitric acid and Nd(III)26 and increase with an increasing of the concentration of the extractant. When HNO3 or Nd(III) is transferred from the aqueous phase to the organic phase, acid-solvates, such as DGA·(HNO3)x, and metal-solvates, such as DGA·(Nd(NO3)3)x, are formed.63,64 The solvent molecules have strong polarity and tend to interact with each other automatically and undergo self-aggregation, thus forming spherical reverse micelles at mesoscopic scales.65 The tendency of aggregation depends on the polarity of the functional groups and the van der Waals interaction between the alkyl groups of the ligand and diluent.66,67 Typically, these reverse micelles have a structure with the metal ion as the core surrounded by long-chain alkyl groups. Table 3 presents the LOC and CAC of Nd in the LI and LII solvent systems. In general, compared with the LII ligand, the LI ligand have lower CAC values and higher LOC values. The higher LOC of LI means that the extraction capability of LI was better than LII, and the lower CAC value means that it is easier to form the third phase in LI than LII.
| [L] (M) | Ligand [n-octanol] (M) | LI | LII | ||
|---|---|---|---|---|---|
| CAC (mM) | LOC (mM) | CAC (mM) | LOC (mM) | ||
| 0.024 | 0.14 | 0.30 | 3.73 | 0.42 | 2.81 |
| 0.22 | 0.46 | 7.05 | 0.60 | 5.27 | |
| 0.27 | 1.06 | 12.09 | 1.23 | 9.02 | |
Theory Calculations
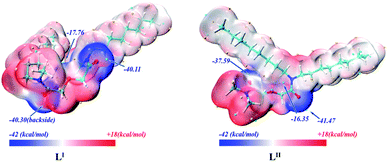
As shown in Fig. 10, there are minimum electrostatic potential points close to the ether O atom denoted as Oether and the two amide O atoms denoted as Oamide1 and Oamide2. For the LI ligand, the ESP values of Oamide1 and Oamide2 atoms are −40.30 and −40.11 kcal mol−1, respectively. For the LII ligand, Oamide1 is connected with two octyl groups, and its ESP value is −41.47 kcal mol−1, and Oamide2 is connected with two methyl groups, and the corresponding ESP value is −37.59 kcal mol−1. It is clear that for both LI and LII ligands, Oamide1 and Oamide2 have more negative electrostatic potentials than Oether; thus, the two amide O atoms are more likely to coordinate with the metal ions than the ether O atom. In addition, the difference between the ESP values of Oamide1 and Oamide2 in LII is larger than that in LI. In general, long-chain alkyl groups have a stronger electron-donating inductive effect than short alkyl chains, leading to a larger electron density on the amide O atom adjacent to the long alkyl chains. Therefore, the ESP value of Oamide1 is more negative than that of Oamide2 in LII, and the ESP values of Oamide1 and Oamide2 are approximately identical in LI.
The Mulliken charges on the Oether and Oamide of LI and LII are shown in Table S2.† The Mulliken charges on Oether of the two ligands are the same and less than those on the two amide O atoms. For LI, the Mulliken charges on Oamide1 and Oamide2 are the same, whereas, for LII, the Mulliken charge on Oamide1 is larger than that on Oamide2, which would affect the interaction between these ligands and metal ions, and further affect the stability of the complexes.
![[thin space (1/6-em)]](https://www.rsc.org/images/entities/char_2009.gif) :
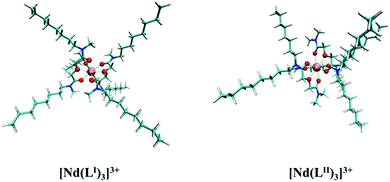
:![[thin space (1/6-em)]](https://www.rsc.org/images/entities/char_2009.gif) 3 complexes.70–72 The geometries of the two complexes were optimized at the B3LYB/6-311G(d)/RECP level of theory in the gas phase, and the structures are shown in Fig. 11. They indicated that both ligands coordinate with the Nd(III) ion acting as the tridentate type. Table S3† lists the bond lengths between Nd(III) and the ether O atom and the two amide O atoms of LI and LII. In both LI and LII, the Oether–Nd bond lengths are longer than the Oamide1–Nd and Oamide2–Nd bond lengths. The bond length of Oamide1–Nd is almost identical to that of Oamide2–Nd in LI, and the bond length of Oamide2–Nd is shorter than that of Oamide2–Nd in the LII ligand; therefore, there are some differences in the complexation strength between the two amide O atoms and Nd(III) in the LII ligand.
3 complexes.70–72 The geometries of the two complexes were optimized at the B3LYB/6-311G(d)/RECP level of theory in the gas phase, and the structures are shown in Fig. 11. They indicated that both ligands coordinate with the Nd(III) ion acting as the tridentate type. Table S3† lists the bond lengths between Nd(III) and the ether O atom and the two amide O atoms of LI and LII. In both LI and LII, the Oether–Nd bond lengths are longer than the Oamide1–Nd and Oamide2–Nd bond lengths. The bond length of Oamide1–Nd is almost identical to that of Oamide2–Nd in LI, and the bond length of Oamide2–Nd is shorter than that of Oamide2–Nd in the LII ligand; therefore, there are some differences in the complexation strength between the two amide O atoms and Nd(III) in the LII ligand.
| Ligand | Bond | MBOs | Average | |||
|---|---|---|---|---|---|---|
| LI | Oether–Nd | 0.113 | 0.114 | 0.113 | 0.113 | 0.319 |
| Oamide1–Nd | 0.318 | 0.319 | 0.318 | 0.319 | ||
| Oamide2–Nd | 0.320 | 0.319 | 0.318 | 0.319 | ||
| LII | Oether–Nd | 0.113 | 0.116 | 0.115 | 0.114 | 0.317 |
| Oamide1–Nd | 0.311 | 0.312 | 0.308 | 0.310 | ||
| Oamide2–Nd | 0.322 | 0.325 | 0.325 | 0.324 | ||
Topological analysis based on the electronic wave function information was also performed as part of QTAIM using Multiwfn 3.7, which has already been widely applied in the analysis of the Ln(III)/An(III) complexes. The topological analysis of electron density ρ(r) and its Laplacian (∇2ρ(r)) provides information about the bond properties. The (3, −1) saddle point on the electron density curvature is the bond critical point (BCP), and the electron curvature is positive in the direction of the atomic interaction line and negative in the direction of its orthogonality, and the electron density ρ(r) and potential energy density V(r) at the BCP position are closely related to the strength of the chemical bond.20 Generally, BCP ρ(r) > 0.20 a.u. and a negative ∇2ρ(r) value represent a covalent (open-shell) interaction, while ρ(r) < 0.10 a.u. with a positive ∇2ρ(r) value corresponds to a closed-shell interaction, which can be considered as ionic, hydrogen or van der Waals interaction. As shown in Table 5, the ρ(r) values at the Oamide–Nd and Oether–Nd BCPs are <0.1 a.u., and all the ∇2ρ(r) values are positive. Therefore, the interactions between the two ligands and Nd(III) show the mainly ionic characteristics.
| Bond type | Species | |||
|---|---|---|---|---|
| [NdLI3]3+ | [NdLII3]3+ | |||
| ρ(r) | ∇2ρ(r) | ρ(r) | ∇2ρ(r) | |
| Oamide1–Nd | 0.048 | 0.195 | 0.050 | 0.201 |
| 0.048 | 0.194 | 0.049 | 0.199 | |
| 0.048 | 0.194 | 0.050 | 0.202 | |
| Oamide2–Nd | 0.048 | 0.194 | 0.047 | 0.190 |
| 0.048 | 0.195 | 0.047 | 0.189 | |
| 0.048 | 0.194 | 0.047 | 0.190 | |
| Oether–Nd | 0.029 | 0.124 | 0.029 | 0.123 |
| 0.029 | 0.124 | 0.029 | 0.125 | |
| 0.029 | 0.125 | 0.028 | 0.123 | |
| Average | 0.0461 | 0.0459 | ||
In addition, the ρ(r) values at the Oamide1–Nd BCP for the two complexes are larger than those at Nd–Oether, demonstrating that Oamide have a stronger capacity for complexation. The slightly larger difference between the ρ(r) values at the Oamide1–Nd and Oamide2–Nd of the LII ligand combined with the results on MBOs and electrostatic potential prove that the interactions between the two Oamide of LII and Nd(III) are in a state of imbalance. The average ρ(r) value at the Nd-Oamide BCP of [NdLI3]3+ is larger than that of [NdLII3]3+, further showing that there is a stronger interaction between Nd(III) and the LI ligand.75
![[thin space (1/6-em)]](https://www.rsc.org/images/entities/char_2009.gif) :
:![[thin space (1/6-em)]](https://www.rsc.org/images/entities/char_2009.gif) 3 Nd(III)/LI complex (−211.35 kJ mol−1) is more negative than that of 1
3 Nd(III)/LI complex (−211.35 kJ mol−1) is more negative than that of 1![[thin space (1/6-em)]](https://www.rsc.org/images/entities/char_2009.gif) :
:![[thin space (1/6-em)]](https://www.rsc.org/images/entities/char_2009.gif) 3 Nd(III)/LI complex (−181.87 kJ mol−1), which is in good agreement with the order of the experimentally determined distribution ratio values. This further verify that LI possesses outstanding complexing ability with Nd(III) than LII.
3 Nd(III)/LI complex (−181.87 kJ mol−1), which is in good agreement with the order of the experimentally determined distribution ratio values. This further verify that LI possesses outstanding complexing ability with Nd(III) than LII.
| Reactions | ΔG (298 K) |
|---|---|
| [Nd(H2O)9](aq)3+ + LI(org) = [NdLI3](org)3+ + 9H2O(aq) | −211.35 |
| [Nd(H2O)9](aq)3+ + LII(org) = [NdLII3](org)3+ + 9H2O(aq) | −181.87 |
Conclusions
In the present study, N,N-dimethyl-N′,N′-dioctyl diglycolamide (LII) was synthesized, and its extraction and loading capabilities towards Nd(III) from the nitric acid medium were studied by employing 40/60 (v/v)% n-octanol/kerosene as the diluent. DNd increases with nitric acidity and the concentration of the extractant and decreases with increasing temperature. The stoichiometry of the extracted species is Nd(NO3)3·3LII, as verified by the results of ESI-MS and FT-IR. The LOC and CAC of Nd increase with the increasing in the concentrations of n-octanol and extractant and decreased with the increase in the initial acidity of the aqueous medium. In comparison with its isomeric ligand N,N′-dimethyl-N,N′-dioctyl diglycolamide (LI), LII shows a lower distribution ratio of Nd(III) but is more advantageous in terms of preventing the formation of the third phase, which is reflected in its higher CAC value under similar experimental conditions.The electrostatic potential and Mulliken charge analysis of the two ligands indicate that the difference in the electron-donating ability of the two amide O atoms in LII is larger than that in LI. The complexation between LI/LII and Nd(III) is predominantly through ionic interactions. The MBOs and QTAIM show that the complexation interaction strength of Nd–Oamide1 and Nd–Oamide2 are almost identical in LI, while those in LII display certain differences, and this inhomogeneity in LII seem to influence its extraction performance towards metal ions, such as Nd(III), which is in accordance with the thermodynamic results. These results may shed light on the design of DGA class ligands for separating HLLW and help us better understand the structure–activity relationship in DGAs.
Conflicts of interest
There are no conflicts to declare.Acknowledgements
The work was supported by Special Fund of Central University Basic Scientific Research Fee (3072019CF1503).Notes and references
- M. Salvatores, Nucl. Eng. Des., 2005, 235, 805–816 CrossRef CAS.
- S. A. Ansari, P. K. Mohapatra, A. Leoncini, S. M. Ali, J. Huskens and W. Verboom, Inorg. Chem., 2019, 58, 8633–8644 CrossRef CAS PubMed.
- S. Tachimori, Y. Sasaki and S. Suzuki, Solvent Extr. Ion Exch., 2007, 20, 687–699 CrossRef.
- S. Nave, G. Modolo, C. Madic and F. Testard, Solvent Extr. Ion Exch., 2004, 22, 527–551 CrossRef CAS.
- H. Suzuki, Y. Sasaki, Y. Sugo, A. Apichaibukol and T. Kimura, Radiochim. Acta, 2004, 92, 463–466 CrossRef CAS.
- S. Manohar, J. N. Sharma, B. V. Shah and P. K. Wattal, Nucl. Sci. Eng., 2017, 156, 96–102 CrossRef.
- D. Whittaker, A. Geist, G. Modolo, R. Taylor, M. Sarsfield and A. Wilden, Solvent Extr. Ion Exch., 2018, 36, 223–256 CrossRef CAS.
- S. A. Ansari, P. Pathak, P. K. Mohapatra and V. K. Manchanda, Chem. Rev., 2012, 112, 1751–1772 CrossRef CAS PubMed.
- J. Ravi, K. A. Venkatesan, M. P. Antony, T. G. Srinivasan and P. R. Vasudeva Rao, J. Radioanal. Nucl. Chem., 2012, 295, 1283–1292 CrossRef.
- J. Ravi, T. Prathibha, K. A. Venkatesan, M. P. Antony, T. G. Srinivasan and P. R. Vasudeva Rao, Sep. Purif. Technol., 2012, 85, 96–100 CrossRef CAS.
- J. Ravi, K. Venkatesan, M. Antony, T. Srinivasan and P. V. Rao, Radiochim. Acta, 2014, 102, 599–607 CrossRef CAS.
- E. A. Mowafy and D. Mohamed, Sep. Sci. Technol., 2017, 52, 1006–1014 CrossRef CAS.
- Z. Wei, C. Lu, Y. Zhou, C. Jiao, M. Zhang, H. Hou, Y. Gao and G. Tian, J. Radioanal. Nucl. Chem., 2019, 323, 875–884 CrossRef.
- Q. Liu, J. Zhou, L. Zhu, Y. Zhang, D. Li, S. Yang and G. Tian, Solvent Extr. Ion Exch., 2020, 38, 485–495 CrossRef CAS.
- Y. Liu, Z. Liu, C. Zhao, Y. Zhou, Y. Gao and H. He, Prog. Chem., 2020, 2, 219–229 Search PubMed.
- Y. Liu, C. Zhao, Z. Liu, Y. Zhou, C. Jiao, M. Zhang, H. Hou, Y. Gao, H. He and G. Tian, J. Radioanal. Nucl. Chem., 2020, 325, 409–416 CrossRef CAS.
- Q. Chen, C. Lu, Y. Hu, Y. Liu, Y. Zhou, C. Jiao, M. Zhang, H. Hou, Y. Gao and G. Tian, J. Radioanal. Nucl. Chem., 2021, 327, 565–573 CrossRef CAS.
- Y. Liu, C.-Z. Wang, Q.-Y. Wu, J.-H. Lan, Z.-F. Chai, Q. Liu and W.-Q. Shi, Inorg. Chem., 2020, 59, 11469–11480 CrossRef CAS PubMed.
- D. Stamberga, M. R. Healy, V. S. Bryantsev, C. Albisser, Y. Karslyan, B. Reinhart, A. Paulenova, M. Foster, I. Popovs, K. Lyon, B. A. Moyer and S. Jansone-Popova, Inorg. Chem., 2020, 59, 17620–17630 CrossRef CAS PubMed.
- C. Wang, Q. Y. Wu, C. Z. Wang, J. H. Lan, C. M. Nie, Z. F. Chai and W. Q. Shi, Dalton Trans., 2020, 49, 4093–4099 RSC.
- S. Guoxin, L. Min, C. Yu, Y. Meilong and Y. Shaohong, Solvent Extr. Ion Exch., 2010, 28(4), 482–494 CrossRef.
- A. Suresh, C. V. S. B. Rao, K. N. Sabharwal, T. G. Srinivasan and P. R. V. Rao, Solvent Extr. Ion Exch., 1999, 17, 73–86 CrossRef CAS.
- M. Bodanszky, J. C. Tolle, S. S. Deshmane and A. Bodanszky, Int. J. Pept. Protein Res., 2009, 12, 57–68 Search PubMed.
- Z. Kolarik and E. P. Horwitz, Solvent Extr. Ion Exch., 1988, 6, 61–91 CrossRef CAS.
- P. R. Vasudeva Rao and Z. Kolarik, Solvent Extr. Ion Exch., 1996, 14, 955–993 CrossRef.
- Y. Liu, Y. Gao, Z. Wei, Y. Zhou, M. Zhang, H. Hou, G. Tian and H. He, J. Radioanal. Nucl. Chem., 2018, 318, 2087–2096 CrossRef CAS.
- P. Deepika, K. N. Sabharwal, T. G. Srinivasan and P. R. Vasudeva Rao, Solvent Extr. Ion Exch., 2010, 28, 184–201 CrossRef CAS.
- P. John, Phys. Rev. B: Condens. Matter Mater. Phys., 1986, 33, 8822–8824 CrossRef PubMed.
- R. Nityananda, P. Hohenberg and W. J. R. Kohn, Resonance, 2017, 22, 809–811 CrossRef.
- M. Frisch, G. Trucks, H. Schlegel, G. Scuseria, M. Robb, J. Cheeseman, G. Scalmani, V. Barone, G. Petersson and H. Nakatsuji, GAUSSIAN 16 (Revision B.01), Gaussian Inc., Pittsburgh, PA, 2016 Search PubMed.
- A. D. Becke, Phys. Rev. B: Condens. Matter Mater. Phys., 1998, 98, 5648–5652 Search PubMed.
- C. Lee, W. Yang and R. G. Parr, Phys. Rev. B: Condens. Matter Mater. Phys., 1988, 37, 785 CrossRef CAS PubMed.
- Q. Y. Wu, Y. T. Song, L. Ji, C. Z. Wang, Z. F. Chai and W. Q. Shi, Phys. Chem. Chem. Phys., 2017, 19, 26969–26979 RSC.
- A. Zaiter, B. Amine, Y. Bouzidi, L. Belkhiri, A. Boucekkine and M. Ephritikhine, Inorg. Chem., 2014, 53, 4687–4697 CrossRef CAS PubMed.
- M. Dolg, H. Stoll and H. J. Preuss, J. Chem. Phys., 1989, 90, 1730–1734 CrossRef CAS.
- W. Küchle, M. Dolg, H. Stoll and H. Preuss, J. Chem. Phys., 1994, 100, 7535–7542 CrossRef.
- X. Cao and M. J. T. Dolg, J. Mol. Struct., 2002, 581, 139–147 CrossRef CAS.
- Y. Zhao and D. G. Truhlar, J. Chem. Phys., 2008, 128, 184109 CrossRef PubMed.
- M. Regueiro-Figueroa, D. Esteban-Gómez, A. de Blas, T. Rodríguez-Blas and C. Platas-Iglesias, Chem.–Eur. J., 2014, 20, 3974–3981 CrossRef CAS PubMed.
- A. J. Bridgeman, G. Cavigliasso, L. R. Ireland and J. Rothery, Dalton Trans., 2001, 2095–2108 RSC.
- R. F. Bader, J. Chem. Rev., 1991, 91, 893–928 CrossRef CAS.
- R. F. Bader, J. Phys. Chem. A, 1998, 102, 7314–7323 CrossRef CAS.
- H.-B. Zhao, M. Zheng, G. Schreckenbach and Q.-J. Pan, Dalton Trans., 2018, 47, 2148–2151 RSC.
- T. Lu and F. J. Chen, J. Comput. Chem., 2012, 33, 580–592 CrossRef CAS PubMed.
- F. McLachlan, K. Greenough, A. Geist, B. McLuckie, G. Modolo, A. Wilden and R. Taylor, Solvent Extr. Ion Exch., 2016, 34, 334–346 CrossRef CAS.
- J. Ravi, K. A. Venkatesan, M. P. Antony, T. G. Srinivasan and P. R. Vasudeva Rao, Solvent Extr. Ion Exch., 2014, 32, 424–436 CrossRef CAS.
- D. Xu, Z. Shah, Y. Cui, L. Jin, X. Peng, H. Zhang and G. Sun, Hydrometallurgy, 2018, 180, 132–138 CrossRef CAS.
- Y. Xu, Y. Gao, Y. Zhou, C. Fan, H. Hou and M. Zhang, Solvent Extr. Ion Exch., 2017, 35, 507–518 CrossRef CAS.
- X. Cai, B. Wei, J. Han, Y. Li, Y. Cui and G. Sun, Hydrometallurgy, 2016, 164, 1–6 CrossRef CAS.
- K. Pitzer, J. Phys. Chem., 1973, 77, 268–277 CrossRef CAS.
- K. S. Pitzer and G. Mayorga, in Molecular Structure and Statistical Thermodynamics: Selected Papers of Kenneth S. Pitzer, World Scientific, 1993, pp. 396–404 Search PubMed.
- K. S. Pitzer, Activity Coefficients in Electrolyte Solutions, CRC Press, 2018 Search PubMed.
- X. Liu, G. Sun, X. Cai, X. Yang, Y. Li, Z. Sun and Y. Cui, J. Radioanal. Nucl. Chem., 2015, 306, 549–553 CrossRef CAS.
- E. A. Mowafy and D. Mohamed, J. Rare Earths, 2015, 33, 432–438 CrossRef CAS.
- E. A. Mowafy and H. F. Aly, Solvent Extr. Ion Exch., 2007, 25, 205–224 CrossRef CAS.
- P. N. Pathak, S. A. Ansari, S. V. Godbole, A. R. Dhobale and V. K. Manchanda, Spectrochim. Acta, Part A, 2009, 73, 348–352 CrossRef CAS PubMed.
- Y. Cai, S. A. Ansari, K. Fu, B. Zhu, H. Ma, L. Chen, S. D. Conradson, S. Qin, H. Fu, P. K. Mohapatra, L. Yuan and W. Feng, J. Hazard. Mater., 2020, 124214, DOI:10.1016/j.jhazmat.2020.124214.
- R. B. Gujar, S. A. Ansari, P. K. Mohapatra and V. K. Manchanda, Solvent Extr. Ion Exch., 2010, 28, 350–366 CrossRef CAS.
- Y. Cui, Y.-q. Wang, M.-p. Pang, L.-n. Zhang, H.-f. Zhou, Q.-y. Dang and G.-x. Sun, Hydrometallurgy, 2015, 152, 1–6 CrossRef CAS.
- F. Kou, S. Yang, H. Qian, L. Zhang, C. M. Beavers, S. J. Teat and G. Tian, Dalton Trans., 2016, 45, 18484–18493 RSC.
- F. Kou, S. Yang, L. Zhang, S. J. Teat and G. Tian, Inorg. Chem. Commun., 2016, 71, 41–44 CrossRef CAS.
- J. Ravi, K. A. Venkatesan, M. P. Antony, T. G. Srinivasan and P. R. Vasudeva Rao, Radiochim. Acta, 2014, 102, 609–617 CrossRef CAS.
- A. Paquet, O. Diat, L. Berthon and P. Guilbaud, J. Mol. Liq., 2019, 277, 22–35 CrossRef CAS.
- T. Prathibha, K. A. Venkatesan and M. P. Antony, Colloids Surf., A, 2018, 538, 651–660 CrossRef CAS.
- R. Ganguly, J. N. Sharma and N. Choudhury, J. Colloid Interface Sci., 2011, 355, 458–463 CrossRef CAS PubMed.
- P. N. Pathak, S. A. Ansari, S. Kumar, B. S. Tomar and V. K. Manchanda, J. Colloid Interface Sci., 2010, 342, 114–118 CrossRef CAS PubMed.
- M. P. Jensen, T. Yaita and R. Chiarizia, Langmuir, 2007, 23, 4765–4774 CrossRef CAS PubMed.
- R. G. Surbella III, L. C. Ducati, K. L. Pellegrini, B. K. McNamara, J. Autschbach, J. M. Schwantes and C. L. Cahill, J. Am. Chem. Soc., 2017, 139, 10843–10855 CrossRef PubMed.
- T. Lu and S. Manzetti, J. Struct. Chem., 2014, 25, 1521–1533 CrossRef CAS.
- Y. Gong, G. Tian, L. Rao and J. K. Gibson, Inorg. Chem., 2014, 53, 12135–12140 CrossRef CAS PubMed.
- G. Tian, S. J. Teat and L. Rao, Inorg. Chem., 2014, 53, 9477–9485 CrossRef CAS PubMed.
- D. M. Brigham, A. S. Ivanov, B. A. Moyer, L. H. Delmau, V. S. Bryantsev and R. J. Ellis, J. Am. Chem. Soc., 2017, 139, 17350–17358 CrossRef CAS PubMed.
- I. Mayer, J. Quantum Chem., 1986, 29, 477 CrossRef CAS.
- X.-W. Chi, Q.-Y. Wu, Q. Hao, J.-H. Lan, C.-Z. Wang, Q. Zhang, Z.-F. Chai and W.-Q. Shi, Organometallics, 2018, 37, 3678–3686 CrossRef CAS.
- B. Vlaisavljevich, P. Miro, C. J. Cramer, L. Gagliardi, I. Infante and S. T. Liddle, Chem. - Eur. J., 2011, 17, 8424–8433 CrossRef CAS PubMed.
Footnote |
| † Electronic supplementary information (ESI) available: Characterization data of LII by 1H NMR, 13C NMR and FT-IR; effect of NO3− and H+ concentration on DNd; effect of temperature on the K; LOC of Nd(III) as a function of aqueous phase acidity and ligand concentration; stripping behavior; Mulliken charge population analysis; average Nd–O bond lengths of complexes. See DOI: 10.1039/d1ra04222j |
| This journal is © The Royal Society of Chemistry 2021 |


