DOI:
10.1039/D1RA04197E
(Paper)
RSC Adv., 2021,
11, 26524-26533
In silico study of the inhibition of SARS-COV-2 viral cell entry by neem tree extracts†
Received
30th May 2021
, Accepted 3rd July 2021
First published on 3rd August 2021
Abstract
The outbreak of COVID-19, caused by SARS-COV-2, is responsible for higher mortality and morbidity rates across the globe. Until now, there is no specific treatment of the disease and hospitalized patients are treated according to the symptoms they develop. Efforts to identify drugs and/or vaccines are ongoing processes. Natural products have shown great promise in the treatment of many viral related diseases. In this work, using in silico methods, bioactive compounds from the neem tree were investigated for their ability to block viral cell entry as spike RBD-ACE2 inhibitors. Azadirachtin H, quentin and margocin were identified as potential compounds that demonstrated viral cell entry inhibition properties. The structural re-orientation of azadirachtin H was observed as the mechanism for viral cell entry inhibition. These compounds possessed good pharmacodynamic properties. The proposed molecules can serve as a starting point towards developing effective anti-SARS-COV-2 drugs targeting the inhibition of viral cell entry upon further in vitro and in vivo validation.
1 Introduction
Natural products have served man for centuries as medicines for the treatment of various health conditions. Because of their tremendous structural range and unique chemical diversity, natural products have continued to serve as starting points in drug discovery.1 Today, modern pharmaceutical industries have reported many successful examples of natural products which have inspired drug discovery.1 Several plants are known to be excellent sources of natural products. For instance, the neem tree (Azadirachta indica) is a known source of bioactive compounds used in Ayurvedic and folk medicine.2 Bioactive compounds from neem (leaves, flowers, seeds, fruits, roots and bark) have been reported in different studies to possess several biological activities including antibacterial, antifugal, antiinflammatory, antioxidant, antimalaria and antiviral activities, to mention a few.2,3 The latter has attracted much attention and motivated us to carry out this work. The known antiviral activities of neem bioactive compounds include activity against smallpox, chickenpox, herpes, polio virus, dengue virus and HIV.3 The previously reported antiviral properties of neem bioactive extracts motivates further exploration on other unreported viruses, which has potential to help in managing, treating and controlling disease outbreaks associated with viral infections such as COVID-19, among others.
Recently, the world wide outbreak of coronavirus disease in 2019 (COVID-19) caused by severe acute respiratory syndrome coronavirus 2 (SARS-COV-2), has caused more than 2 million deaths and over 68 million cases, as of December 2020.1 During the second wave of the outbreak, India reported its highest number of deaths, reaching 246![[thin space (1/6-em)]](https://www.rsc.org/images/entities/char_2009.gif) 146, with over 22 million cases as of May 2021. Until now, there is no specific treatment approved for COVID-19, which has resulted in global attention to find inhibitors of key SARS-COV-2 viral processes. Due to the fact that designing and developing a new drug is a costly and lengthy process,1,4,5 the use of natural products is thought to be an excellent solution for many disease outbreaks, including COVID-19.6–9 Indeed, several classes of natural products have been known to manage COVID-19 in many communities.6–10 In addition, natural products are known to have few side effects.11
146, with over 22 million cases as of May 2021. Until now, there is no specific treatment approved for COVID-19, which has resulted in global attention to find inhibitors of key SARS-COV-2 viral processes. Due to the fact that designing and developing a new drug is a costly and lengthy process,1,4,5 the use of natural products is thought to be an excellent solution for many disease outbreaks, including COVID-19.6–9 Indeed, several classes of natural products have been known to manage COVID-19 in many communities.6–10 In addition, natural products are known to have few side effects.11
Several research groups have focused on finding inhibitors of SARS-COV-2 main protease (MPro), which is responsible for mediating the viral replication and transcription processes.3,12–14 More recently, bioactive compounds from the neem tree showed inhibitory effects against the SARS-COV-2 papain-like protease (PLpro) in silico.3 Besides MPro and PLpro, another target that has attracted much attention is the spike protein responsible for the entry of the virion to human cells.
The SARS-COV-2 virion contains many glycosylated spike proteins which extend from the envelope, forming two subunits S1 and S2. The former subunit comprises the receptor-binding domain (RBD) and is responsible for interacting with cell surfaces by the human angiotensin-converting enzyme 2 (hACE2) (see Fig. 1a). The latter subunit is responsible for facilitating the fusion of the viral membrane with that of the host cells.1 Several reports have demonstrated that the spike protein is important for the viral life cycle and it is an important target to block viral cell entry.1,4,15 Currently, computational works have reported peptides and small molecules as inhibitors of the spike RBD.1,4,15–18 However, to the best of our knowledge, there is no study which has reported the antiviral effectiveness of neem extracts as spike RBD-ACE2 inhibitors in silico.
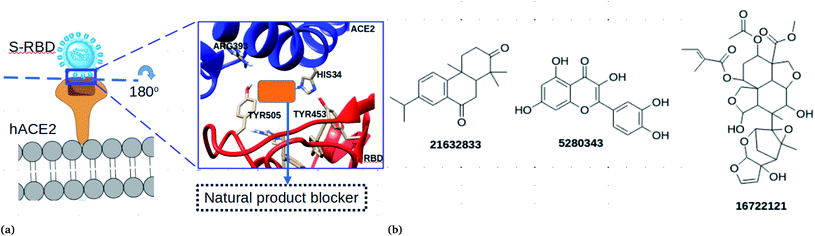 |
| | Fig. 1 (a) Cell entry mechanisms of SARS-COV-2 through attachment to the human ACE2 enzyme. The virus attaches to the human cell with strong interactions using the anchoring residues HIS34 and ARG393. The orange block represents potential natural products that can block viral cell entry. (b) Chemical structures of the best natural product inhibitors of spike RBD–ACE2 mediated cell entry. | |
In this work, an in silico drug design approach was carried out to investigate natural products from neem as potential blockers of S-RBD viral entry. The computational approaches employed in this study suggested three compounds (Fig. 1b) that could disrupt the spike RBD–ACE2 interaction.
2 Computational methodology
2.1 Molecular docking
The structure of SARS-COV-2 spike RBD–ACE2 protein (PDB ID: 6LZG)19 was obtained from a protein data bank.20 The protein was prepared by adding polar hydrogen and Gainster charges in Open babel.21 A total of 19 compounds (Fig. S1†) from neem extracts were obtained from PubChem Database (CID) database.22 Polar hydrogen at pH 7.4 and Gainster charges23 were added and then energy minimized in Open babel.21 In this work, both flexible and rigid protein structures were considered to establish the effect of protein flexibility on the binding nature of the studied compounds. All docking calculation involving flexible and rigid proteins were performed using autodock vina, as described in our previous works.24,25 Briefly, for docking calculation involving flexible receptor, a molecular dynamics simulation was run, and a total of 40 ensemble structures were extracted from the equilibrium MD. The structures were prepared and used for docking calculations. It should be noted that docking calculation employed in this work was validated using the procedures reported in our recent works.24,25 Configurations with best binding poses were further analysed and subjected to a metadyanamics simulation study to investigate the unbinding process and their ability to disrupt critical node recognition at the spike RBD–ACE2.
2.2 Molecular dynamics (MD) simulations
Complexes, with the lowest binding free energy obtained from docking calculations, and the free protein were subjected to classical molecular dynamics simulations to establish the dynamical stability and unbinding profile of the molecules. The MD simulation of the free protein was performed to obtain receptor ensembles for full flexible docking calculations. Classical MD simulations of the free protein and the complexes were performed using Gromacs v2018,26 as described in our recent works.24,25 Briefly, the topology of the protein was obtained using the AMBER03 force field and the ligand topology was generated using the antechamber tool and GAFF. The systems were initially soaked in a cubic box with the TIP4P water27 model and neutralized with 24 Na+ ions. Systems energy minimization was performed using the steepest descent algorithm to remove atom constraints and crushes from the docking calculations. The systems were then subjected to two equilibration phases with position restraints in the NVT-ensemble for 5 ns and then relaxed in the NPT-ensemble for 1 ns. During equilibration, the temperature and pressure coupling were controlled at 300 K and 1 bar using the v-rescale28 and Parrinelo–Rahman barostat29 methods, respectively. The production phase was done in the NPT-ensemble using the Parrinelo–Rahman barostat29 for pressure coupling at an isotropic pressure of 1 bar using a 0.1 ps coupling time. In all simulations, the particle mesh Ewald (PME) method30 was used to treat long range electrostatic interactions with a cutoff distance of 11 Å for both electrostatic and van der Waals interactions. Bond lengths were constrained using the LINCS algorithm31 and an integration time step of 2 fs was used in all simulations. For the free protein, a production run of 30 ns was used and from the equilibrium MD a total of 40 ensemble structures were extracted and subjected to flexible docking calculations. A production run of 35 ns for the complexes was performed to reach equilibrium, then the equilibrated structure was used as the starting configuration for molecular mechanics Poisson–Boltzmann surface area (MM/PBSA) calculations and well-tempered metadynamics simulations to investigate the unbinding profile.
2.3 MM/PBSA binding free energy calculations
Since docking calculations are poor at estimating the accurate binding free energy, end-point free energy calculations, based on molecular mechanics Poisson–Boltzmann (MM/PBSA), was performed using the g_mmpbsa tool32 to recalculate the observed binding free energy. The binding free energy (ΔGbind) for the protein–ligand interaction is expressed as in eqn (1)| | |
ΔGbind = Gcomplex − (Gprotein + Gligand)
| (1) |
| | |
GX = 〈EMM〉 + 〈Gsol〉 − TΔS
| (2) |
| | |
〈EMM〉 = 〈Ebonded〉 + 〈Enon-bonded〉 = 〈Ebonded〉 + (EvdW + Eelec)
| (3) |
| | |
〈Gsol〉 = Gpolar + Gnon-polar = Gpolar + (γ × SASA + b)
| (4) |
where 〈EMM〉 is the average molecular mechanics energy terms in vacuum, which includes bonded and non-bonded interactions, and 〈Gsol〉 is the free energy of solvation, which includes Gpolar and Gnon-polar. The Gnon-polar contribution to the free energy is calculated by adding γ × SASA, where γ is a coefficient related to the surface tension, SASA is the solvent accessible surface area, b is the fitting parameter and TΔS is the entropic contribution to the free energy. In g_mmpbsa, an entropic contribution is not considered.32 In this work, the binding free energy was calculated using a single trajectory, where a total of 300 snapshots were equally extracted at a predetermined time from the equilibrium MD. The solvent dielectric constant was set to 80, while the solute dielectric constant was set to 2, γ was 0.0227 and the PB equation was linearly solved using PBsolver.
2.4 Well-tempered metadynamics simulation
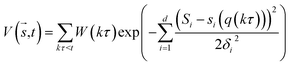
In metadynamics, a history-dependent bias potential, V (eqn (5)), is constructed in the space of few selected degrees of freedom,  , called collective variables (CVs). This potential is built as a sum of the Gaussian kernels (height (W) and width (δi)) deposited along the trajectory in the CVs space.
| |
 | (5) |
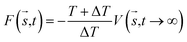
where t is the deposition time and τ is the time interval where the Gaussian potential with height is added on the position si(q(kτ)) of the biased molecules. Well-tempered metadynamics (WT-MetaD)33 a version of metadynamics, has an advantage over classical molecular dynamics by allowing sampling of the whole conformation space, as well as the determination of the FES of a complex. WT-MetaD provides control over the convergence and errors during simulation as compared to standard metadynamics. In WT-MetaD, the Gaussian height is decreased with simulation time at a fictitious higher temperature, T + ΔT. MetaD has nonequilibrium characteristics and by turning the ΔT it becomes possible to obtain information near to the true equilibrium state of the given system. In this work, the potential of mean force (PMF) or the free energy surface (FES) was calculated as shown in eqn (6),| |
 | (6) |
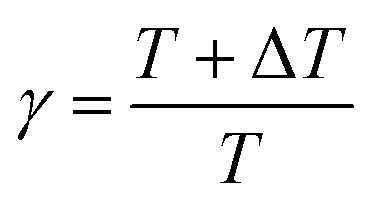
where T is the temperature of the system. During well-tempered metadynamics, the bias factor γ is defined as the ratio between the temperatures of the CVs (T + ΔT), as indicated in eqn (7).| |
 | (7) |
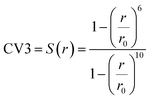
In MetaD, there is a lack of straightforward methods to determine the CVs and the time to stop the MetaD simulation. In the latter case, convergence of the system is important in obtaining an accurate PMF. The MetaD convergence errors are solved in the WT-MetaD method by adding smaller biases. The configurational space is controlled by making ΔT to approach zero for equilibrium MD and ΔT approach infinity for standard MetaD. During the WT-MetaD simulation, the CVs presented in Table 1 were taken into account; initially, two CVs, CV1 and CV2, were run in separate simulations and the 1D and 2D FES were computed. In another simulation, a set of two CVs, i.e. CV2 and CV3 were run, and the 2D FES was calculated. The coordination number (CV3) was computed using eqn (8), where r is the distance between selected atoms in the protein and ligand, and ro = 6 Å is a parameter which considers the typical carbon–carbon distance. WT-MetaD was carried out in the NPT-ensemble with a Gaussian hill height = 0.8 kJ mol−1, bias factor = 15 and width = 0.05 nm. WT-MetaD was done using the Plumed 2.4 plug-in in the Gromacs v2018 program package.
| |
 | (8) |
Table 1 Set of CVs used to describe the unbinding and protein–protein separation processes
| CV |
Description |
| CV1 |
COM distance between LYS417 (S-RBD) and ASP30 (ACE2) |
| CV2 |
COM between the ligand and specific residues (Lys417, Asp30) |
| CV3 |
Coordination number between the ligand and the residues |
2.5 Pharmacokinetic and pharmacodynamic studies
The pharmacokinetic properties of the selected neem extracts were computed using the swissadmet tool.34 The Lipinski rule of five was used to evaluate the drug-likeness properties; the role requires that an orally active drug should have a minimum of four of the five criteria, namely H-bond acceptor, H-bond donor, molecular mass and logP.35 The pharmacodynamic properties, absorption, distribution, metabolism, excretion and toxicity (ADMET), of the selected neem extracts were predicted using the admetSAR tool (https://www.lmmd.ecust.edu.cn:8000/).36
3 Results and discussion
3.1 Rigid and flexible docking calculation
The higher transmissibility rate of SARS-COV-2 is related to its strong affinity with human ACE2, as documented in several reports.19,37,38 Among the best strategies, besides finding effective vaccines, finding potential inhibitors that can block viral cell entry to human cells. Several classes of natural products, including flavonoids such as diosimin25,39 and hesperidin,40 have been suggested as potential blockers. In addition, efforts to identify other natural products as SARS-COV-2 cell entry inhibitors are underway. Our research group has carried out computational work to screen compounds from neem tree extracts as potential inhibitors of SARS-COV-2 cell entry. Bioactive compounds from the neem tree are known to possess a wide range of biological activities, including antiviral activity.3 The use of neem tree extracts to manage viral diseases including COVID-19 has been proposed, however, the mechanism of action of these compounds remains not well explored with only few studies reported.3 As an example, very recently the binding affinity of neem tree extracts against the papain like protease (PLpro) was reported using in silico methods.3
3.1.1 Azadirachtin H binds strongly to both the spike and the RBD–ACE2 interface. A total of 19 plant extracts were first screened using the crystal structure. Blind and restricted docking calculations were performed on the crystal structure of SARS-COV-2. It should be noted that the inhibition of the ACE2 catalytic site formed by residues ARG708, SER709 and ARG710, which are responsible for ACE2’s enzymatic activities, results in toxic side effects, hence should be avoided. It was interesting to note that all of the docked molecules did not bind to the ACE2 enzymatic region, however, they bound at the spike RBD–ACE2 interface and the ACE2 pocket.Docking calculations at the spike RBD–ACE2 showed that compound CID 16722121 binds favourably with a binding free energy of −8.18 kcal mol−1, which is lower than that of hesperidin, which is known to bind with −7 kcal mol−1. Compound CID 21632833 interacted with a binding free energy of −7.58 kJ mol−1. Three compounds, CID 5280343, 185552 and 3034112, had binding free energies of −7.5 kcal mol−1. Interestingly, CID 5280343 (quecertine) has been reported in several reviews to show virion cell entry inhibition as well as interfering with DNA or RNA polymerases in many viruses, including SARS-COV-2.41 The observed binding free energies correspond to inhibition constants (Ki) of 0.959, 2.65 and 3.03 μM, for CID 16722121, 21632833 and 5280343, respectively, suggesting that they are promising compounds in the discovery of SARS-COV-2 viral entry inhibitors. To account for the effects of receptor flexibility, relaxed complex scheme docking calculations were performed. 40 receptor ensembles were extracted from the equilibrium MD and docking calculations were performed for each structure. We observed that during the ensemble structure the binding free energy changed for some compounds. For example, compound CID 16722121 had a higher binding free energy for the crystal structure (Table 2), however, the binding free energy decreased during flexible docking calculations. The observed changes in the binding free energy reflect the sensitivity of the results to the receptor ensembles.
Table 2 Binding free energies (kJ mol−1) of 19 neem tree extracts with rigid and flexible SARS-COV-2 spike RBD–ACE2
| CID |
Rigid |
Flexible |
| RBD–ACE2 |
ACE2 |
Spike |
RBD–ACE2ens |
| 985 |
−19.31 |
−22.99 |
−22.15 |
−21.69 ± 2.67 |
| 108058 |
−28.00 |
−30.93 |
−25.91 |
−27.21 ± 2.84 |
| 124039 |
−24.66 |
−25.08 |
−30.09 |
−24.53 ± 1.96 |
| 157144 |
−26.91 |
−30.51 |
−27.58 |
−28.04 ± 2.29 |
| 185552 |
−31.35 |
−34.27 |
−30.93 |
−29.42 ± 2.09 |
| 189404 |
−27.83 |
−30.93 |
−30.51 |
−28.21 ± 2.00 |
| 2222284 |
−27.17 |
−33.44 |
−30.93 |
−27.92 ± 2.46 |
| 445639 |
−20.56 |
−23.82 |
−19.22 |
−22.27 ± 2.17 |
| 3034112 |
−31.35 |
−34.69 |
−31.35 |
−30.76 ± 2.04 |
| 5280343 |
−31.60 |
−33.44 |
−28.84 |
−32.22 ± 3.80 |
| 5280450 |
−21.48 |
−24.66 |
−21.31 |
−23.11 ± 2.29 |
| 6437066 |
−29.92 |
−30.51 |
−28.00 |
−27.54 ± 2.21 |
| 10906239 |
−27.83 |
−32.60 |
−30.09 |
−28.63 ± 2.38 |
| 11334829 |
−25.91 |
−29.67 |
−29.67 |
−28.17 ± 1.50 |
| 12004512 |
−30.93 |
−34.27 |
−30.93 |
−30.34 ± 1.54 |
| 12308714 |
−28.50 |
−34.27 |
−30.51 |
−28.96 ± 2.00 |
| 12313376 |
−29.26 |
−32.18 |
−30.51 |
−29.67 ± 3.05 |
| 16722121 |
−34.19 |
−33.77 |
−32.18 |
−29.63 ± 2.75 |
| 21632833 |
−31.68 |
−35.94 |
−30.51 |
−29.17 ± 1.92 |
The ability of the compounds to bind ACE2 and the spike protein only was also investigated (Table 2). Compound CID 16722121 was found to bind favourably to ACE2 with a binding free energy of −8 kcal mol−1. In addition, compounds CID 185552, 3034112 and 21632833 were found to bind favourably with binding free energies of −8.2, −8.3 and −8.6 kcal mol−1, respectively. It is important to note that when docking calculations were carried out for the spike RBD, only compound CID 16722121 was able to bind favourably with a binding free energy of −7.7 kcal mol−1 (Table 2). These docking results suggest that compound CID 16722121 has the ability to bind to the pocket with strong affinity and not the catalytic site. Due to its multiple binding ability for the spike RBD–ACE2 protein, it was decided that compound CID 16722121 should be investigated further for its unbinding profile at the spike RBD–ACE2 interface. It is worth noting that compound CID 16722121 was identified as azadirachtin H and this name will be used throughout the text.
3.2 WT-MetaD simulation
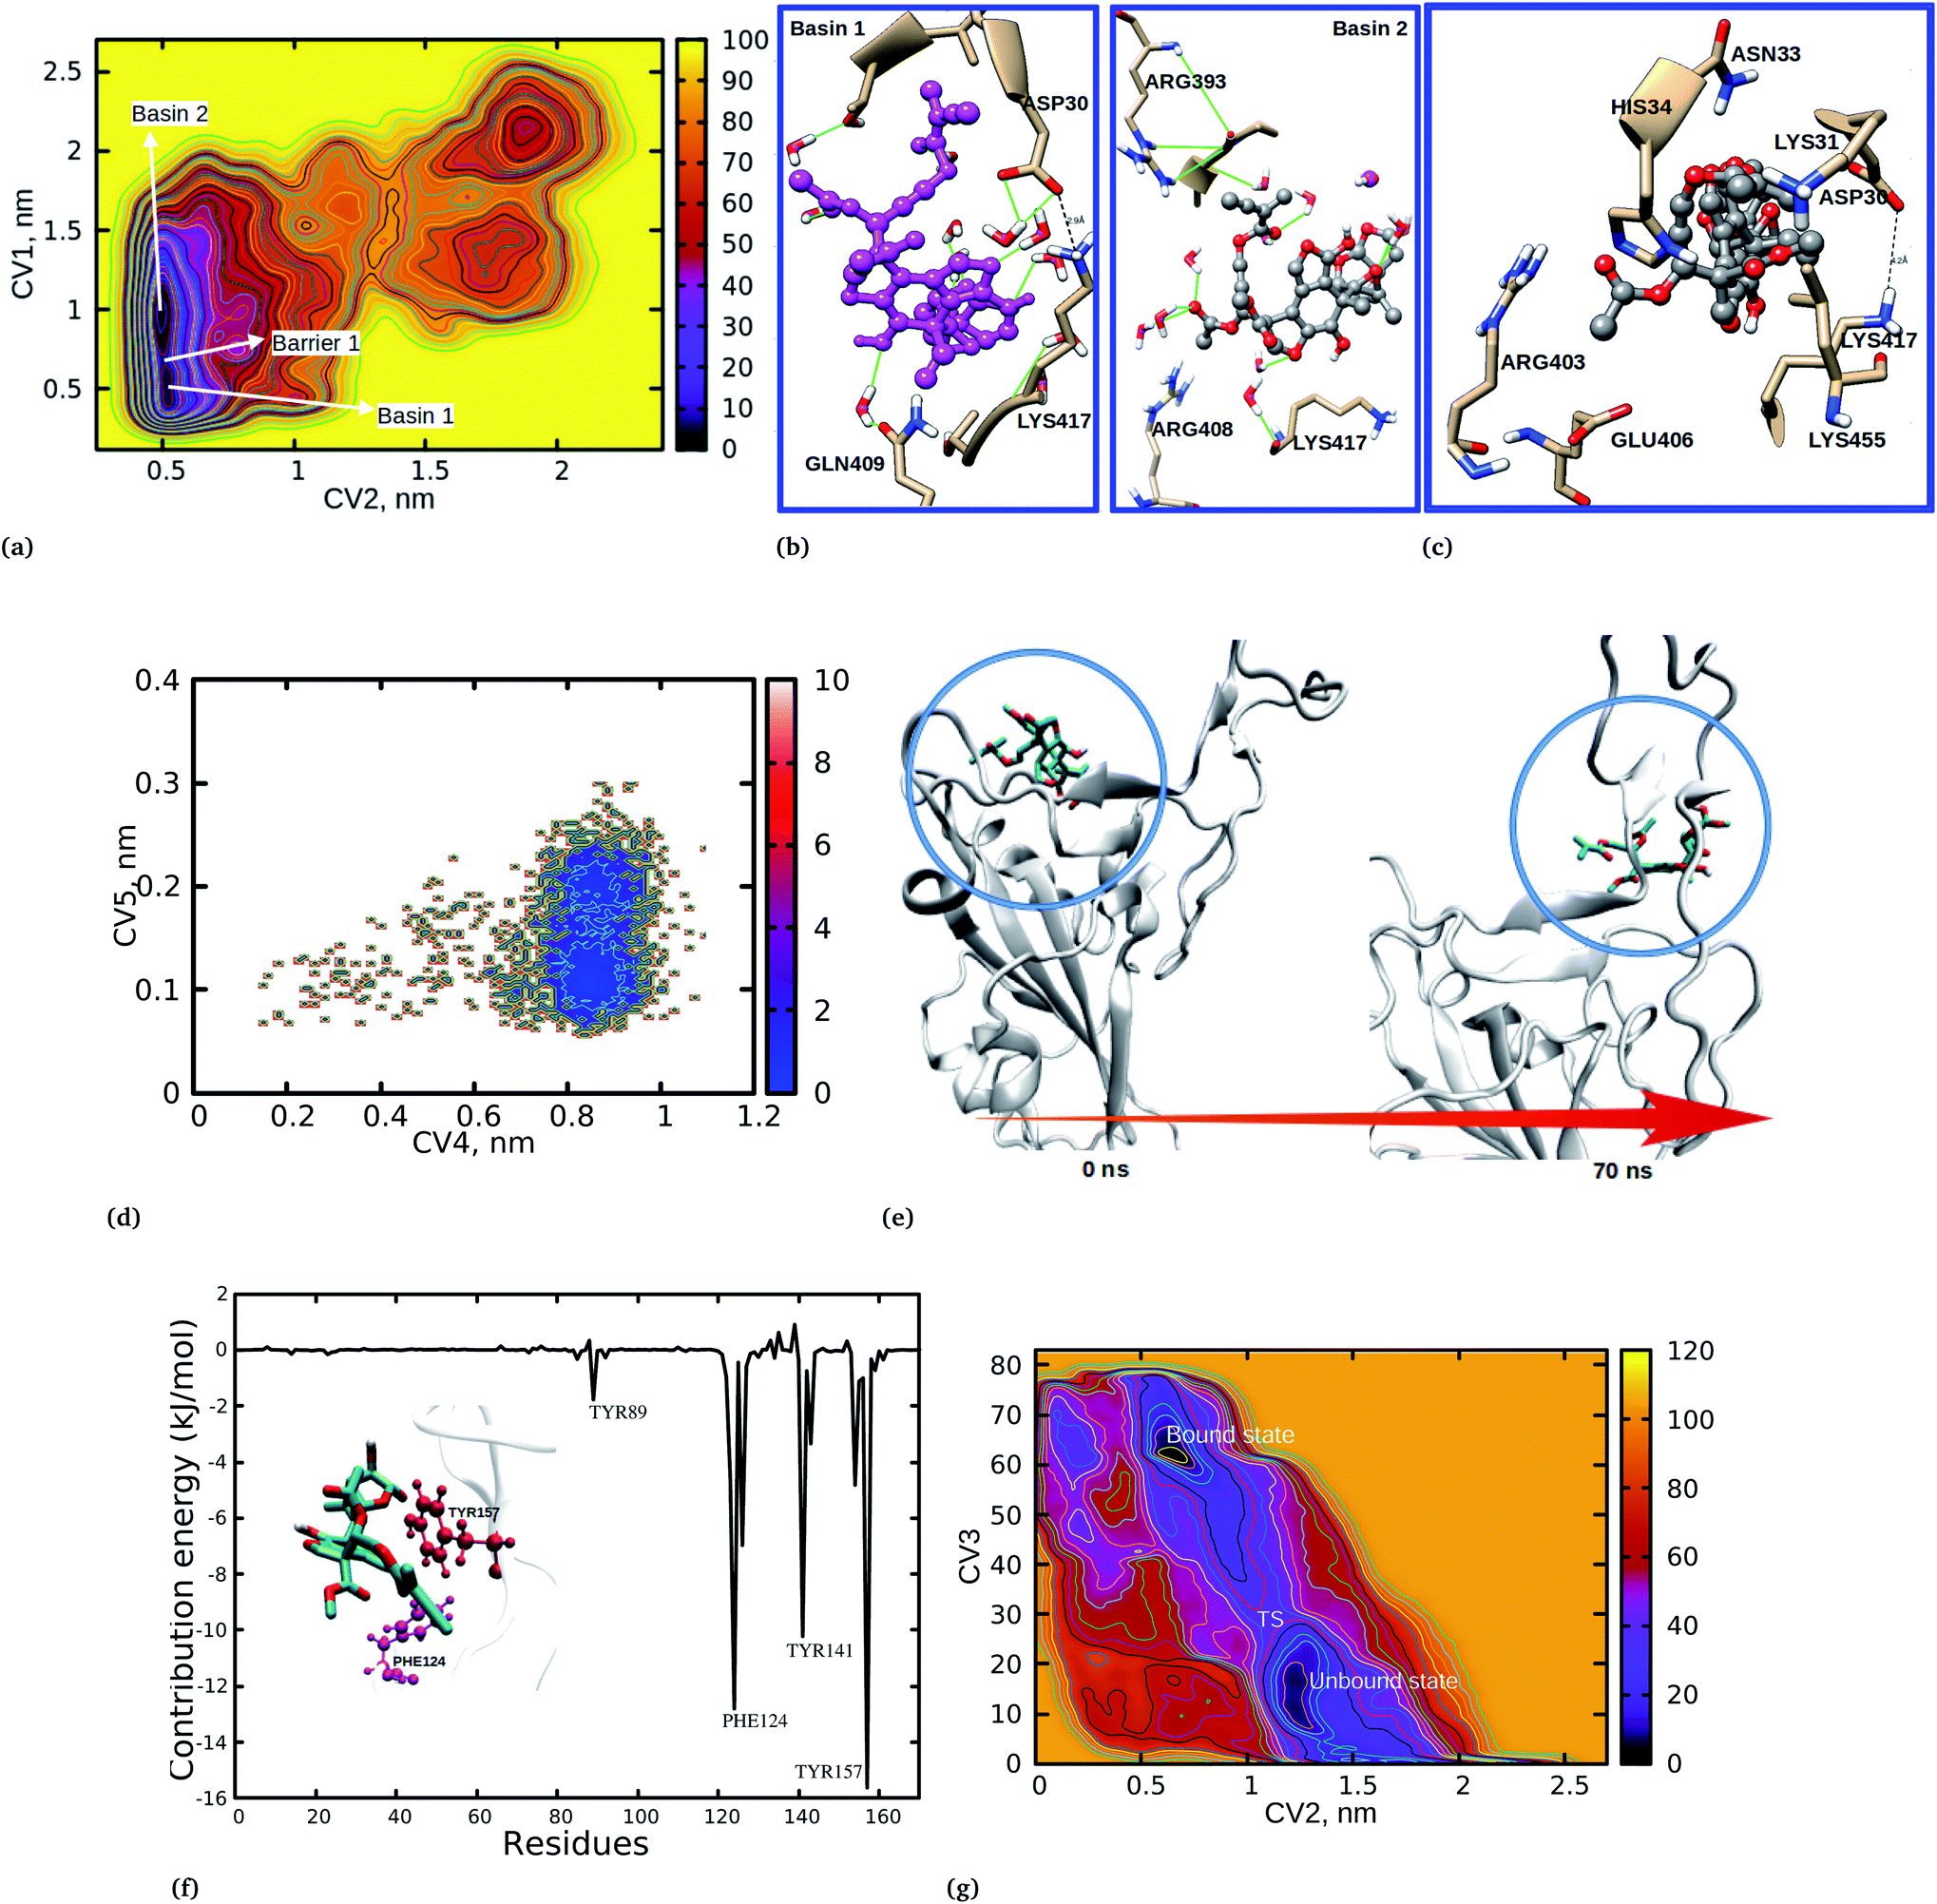
It is important to highlight that the calculation of the free-energy differences of the bound and unbound states of a drug molecule and its receptor is an important factor in determining drug efficacy. We have carried out a WT-MetaD simulation of the spike RBD-SARS-CoV-2 bound with azadirachtin H from docking calculations with a lower binding free energy. It should be noted that docking calculations alone do not sufficiently establish the stability and the related mechanistic pathway of the inhibition of the spike RBD-SARS-CoV-2 by azadirachtin H. Therefore, a complete dynamical study of the complex was performed to shed light on the mechanism of inhibition and the unbinding processes of azadirachtin H. In addition, the orientation of azadirachtin H at the spike RBD-SARS-CoV-2 interface and its ability to disrupt recognition of the viral spike RBD and SARS-CoV-2 were examined. To achieve this, first we considered the center of mass (COM) separation as CV1 to study the protein–protein distances, then we further used the COM separation to study the unbinding process of azadirachtin H from the RBD-SARS-CoV-S interface as CV2 and the coordination number between azadirachtin H and specific residues at the interface as CV3. It is important to mention that, during the WT-MetaD simulation, we first biased two CVs i.e. CV1 and CV2, and later in an independent WT-MetaD run we biased two other CVs i.e. CV2 and CV3 for the two systems: S-RBD–ACE2–ligand and S-RBD–ligand. The 1D free energy surface was generated using well-tempered metadynamics and is presented in Fig. 2.
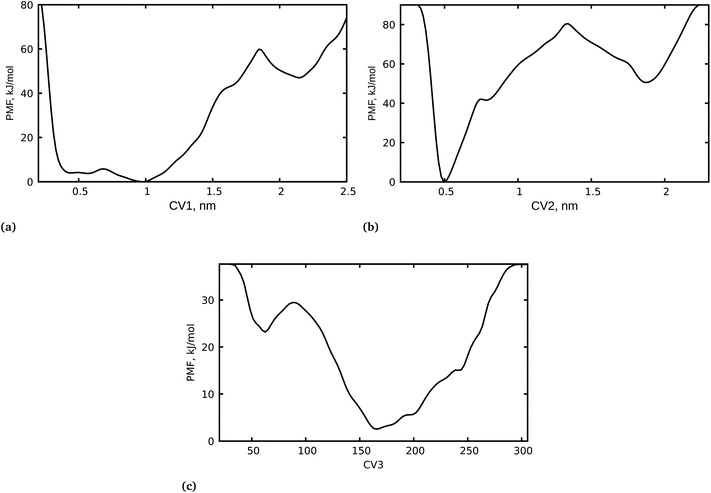 |
| | Fig. 2 1D free energy surfaces for the spike RBD–ACE2–azadirachtin H interactions. (a) COM separation distances between residues LYS417 from S-RBD and ASP30 from hACE2. (b) COM separation distance between azadirachtin H and residue LYS417 (S-RBD) and ASP30 (hACE2). (c) Coordination number between azadirachtin H and specific residues at the interface. | |
3.2.1 WT-MetaD FES convergence. First, we examined the convergence of the metadynamics simulation along the diffusive behavior of CV1, CV2 and CV3 by examining the free energy surface (FES) at different time points (Fig. S2†). The 1D FES profile plotted at different time points for CV1 shows that the FES at 0.5 ns does not grow properly until it reaches 2.5 ns. At 5 ns, the protein–protein separation distance appears to have the lowest energy structure in the well and the system is floating on the free energy flat surface where the protein–protein COM separation distances are 0.5 and 1 nm. The convergence of CV2 and CV3 were also investigated at different time points and were found to be diffusive after 5 ns (Fig S2†). Furthermore, the Gaussian height evolution for CV1–CV2 and CV2–CV3 was also used to assess the convergence of the systems. As shown in Fig. S3,† the systems began accumulating bias at one local minimum, and, as the simulation time progressed, the bias added grew while the Gaussian height progressively decreased. However, in the first 5 to 10 ns the systems escaped the local minima and explored other phase spaces, which restored the Gaussian height to the initial value and it started decreasing again. As the time progressed, the Gaussian height became smaller and the systems diffused with the entire CVs.
3.2.2 Unbinding processes of azadirachtin H. The PMF profile for CV1 shows the protein–protein separation distance with two noticeable minima at 0.5 and 1 nm (Fig. 2a). The minimum at 0.5 corresponds to the spike RBD–ACE2 interaction and recognition, while the distance at 1 nm represents the lack of protein–protein interaction. The PMF at 1 nm is a couple of kJ mol−1 lower than that at 0.5 nm, suggesting that the separation of the two proteins is favoured more than their interaction in the presence of azadirachtin H. On the other hand, the system at state two with PMF at a separation distance of 1 nm requires ≈10 kJ mol−1 to close the barrier to state one with PMF at a distance of 0.5 nm. However, a close observation of minimum one at 0.5 nm and the energy barrier revealed a small energy difference of ≈6 kJ mol−1, which suggests that some interfacial residues can easily cross the barrier and interact with each other.The PMF for the azadirachtin H unbinding process at the interface in Fig. 2b shows a deep minimum at 0.5 nm, suggesting that azadirachtin H remains bound, and it is observed that the bound and unbound states are separated by a barrier of ≈80 kJ mol−1. In other words, azadirachtin H could not easily cross the barrier to the unbound state, which is clearly observed in state two where the unbound state has a higher free energy and a small barrier of ≈38 kJ mol−1, which favours the formation of the bound state. The strong interaction of azadirachtin H at the interface is further supported by the coordination number between azadirachtin H and specific residues at the spike RBD–ACE2 interface. Fig. 2c shows the PMF with two minima with coordination numbers at ≈160 and ≈50. The PMF with the deep minimum corresponds to the higher coordination number, where azadirachtin H is in its bound state, however, the PMF with minimum at a coordination number of ≈50 corresponds to the unbound state, where the protein and azadirachtin H have less contact and interaction.
To provide further insights into the mechanistic pathways for the unbinding and protein–protein separation processes, we have plotted the free energy landscape (FEL) with respect to CV1 and CV2 (Fig. 3a). The FEL shows two basins, 1 and 2, separated with barrier 1, which is the COM protein–protein separation distance. It is observed that when azadirachtin H is in its bound state (basin 1) the protein–protein separation distance (CV1) increased to 1 nm (basin 2). In a similar way, when azadirachtin H is in its unbound state (CV2), the protein–protein separation distance decreased to 0.5 nm.
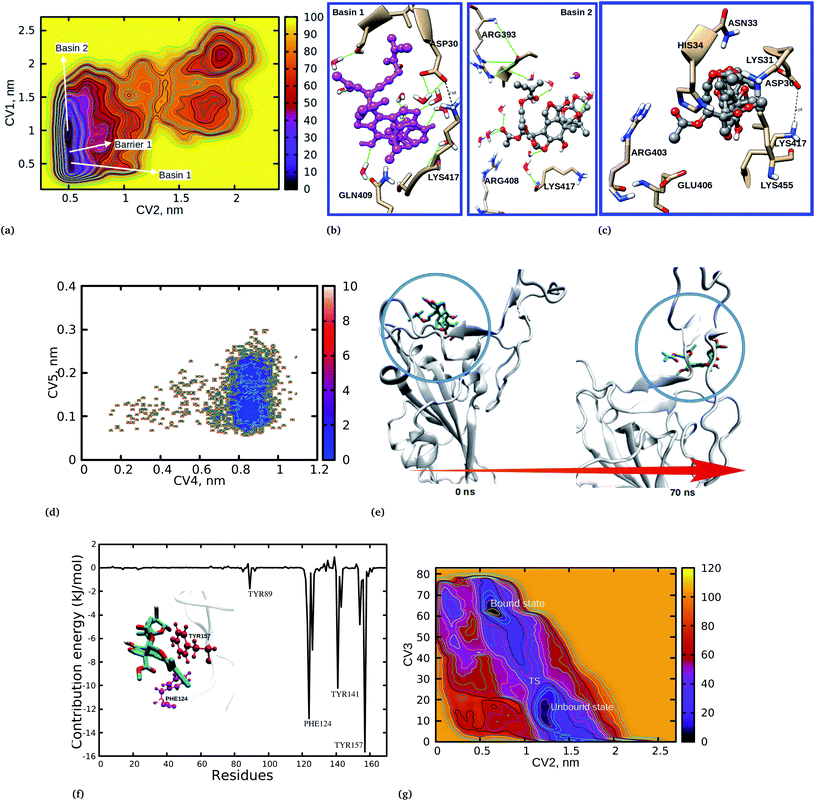 |
| | Fig. 3 (a) 2D FEL for CV1 and CV2, basin 1 corresponds to the protein–protein interaction when azadirachtin H is in its unbound form, basin 2 corresponds to a lack of protein–protein interaction or recognition and at this basin azadirachtin H is in its bound form. The two minima are separated by barrier 1. (b) Snapshots at basin 1 and basin 2 which show the interaction between azadirachtin H and residues at the interface. (c) Binding mode of azadirachtin H to the crystal structure of SARS-COV-2 during molecular docking. (d) 2D free energy for azadirachtin H measured by computing CV4: ligand position RMSD and CV5: ligand RMSD, (e) interaction and unbinding pathway of azadirachtin H from spike RBD during the 100 ns simulation time. (f) MM/PBSA binding free energy decomposition and residue contributions for spike RBD, (g) binding and unbinding profile of azadirachtin H at the spike RBD. | |
The binding and dynamical nature of azadirachtin H at the interface was investigated to reveal the structural orientation and the binding nature of the docked complex was compared to the two basins 1 and 2. It is observed that at basin 1 (Fig. 3b), LYS417 and ASP30 are in close proximity with azadirachtin H and form hydrogen bonds, however, the binding nature of azadirachtin H is different from the observed docking position (Fig. 3c). At this basin, the observed reorientation is stabilized by a bridging water which forms hydrogen bonds between azadirachtin H and residue GLN409. Water is known to stabilize and mediate the interactions between protein–protein and protein-ligand complexes. We have observed that water has the role of stabilizing the interaction between azadirachtin H and residues at the interface. It is worth noting that at basin 2 the molecules have undergone further reorientation and at this state azadirachtin H has a binding mode similar to that observed from the docking position (Fig. 3c). At basin 2, the acetate ethyl group of azadirachtin H orients and becomes exposed to water, where it is stabilized by several hydrogen bonds with water, thereby blocking the recognition between spike RBD and ACE2. Interestingly, at basin 2, due to the reorientation, residue LYS417 is blocked from interacting with ASP30. The observed structural reorientation of azadirachtin H at the spike RBD–ACE2 interface is crucial for its optimal activity and gives an opportunity to establish the mechanistic pathway for viral cell entry inhibition.
The binding preference of azadirachtin H at the interface was studied to gain a better understanding of the inhibition mechanistic pathway. The FEL in Fig. 2 and S2† shows the PMF for the unbinding distance (CV2) of 0.5 nm and the protein–protein separation distance (CV1) of 0.32 nm, suggesting that although azadirachtin H is interacting with residues at the interface, the spike RBD–ACE2 interaction is observed to be the distance of a hydrogen bond. To aid our discussion, a snapshot at coordinates of 0.503, 0.34 was obtained (Fig. S5†). It was observed that azadirachtin H is large in size, hence it is difficult for it to be completely accommodated at the interface; interestingly, we observed that azadirachtin H undergoes further reorientation and interacts preferentially with residues HIS34, ASP30, ASN33 and GLU37 from the ACE2 enzyme. At this point, LYS417 is observed to be close to HIS34 and ASP30 within a hydrogen bond distance of the acetate ethyl groups of azadirachtin H. The acetate ethyl groups and the isoprene unit at the vicinity of ASP30 and LYS417 are responsible for blocking the interaction and recognition between LYS417 and ASP30 by forming strong hydrogen bonds.
The interaction between the ligand and LYS417 from S-RBD has been observed in other studies to be important for the prevention of S-RBD viral cell entry to human cells. Trezza et al.,42 showed that lumacaftor inhibited SARS-COV-2 viral cell entry in silico by interacting and forming hydrogen bonds with LYS417.42 Interestingly, crystal structure analysis of the S-RBD–hACE2 complex reveals that the amino acids involved in the binding of azadirachtin H are key residues for the strong attachment and interaction of S-RBD and hACE2.43 It is important to note that the amino acids LYS417, LEU455 and GLN493 are linked to a higher affinity of spike RBD with ACE2, hence a higher transmissibility rate, and these amino acids are not conserved in SARS-COV.43
The ability of azadirachtin H to bind the virion spike RBD was investigated by the addition of two collective variables; CV4: ligand position RMSD and CV5: ligand RMSD were used to capture details on the azadirachtin H stability and unbinding preference for the spike RBD. The former CV was used to provide information on the relative changes in position from the docking position and the latter was used to assess the stability of the ligand over the 100 ns simulation time. Fig. 3d shows that azadirachtin H changed from its initial docking position to another position and exhibited two binding states. To assist our discussion, in Fig. 3e we show the interaction between azadirachtin H and spike RBD at 0 and 70 ns. At the beginning of the simulation, azadirachtin H bound at the β and α sheets formed by residues TYR121, TYR163, LYS85, ARG71, TYR173 ASN169 and GLU74 (Fig. 3). However, azadirachtin H changed its position and interacted with the loops responsible for the strong interaction with the ACE2 enzyme. The observed changes in the binding position provides an opportunity for COVID-19 treatment as the binding of azadirachtin H at the loops formed by TYR141, TYR157 and GLN161 is involved in the spike RBD and ACE2 interaction.
3.3 MM/PBSA free energy calculations
The observed binding preference at the interface was further confirmed by MM/PBSA free energy decomposition analysis and per-residue contribution. A single trajectory was used, where a MD simulation of the complex was run and 300 snapshots were equally extracted from the equilibrium structure and subjected to MM/PBSA calculations. The energetic contributions to the free energy presented in Table 3 show that vdW energy terms highly contributed to the stability of the complex, followed by non-polar interactions (SASA), while electrostatic energy terms had the least contribution to the interaction. It was observed that the polar solvation energy terms had the opposite effect to the binding free energy. The observed binding free energy of −129 kJ mol−1 suggested that a strong interaction supported the observed dominant distance at 0.5 nm for the unbinding process. As expected, the energy decomposition and contribution of the residues to the binding free energy revealed that many residues from ACE2 significantly contributed to the interaction energy, as shown in Fig. 3. This findings corroborates the observed binding interaction from the WT-MetaD simulation and docking calculations, where azadirachtin H interacted more with residues from ACE2 and had higher affinity with ACE2 compared to S-RBD. Surprisingly, the binding free energy of azadirachtin H to the spike RBD alone was observed to be higher than when complexed with human ACE2. Table 3 shows that azadirachtin H had a binding free energy of −152.64 kJ mol−1 compared to −129.73 kJ mol−1 when bound to the spike RBD–ACE2 complex. This results suggests that azadirachtin H may have a strong affinity with the spike RBD, thereby preventing fusion with human cells. On the other hand, azadirachtin H may specifically target the virus and binds strongly before it invades human cells. The free energy decomposition shown in Fig. 3f shows that three residues, PHE124, TYR141 and TYR157, contributed highly to the interaction and hence the stability. We also observed a slight different between the docking results and the MM/PBSA calculations. For example, the binding free energy for the spike S-RBD is in the order of 2 kJ mol−1 less than that at the S-RBD–ACE2 complex from the docking results. The MM/PBSA results shows that the binding of azadirachtin H to S-RBD has a higher value than that at the interface in the order of 23 kJ mol−1. However, there was good agreement between MM/PBSA and WT-MetaD. The observed difference is attributed to the limitations of the docking algorithms which suffer from accommodating full receptor flexibility. It is important also to mention that, although the entropic energy term calculation is challenging and is missing in our results, its contribution has been reported to be small and would have resulted in a larger magnitude of error as compared to other energy terms.32 The missing entropic terms would not have significantly affected the observed relative binding affinity.
Table 3 Relative binding free energy (kJ mol−1) calculated by the MM/PBSA method for the interaction between azadirachtin H and the S-RBD–ACE2 and S-RBD
| System |
EvdW |
Eele |
Epolar |
Enon-polar |
ΔGbind |
| S-RBD–ACE2 |
−164 ± 22 |
−16 ± 6 |
85 ± 13 |
−33 ± 3 |
−129 ± 19 |
| S-RBD |
−167 ± 28 |
−12 ± 5 |
63 ± 15 |
−35 ± 5 |
−152 ± 29 |
Close examination of CV4 revealed that azadirachtin H did not return to its original docking position, which implies that positions obtained from the docking calculations do not necessarily reflect the stability of the complex. Due to the sampling limitations of classical MD simulations, we performed WT-MetaD simulations to explain the observed changes in the binding position and the kinetics of azadirachtin H interacting with S-RBD. The last configuration from the MD simulation was used as the initial configuration for WT-MetaD. Fig. 3g shows the 2D plot for CV2 and CV3 for the unbinding profiles of azadirachtin H. It is observed that the PMF shows two minima at ≈0.55 nm for CV2 and 65 nm for CV3, which indicates the binding of azadirachtin H, and 1.2 nm for CV2 and 20 nm for CV3, which indicates the unbinding of azadirachtin H. The two minima are separated by a transition state (TS). The PMF for the binding process at ≈0.55 nm is more stable when compared to the unbound form (Fig. 3g). As observed from the classical MD simulation and MM/PBSA free energy, azadirachtin H has a strong affinity with the spike RBD, which is a means of weakening and blocking its entry into the human cell.
3.4 Pharmacokinetic profiles of the neem tree extracts
One of the major reasons for the clinical failure and limitations of many drug candidates is their poor pharmacokinetic and pharmacodynamic properties. Many drugs are often banned during early or late phases of clinical trials, and some drugs are banned after their introduction to the market, which causes a big burden to pharmaceutical companies. One of the major challenges in traditional drug design and development is that properties such absorption, distribution, metabolism, excretion and toxicity (ADME/T) are studied during the development phase, when instead they should be investigated prior to the development or clinical trial phases. Human intestinal absorption (HIA) is one of the major factors which determines drug bioavailability. In this work, HIA, human oral bioavailability (HOA), blood brain barrier (BBB) and caco-2 permeability were investigated for azadirachtin H and other compounds shown in Fig. 1b. First, the percentage absorption was calculated using eqn (9).44| | |
AB% = 109 − (0.345 × TPSA)
| (9) |
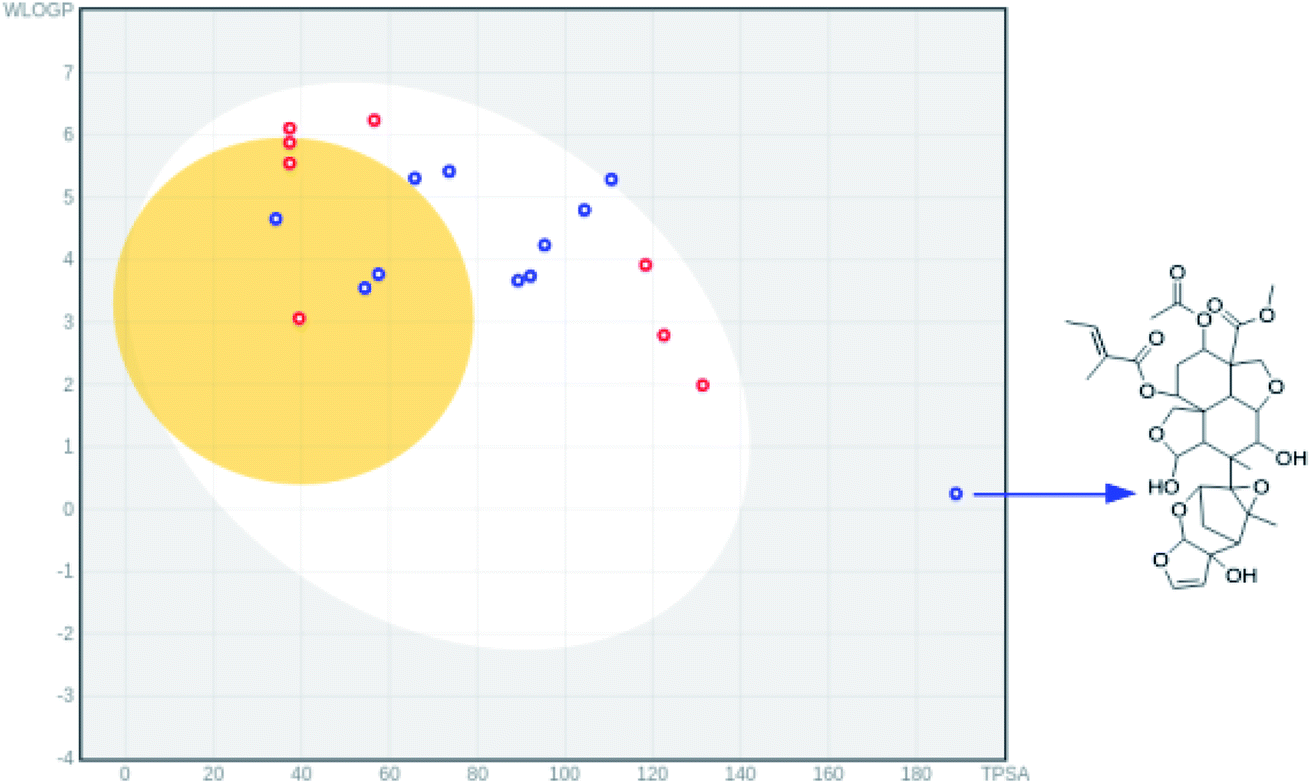
In the HIA model, if a compound possess a HIA of less than 30% is predicted to be HIA.45 The calculated percentage absorption for azadirachtin H was found to be 43.8% and the predicted probability was found to be 0.82 (Table 4) indicating good HIA. To capture more detail on HIA and BBB permeability, the boiled egg model46 implemented in the swissadmet tool34 which computes the lipophilicity and polarity of small molecules, was used. In Fig. 4. we show that all compounds except for azadirachtin H were found in the egg yolk or white, indicating good gastrointestinal absorption. Due to its structural complexity, azadirachtin H had a large topological polar surface area (TPSA) of 189 Å2 and is observed to be outside the egg, however, it still has a reasonable HIA of 43.8%. The predicted value of 0.6 for HOA indicates the negative oral bioavailability of azadirachtin H; this problem could be addressed by using a nanodelivery system to carry and deliver azadirachtin H to the targeted cells. The compound was predicted to cross the BBB with a probability of 0.87, however, it was predicted not to penetrate human colon adenocarcinoma (caco-2-), with a caco-2 permeability of 0.83 cm s−1. Very interestingly, margocin was predicted to possess excellent HIA and HOA; the % AB was found to be 97.24, which was two-fold higher than that of azadirachtin H (Table 4). Margocin was also predicted to cross the BBB, as well as having caco-2 permeability. These predicted properties of margocin are related to its small TPSA value as compared to that of azadirachtin H. The solubility (LogS) profiles of the selected compounds were further evaluated using the swissadmet tool.34 The LogS scale, insoluble <−10 < poorly soluble < −6 < moderately soluble < −4 < soluble < −2 very soluble < 0 < highly soluble, was used to estimate the solubility of the compounds. As presented in Table 4, quercetin and azadirachtin H possessed desirable solubility properties, however, margocin exhibited moderate solubility. The observed binding stability and suitable pharmacodynamic properties of the selected neem tree extracts suggests that they are potential candidates towards the development of potential anti-SARS-COV-2 treatments.
Table 4 Pharmacodynamic profiles of the selected compounds
| Name/CID |
HIA |
HOA |
BBB |
LogS |
Caco-2 permeability |
TPSA Å2 |
%AB |
| Margocin/21632833 |
1 |
0.54 |
0.96 |
−5.21 |
0.73 |
34.1 |
97.24 |
| Quercetin/5280343 |
0.98 |
0.54 |
0.54 |
−2.99 |
0.64 |
127 |
65.19 |
| Azadirachtin H/16722121 |
0.82 |
0.60 |
0.87 |
−3.84 |
0.83 |
189 |
43.8 |
 |
| | Fig. 4 Boiled egg model for HIA showing the range of compound distribution; compounds located in the yolk are predicted to passively permeate through the BBB, compounds located in the egg white are predicted to be passively absorbed by the gastrointestinal tract. Red dots indicate compounds predicted not to be effluated from the central nervous system by P-glycoprotein (P-gp), while blue dots indicate compounds predicted to be effluated from the central nervous system by P-gp. | |
4 Conclusion
The outbreak of COVID-19 has caused thousands of deaths worldwide. The higher transmissibility rate of the disease is associated with strong virion S-RBD attachment to the hACE2 enzyme before entering the host cell. The inhibition of viral cell entry using natural products is an important approach towards managing the disease and controlling the disease. In this study, bioactive compounds from the neem tree were investigated for their ability to treat and block viral cell entry using a combination of in silico approaches. Natural products with structural diversity were found to be promising blockers of viral cell entry. During WT-MetaD, azadirachtin H was found to adopt several structural orientations, thereby inhibiting the interaction and recognition of the virus with hACE2 at the interface. Binding free energy based on MM/PBSA suggested the stronger interaction of azadirachtin H with S-RBD as compared to the S-RBD–ACE2 complex. The reported compound(s) may serve as a starting point towards developing an effective SARS-COV-2 viral cell entry inhibitor.
Funding
This work was supported by the University of Dodoma through the SAS platform.
Conflicts of interest
The authors declare no conflicting interests.
Acknowledgements
DMS acknowledge CHPC Lengau, South Africa, for access to the HPC computing facility.
References
- S. Gangadevi, V. N. Badavath, A. Thakur, N. Yin, S. De Jonghe, O. Acevedo, D. Jochmans, P. Leyssen, K. Wang and J. Neyts, et al., J. Phys. Chem. Lett., 2021, 12, 1793–1802 CrossRef CAS PubMed.
- R. Subapriya and S. Nagini, Curr. Med. Chem.: Anti-Cancer Agents, 2005, 5, 149–156 CrossRef CAS PubMed.
- N. Baildya, A. A. Khan, N. N. Ghosh, T. Dutta and A. P. Chattopadhyay, J. Mol. Struct., 2021, 1227, 129390 CrossRef CAS PubMed.
- A. Sethi, S. Sanam, S. Munagalasetty, S. Jayanthi and M. Alvala, RSC Adv., 2020, 10, 29873–29884 RSC.
- S. Ghosh, K. Jana and B. Ganguly, Phys. Chem. Chem. Phys., 2019, 21, 13578–13589 RSC.
- A. da Silva Antonio, L. S. M. Wiedemann and V. F. Veiga-Junior, RSC Adv., 2020, 10, 23379–23393 RSC.
- M. Boozari and H. Hosseinzadeh, Phytother. Res., 2020, 35(2), 864–876 CrossRef PubMed.
- S. M. Thota, V. Balan and V. Sivaramakrishnan, Phytother. Res., 2020, 34, 3148–3167 CrossRef CAS PubMed.
- G. Williamson and A. Kerimi, Biochem. Pharmacol., 2020, 114123 CrossRef CAS PubMed.
- Y. S. Wijayasinghe, P. Bhansali, R. E. Viola, M. A. Kamal and N. K. Poddar, Curr. Pharm. Des., 2021, 27, 1–25 CrossRef PubMed.
- J. Hoult and M. Payá, Gen. Pharmacol., 1996, 27, 713–722 CrossRef CAS PubMed.
- R. R. Narkhede, A. V. Pise, R. S. Cheke and S. D. Shinde, Nat. Prod. Bioprospect., 2020, 10, 297–306 CrossRef CAS PubMed.
- A. M. Sayed, H. A. Alhadrami, A. O. El-Gendy, Y. I. Shamikh, L. Belbahri, H. M. Hassan, U. R. Abdelmohsen and M. E. Rateb, Microorganisms, 2020, 8, 970 CrossRef CAS PubMed.
- M. A. Ibrahim, K. A. Abdeljawaad, A. H. Abdelrahman and M.-E. F. Hegazy, J. Biomol. Struct. Dyn., 2020, 1–13 CAS.
- C. García-Iriepa, C. Hognon, A. Francés-Monerris, I. Iriepa, T. Miclot, G. Barone, A. Monari and M. Marazzi, J. Phys. Chem. Lett., 2020, 11, 9272–9281 CrossRef PubMed.
- Y. Han and P. Král, ACS Nano, 2020, 14, 5143–5147 CrossRef CAS PubMed.
- D. Schütz, Y. B. Ruiz-Blanco, J. Münch, F. Kirchhoff, E. Sanchez-Garcia and J. A. Müller, Adv. Drug Delivery Rev., 2020, 167, 47–65 CrossRef PubMed.
- M. S. Baig, M. Alagumuthu, S. Rajpoot and U. Saqib, Drugs R&D, 2020, 20, 161–169 CrossRef CAS PubMed.
- Q. Wang, Y. Zhang, L. Wu, S. Niu, C. Song, Z. Zhang, G. Lu, C. Qiao, Y. Hu and K.-Y. Yuen, et al., Cell, 2020, 181(4), 894–904 CrossRef CAS PubMed.
- S. K. Burley, H. M. Berman, C. Bhikadiya, C. Bi, L. Chen, L. Di Costanzo, C. Christie, K. Dalenberg, J. M. Duarte and S. Dutta, et al., Nucleic Acids Res., 2019, 47, D464–D474 CrossRef CAS PubMed.
- N. M. O’Boyle, M. Banck, C. A. James, C. Morley, T. Vandermeersch and G. R. Hutchison, J. Cheminf., 2011, 3, 33 Search PubMed.
- S. Kim, P. A. Thiessen, E. E. Bolton, J. Chen, G. Fu, A. Gindulyte, L. Han, J. He, S. He and B. A. Shoemaker, et al., Nucleic Acids Res., 2016, 44, D1202–D1213 CrossRef CAS PubMed.
- J. Gasteiger and M. Marsili, Tetrahedron, 1980, 36, 3219–3228 CrossRef CAS.
- D. M. Shadrack, H. S. Swai and A. Hassanali, J. Mol. Graphics Modell., 2020, 96, 107510 CrossRef CAS PubMed.
- D. M. Shadrack, G. Deogratias, L. W. Kiruri, H. S. Swai, J.-M. Vianney and S. S. Nyandoro, J. Mol. Graphics Modell., 2021, 107871 CrossRef CAS PubMed.
- M. Abraham, D. Spoel, E. Lindahl, B. Hess and T. Team, GROMACS user manual version 2018, 2018 Search PubMed.
- H. W. Horn, W. C. Swope, J. W. Pitera, J. D. Madura, T. J. Dick, G. L. Hura and T. Head-Gordon, J. Chem. Phys., 2004, 120, 9665–9678 CrossRef CAS PubMed.
- G. Bussi, D. Donadio and M. Parrinello, J. Chem. Phys., 2007, 126, 014101 CrossRef PubMed.
- M. Parrinello and A. Rahman, J. Appl. Phys., 1981, 52, 7182–7190 CrossRef CAS.
- U. Essmann, L. Perera, M. L. Berkowitz, T. Darden, H. Lee and L. G. Pedersen, J. Chem. Phys., 1995, 103, 8577–8593 CrossRef CAS.
- B. Hess, H. Bekker, H. J. Berendsen and J. G. Fraaije, J. Comput. Chem., 1997, 18, 1463–1472 CrossRef CAS.
- R. Kumari, R. Kumar, O. S. D. D. Consortium and A. Lynn, J. Chem. Inf. Model., 2014, 54, 1951–1962 CrossRef CAS PubMed.
- A. Barducci, G. Bussi and M. Parrinello, Phys. Rev. Lett., 2008, 100, 020603 CrossRef PubMed.
- A. Daina, O. Michielin and V. Zoete, Sci. Rep., 2017, 7, 42717 CrossRef PubMed.
- C. A. Lipinski, Drug Discovery Today: Technol., 2004, 1, 337–341 CrossRef CAS PubMed.
- F. Cheng, W. Li, Y. Zhou, J. Shen, Z. Wu, G. Liu, P. W. Lee and Y. Tang, admetSAR: a comprehensive source and free tool for assessment of chemical ADMET properties, 2012 Search PubMed.
- J. Lu and P. D. Sun, J. Biol. Chem., 2020, 295, 18579–18588 CrossRef CAS PubMed.
- M. Calcagnile, P. Forgez, A. Iannelli, C. Bucci, M. Alifano and P. Alifano, Biochimie, 2021, 180, 143–148 CrossRef CAS PubMed.
- B. Adhikari, B. P. Marasini, B. Rayamajhee, B. R. Bhattarai, G. Lamichhane, K. Khadayat, A. Adhikari, S. Khanal and N. Parajuli, Phytother. Res., 2020 DOI:10.1002/ptr.6893.
- P. Bellavite and A. Donzelli, Antioxidants, 2020, 9, 742 CrossRef CAS PubMed.
- R. M. L. Colunga Biancatelli, M. Berrill, J. D. Catravas and P. E. Marik, Front. Immunol., 2020, 11, 1451 CrossRef PubMed.
- A. Trezza, D. Iovinelli, A. Santucci, F. Prischi and O. Spiga, Sci. Rep., 2020, 10, 13866 CrossRef CAS PubMed.
- R. Yan, Y. Zhang, Y. Li, L. Xia, Y. Guo and Q. Zhou, Science, 2020, 367, 1444–1448 CrossRef CAS PubMed.
- D. Bhowmik, R. D. Sharma, A. Prakash and D. Kumar, J. Mol. Struct., 2021, 130094 CrossRef CAS PubMed.
- J. Shen, F. Cheng, Y. Xu, W. Li and Y. Tang, J. Chem. Inf. Model., 2010, 50, 1034–1041 CrossRef CAS PubMed.
- A. Daina and V. Zoete, ChemMedChem, 2016, 11, 1117 CrossRef CAS PubMed.
Footnotes |
| † Electronic supplementary information (ESI) available. See DOI: 10.1039/d1ra04197e |
| ‡ These authors conceived and designed the experiments. DMS performed all experiments and drafted the manuscript and all authors wrote and reviewed the manuscript. |
|
| This journal is © The Royal Society of Chemistry 2021 |

 Open Access Article
 This Open Access Article is licensed under a Creative Commons Attribution-Non Commercial 3.0 Unported Licence
 *a,
Said A. H. Vuai‡b,
Mtabazi G. Sahini
*a,
Said A. H. Vuai‡b,
Mtabazi G. Sahini
 , called collective variables (CVs). This potential is built as a sum of the Gaussian kernels (height (W) and width (δi)) deposited along the trajectory in the CVs space.