 Open Access Article
Deciphering the interaction of flavones with calf thymus DNA and octamer DNA sequence (CCAATTGG)2†
Shailendra Kumar and
Maya S. Nair *
*
Department of Biosciences and Bioengineering, Indian Institute of Technology Roorkee, Roorkee, Uttarakhand-247667, India. E-mail: maya.nair@bt.iitr.ac.in; mayasfbt@iitr.ac.in; Fax: +91-1332-273560; Tel: +91-1332-285790
First published on 1st September 2021
Abstract
We investigated the interaction of three flavone compounds, baicalein, chrysin and flavone with calf thymus DNA and octamer DNA sequence (CCAATTGG)2. The binding mechanisms of the flavone compounds with both DNA were unveiled using biophysical, thermodynamic and molecular modelling techniques. Absorption and fluorescence titrations confirm the formation of the DNA complexes along with the extent of interaction. Absorption data proposed an intercalation mode of binding. Fluorescence displacement assays using ethidium bromide and Hoechst 33258 data supports a partial intercalation. Potassium iodide quenching substantiated this finding. Circular dichroism data revealed major structural changes on binding with flavones which can arise from intercalation partially or in a tilted arrangement. Analysis of the effect of ionic strength on complex formation eliminated the role of electrostatic interaction in the binding. Differential scanning calorimetric data showed substantial changes in the melting temperatures of complexes and predicted the DNA–baicalein complex as the most stable one. Molecular modelling showcased that the complexes are located near the AT rich region. Docking analysis with different sequences showed that the flavone compounds intercalated with base pairs only with d(CGATCG)2.
1. Introduction
Small molecule–DNA interaction is an exciting research area that resulted in the identification of many therapeutic molecules. Many anticancer and antitumor drug molecules find DNA as the primary target. Different therapeutic agents' mode of action discovers them either as intercalator or groove binding molecules.1–6Several anticancer agents bind to DNA intercalatively causing structural perturbations in DNA, thereby restricting the DNA from binding to its respective targets.7 Groove binding molecules do not produce significant distortions in the DNA structure but can inhibit binding to many proteins, thereby blocking many cellular processes.1,8,9 Knowledge about the small molecule interaction mechanism with DNA can enlighten the strategy for designing compounds with better binding efficacy and pharmacological potential.
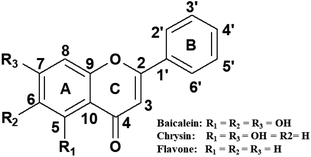
Many molecules derived from natural products are being used as drugs and many naturally available compounds are potential therapeutic agents.10–12 Flavones, a class of flavonoids possessing pharmacological values, are secondary metabolites in plants. Flavones are distinguished by the number and position of the hydroxyl group on the phenyl rings (Fig. 1). The simplest compound in this class is flavone. Baicalein and chrysin are two other molecules in this subgroup of flavonoids.13 Baicalein, chrysin and flavone are known to possess various biological and pharmaceutical functions such as anti-inflammatory, antimicrobial, antiviral, anticancer and radical scavenging activities, as evidenced from several studies reported.14–20 These properties can be attributed to their association with different macromolecules, viz, proteins, enzymes and nucleic acids, available in the cell. Among these, nucleic acids are one of the primary targets. Studies on flavone–DNA interaction have been reported by many researchers and are of great research interest.
Structure–activity relationship studies on baicalein, chrysin and wogonin with calf thymus DNA (CT DNA) showed that the three flavones intercalate between the DNA base pairs.13,21,22 Another report suggests that baicalein can detect DNA at a concentration level of 4.1 × 10⁻⁸ g ml−1 and binds to DNA in a groove binding style.23 Interaction studies of baicalein, wogonin and baicalin with fish sperm DNA revealed the intercalation mode of binding.24 Vitorino et al.13 reported the interaction of flavone and a few hydroxy flavones with CT DNA and found the compounds intercalated into the DNA double helix. These studies, therefore, put forth different modes of interaction between flavones with DNA. Consequently, it is interesting to revisit the interaction of few flavone compounds with DNA.
The present study investigates the interaction of CT DNA and an octamer DNA sequence d(CCAATTGG)2 with baicalein, chrysin and flavone using absorption, fluorescence, circular dichroism and thermal studies through differential scanning calorimetry. An attempt has been made to explore the binding coefficients, binding mode and binding affinities of these compounds with both forms of DNA. CT DNA was a model DNA with many base pairs and no sequence specificity. The octamer sequence d(CCAATTGG)2 was chosen as the CCAATTGG motif is widely present in the promoter region of human, fly and rat genomes responsible for controlling the regulatory pathways of many growth factors, tumour suppressor genes and oncogenes.25–27 CCAAT sequence is also present in the promoter region of many oncogenes.28–30 Therefore, the interaction of the flavone compounds with this sequence can shed light on the compounds' sequence-specific binding.
2. Materials and methods
Calf thymus DNA, oligonucleotide sequence CCAATTGG, baicalein, chrysin, flavone, ethidium bromide, Hoechst 33258 were procured from Sigma Aldrich Co., USA. The DNA samples were prepared in 20 mM sodium phosphate buffer containing 0.2 mM EDTA and 10 mM sodium chloride at pH 7. The oligonucleotide sequence was heated at 95 °C for 5 minutes and left at room temperature for the proper annealing. Baicalein was dissolved in dimethyl sulfoxide, chrysin and flavone were dissolved in methanol. The concentrations of d(CCAATTGG)2 DNA sequence (molar extinction coefficient ε = 76![[thin space (1/6-em)]](https://www.rsc.org/images/entities/char_2009.gif) 300 M−1 cm−1) and calf thymus DNA (ε = 6600 M−1 cm−1) were determined spectrophotometrically. Dilutions were made in the buffer. Other chemicals used were of analytical grade, and Millipore water was used.
300 M−1 cm−1) and calf thymus DNA (ε = 6600 M−1 cm−1) were determined spectrophotometrically. Dilutions were made in the buffer. Other chemicals used were of analytical grade, and Millipore water was used.
2.1 Absorption studies
Absorption experiments were done using a CARY 60 spectrophotometer (Agilent Technologies). Spectra were recorded from 200 to 800 nm using a 1 cm pathlength quartz cuvette. 20 μM solutions of flavone compounds were titrated with increasing DNA concentrations to get different ratios R (DNA to flavones, N/D = R). The baseline subtraction was done to correct the background with the appropriate buffer solution. Binding coefficient Kb was calculated using Scatchard equation and described in Section 3.1.2.2.2 Fluorescence studies
Fluorescence measurements were carried out on a FluoroMax plus spectrofluorometer (Horiba Scientific, USA). DNA solutions were gradually added in steps to a 20 μM flavones solution at room temperature. Spectra were recorded with excitation wavelengths set at 336 nm, 326 nm and 302 nm for baicalein, chrysin and flavone, respectively and emission spectra were scanned from 320 to 650 nm. Excitation and emission slits were kept at 5 nm. Emission intensities were corrected for absorption of the excitation light and re-absorption of the emitted light to decrease the inner filter effect.2.3 Competitive displacement assay
This method is helpful to determine the binding mode between DNA and small molecules. A solution containing 1 μM of EtBr or Hoechst 33258 and 20 μM of DNA concentration was titrated with increasing flavones concentrations (0–50 μM) in displacement assay. The EtBr–DNA complex was excited at 476 nm and emission spectra were recorded from 500 nm to 750 nm. For the Hoechst–DNA system, excitation was set at 343 nm, and emission was monitored from 350 to 650 nm.2.4 Quenching studies
Fluorescence quenching studies were performed with the anionic quencher potassium iodide (KI) in the absence and presence of d(CCAATTGG)2 and CT DNA. Experiments were conducted with 20 μM concentration of flavones and 40 μM of DNA. Fluorescence intensities of flavones were monitored by changing the concentration of KI (0–13 mM). Data were plotted with relative fluorescence intensity (F0/F) versus KI. Fluorescence quenching constants (Ksv) were deduced from the Stern–Volmer quenching equation,where F0 and F are the fluorescence intensities in the absence and presence of quencher, [Q], the quencher concentration, and Ksv is the quenching constant.
2.5 Effect of ionic strength
The effect of ionic strength on the DNA–flavone complexes was evaluated by monitoring the variations in fluorescence intensities of flavone compounds with different concentrations of sodium chloride (0–60 mM). Concentrations of DNA and flavones were kept at 20 μM.2.6 Circular dichroism (CD) studies
CD spectra were recorded in the wavelength range 200 to 700 nm using a JASCO CD spectrometer (J-1500) with a scan rate of 100 nm min−1 (Applied Photophysics, Leatherhead, UK). A 1 cm pathlength cell was used, and the bandwidth was kept at 1 nm. Concentrations of d(CCAATTGG)2 and CT DNA were held at 20 μM and 50 μM, respectively. Flavones were added gradually in various D/![[N with combining low line]](https://www.rsc.org/images/entities/char_004e_0332.gif) (flavones/DNA) ratios at 25 °C. The final CD spectra were the average of three scans, and the baseline was subtracted. All CD spectra were analyzed using the inbuilt software.
(flavones/DNA) ratios at 25 °C. The final CD spectra were the average of three scans, and the baseline was subtracted. All CD spectra were analyzed using the inbuilt software.
2.7 Differential scanning calorimetry (DSC) studies
DSC experiments were performed on a Micro Cal VP-DSC (Northampton, MA, USA). Thermal transitions from folded to the denatured state were monitored using excess heat capacity as a function of temperature. DNA samples were prepared in sodium phosphate buffer. Samples were scanned from 20 °C to 120 °C with a scan rate of 60 °C h−1 at constant pressure ∼33 psi. A 100 μM of d(CCAATTGG)2 or 300 μM free CT DNA was loaded in the sample cell and scanned to get a thermal profile for free DNA. Thermal profiles of bound forms were collected at D/N = 1. Buffer baseline was subtracted and thermograms were analyzed using the inbuilt Origin 7.1 software. Thermal profiles were fitted with a non-two-state curve fitting model.2.8 Molecular docking studies
Molecular docking studies were done using Autodock 4.2 with MGL tools31 to delineate the interaction between DNA and flavone compound. DNA structures d(CCAATTGG)2 sequence (PDB ID:1JTL) and B-DNA dodecamer d(CGCGAATTCGCG)2 (PDB ID:1BNA) were obtained from the Protein Data Bank (http://www.rcsb.org./pdb). PDB structure of 1JTL was modified to get the octamer structure. Structure data files (sdf) of flavones were converted into PDB format using Open Babel.32 The grid boxes were prepared for octamer and dodecamer DNA with 49 × 57 × 63 and 61 × 53 × 115 number of grid points in x × y × z directions, and with a grid spacing of 0.375 Å respectively. The Lamarckian genetic algorithm was employed for docking calculations with 100 runs. Default values were used for all other parameters. The lowest energy docked conformation was selected and PyMol software was used to visualize the docked poses.333. Result and discussion
3.1 Absorption studies
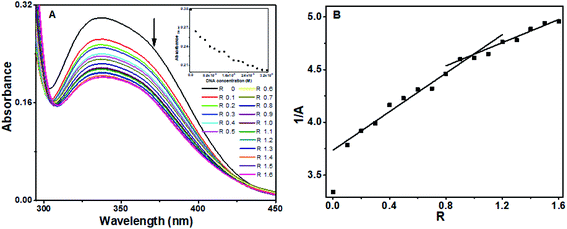
Absorption spectroscopy is a convenient and simple method to probe the binding of small molecules to DNA. Interaction of flavone compounds, baicalein, chrysin and flavone with CT DNA and an octamer promoter region sequence d(CCAATTGG)2 were studied. All three flavone compounds showed absorption bands in the 200–450 nm range (ESI Fig. 1†). Band I in the 300–450 nm range is attributed to the n–π* transition in the B ring and band II in the 240–280 nm range is related to the π–π* transition in ring A.24,34 The highest wavelength was used for analysis to minimize the overlap from DNA absorption.![[thin space (1/6-em)]](https://www.rsc.org/images/entities/char_2009.gif) :
:![[thin space (1/6-em)]](https://www.rsc.org/images/entities/char_2009.gif) baicalein stoichiometry of 1
baicalein stoichiometry of 1![[thin space (1/6-em)]](https://www.rsc.org/images/entities/char_2009.gif) :
:![[thin space (1/6-em)]](https://www.rsc.org/images/entities/char_2009.gif) 1 in the solution.35,36
1 in the solution.35,36
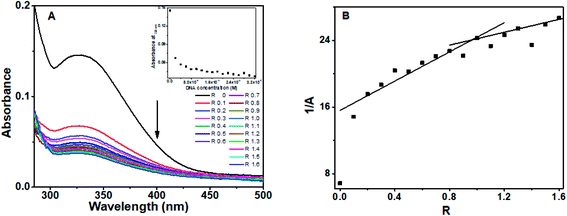
Chrysin showed absorption bands at 208 nm, 269 nm and 328 nm (ESI Fig. 1B†). The 328 nm exhibited hypochromism when DNA was added, with no shift in the wavelength as shown in ESI Fig. 2.† Upon addition of DNA, this band was found to be overlapped with the broad band of DNA. The DNA absorbance was deducted from the observed absorbance, and the resultant absorbance after subtracting the DNA absorbance was considered for analysis and is shown in Fig. 3A. Hypochromic effect with a slight blue shift of 4 nm was observed, with absorbance reaching saturation around 24 μM. Hypochromism was highest for the first addition of DNA and after that, a gradual decrease was observed. An isosbestic point at 295 nm was observed. The reciprocal plot 1/A with R changed slope at R = 1 (Fig. 3B), indicating a stoichiometry of 1![[thin space (1/6-em)]](https://www.rsc.org/images/entities/char_2009.gif) :
:![[thin space (1/6-em)]](https://www.rsc.org/images/entities/char_2009.gif) 1 in the solution.
1 in the solution.
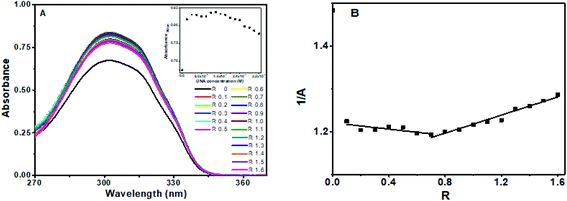
Flavone showed characteristic absorbance bands around 200 nm, 252 nm and 302 nm (ESI Fig. 1C†). On successive addition of DNA, hyperchromism for the 302 nm band was observed with a significant increase in the absorbance on first addition. After that, the changes were minimal as compared to the first change. After R = 1, the absorbance decreased, with sporadic changes, though higher than alone flavone, as shown in Fig. 4A. An isosbestic point at 300 nm was observed (ESI Fig. 3†). The resultant spectra after the subtraction of DNA absorbance are plotted in Fig. 4A. Absorbances in the range 275–290 nm and above 320 nm were comparable with overlapping of spectra. The plot of 1/A with R (Fig. 4B) has two different slopes with an inflection point at R = 0.7, predicts the possible stoichiometry 1![[thin space (1/6-em)]](https://www.rsc.org/images/entities/char_2009.gif) :
:![[thin space (1/6-em)]](https://www.rsc.org/images/entities/char_2009.gif) 0.7 for DNA
0.7 for DNA![[thin space (1/6-em)]](https://www.rsc.org/images/entities/char_2009.gif) :
:![[thin space (1/6-em)]](https://www.rsc.org/images/entities/char_2009.gif) flavones in the solution.
flavones in the solution.
Observed changes in intensity are indicative of the fluctuations in the microenvironment near the region of binding.
![[thin space (1/6-em)]](https://www.rsc.org/images/entities/char_2009.gif) :
:![[thin space (1/6-em)]](https://www.rsc.org/images/entities/char_2009.gif) 1 (Fig. 5B).
1 (Fig. 5B).
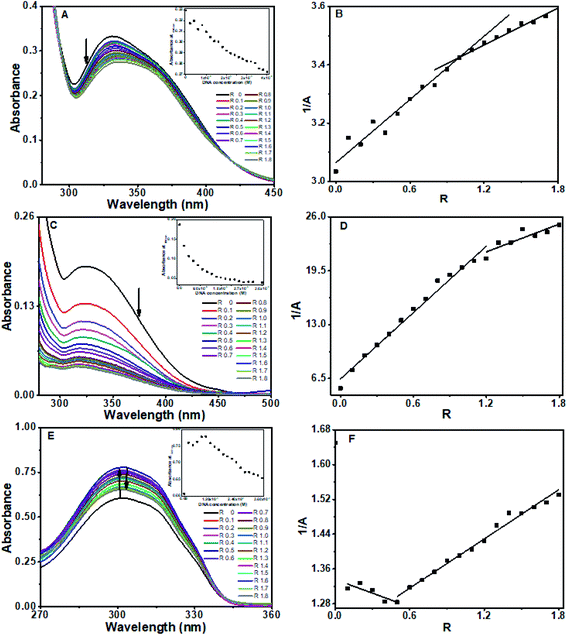
With chrysin, absorbance decreased abruptly at R = 0.1 without any substantial shift in the maximum absorption wavelength. After this, the decrease was small and gradual for 0.1 < R ≤ 1. The changes were minimal after R = 1. The absorbance was analyzed after removing the contribution from DNA as plotted in Fig. 5C. An isosbestic point observed around 288 nm, as evident in ESI Fig. 4,† which shows the absorption spectra as observed. The plot of absorbance with DNA concentration showed two different slopes (inset of Fig. 5C). An inflection point at R = 1.1 was obtained in the plot of 1/A with R, explaining a stoichiometry of 1![[thin space (1/6-em)]](https://www.rsc.org/images/entities/char_2009.gif) :
:![[thin space (1/6-em)]](https://www.rsc.org/images/entities/char_2009.gif) 1 (Fig. 5D).
1 (Fig. 5D).
For flavone, absorbance increased sharply on the addition of DNA followed by a decrease (hypochromism) at R ≥ 0.5. as depicted in ESI Fig 5.† An isosbestic point at 288 nm was observed. Absorbance spectra after subtraction from DNA were as shown in Fig. 5E. The plot of 1/A with R (Fig. 5F) has two different slopes with an inflection point at R = 0.5, predicts the possible stoichiometry of 1![[thin space (1/6-em)]](https://www.rsc.org/images/entities/char_2009.gif) :
:![[thin space (1/6-em)]](https://www.rsc.org/images/entities/char_2009.gif) 0.5 for DNA
0.5 for DNA![[thin space (1/6-em)]](https://www.rsc.org/images/entities/char_2009.gif) :
:![[thin space (1/6-em)]](https://www.rsc.org/images/entities/char_2009.gif) flavones in the solution.
flavones in the solution.
The changes in the absorbance spectra indicate the interaction between the compounds and both octamer and CT DNA. Generally, the qualitative description in terms of hyperchromism and hypochromism with spectral shift is used to propose the mode of interaction between DNA and small molecule. Hypochromism associated with a substantial red shift is often accounted for intercalation mode of binding. In comparison, a small shift associated with hypochromism indicates partial intercalation or groove binding. Hyperchromicity, accompanied by a slight bathochromic shift, predicts electrostatic interaction.37,38
Therefore, baicalein and chrysin's spectral changes indicate that both are binding externally either through partial intercalation or through groove binding mode to octamer and CT DNA, evident from the hypochromicity associated with small shifts. Absence of any charge on the ligand rules out the electrostatic interaction.
With flavone, hyperchromism without any shift in wavelength until R = 1 hints for electrostatic or hydrogen bonding involved in the binding. The hypochromism observed for R > 1 and R = 0.5 with octamer and CT DNA, respectively, indicates that partial intercalation also plays a role. These variations usually occur when the molecule binds to DNA through partial intercalation of the aromatic rings between the base pairs.37,39 Therefore, flavone interacts with octamer and CT DNA through two different mechanisms. The presence of isosbestic points in all cases indicates that there exists at least one equilibrium point in the solution.
Binding data were registered into Scatchard plot of r versus r/Cf and the isotherms with positive slope were evaluated using McGhee–von Hippel equation for cooperative binding.40–42
where r is the number of moles of flavones bound to per mole of DNA, Cf is the concentration of free flavone, Ka is the intrinsic binding constant to an isolated binding site, n is the number of nucleotide residues covered by the ligand and ω is the cooperativity parameter.
Isotherms with initial negative slopes were fitted with binding equation in the analogous form of Scatchard equation,
Binding constants were calculated using Scatchard plots (ESI Fig. 6†) and are quoted in Table 1. The values suggest that all three compounds bind DNA sequences with moderate to strong affinities.
| Binding constant d(CCAATTGG)2 (M−1) | Binding constant CT DNA (M−1) | |||||||
|---|---|---|---|---|---|---|---|---|
| From absorbance | From fluorescence, | From absorbance | From fluorescence, | |||||
| Kb (M−1) | N | Kb (M−1) | n | Kb (M−1) | n | Kb (M−1) | n | |
| Baicalein | 2.24 ×10⁵ | 2.5 | 3.4 × 10³ | 2.83 | 4.65 × 10⁵ | 1.17 | 4.47 × 10³ | 2.9 |
| Chrysin | 1.21 × 10⁵ | 2.65 | 9.07 ×10³ | 2.9 | 9.03 × 10⁵ | 2.62 | 3.03 × 10⁵ | 4 |
| Flavone | 8.42 × 10⁵ | 1.05 | 9.47 × 10³ | 3.78 | 2.18 × 10⁵ | 1.07 | — | — |
3.2 Fluorescence studies
Fluorescence spectroscopy is a very sensitive technique to decipher the interaction and stoichiometry of flavones with DNA. In this technique, flavones' fluorescence properties were probed. DNA does not have intrinsic fluorescence, and flavones are weak fluorophores in aqueous solutions. Emission spectra of baicalein, chrysin and flavone show broad bands around 436 nm, 426 nm and 381 nm when excited at 336 nm, 326 nm and 302 nm respectively (ESI Fig. 7 A–C†).The emission spectra of the three compounds were recorded at different pH values (pH = 2 to 10). At lower pH the emission intensities were lower (pH 2 and 4) and at higher pH (pH 9 and 10) intensity increased. At pH 5, 6, 7 emission intensities were almost same. A minute blue shift and red shift were observed at low and high pH conditions respectively with respect to pH 7. Flavone did not show significant changes with pH. The changes in spectra can be due to the deprotonation of the compounds and for flavone no significant changes observed due to the absence of OH groups. Spectra at different pH were shown in ESI Fig. 8 A–C.† For pH 5 to 7, fluorescence intensity did not change notably for all three compounds. All experiments were performed at pH 7.
![[thin space (1/6-em)]](https://www.rsc.org/images/entities/char_2009.gif) :
:![[thin space (1/6-em)]](https://www.rsc.org/images/entities/char_2009.gif) 0.6 stoichiometric ratio of baicalein
0.6 stoichiometric ratio of baicalein![[thin space (1/6-em)]](https://www.rsc.org/images/entities/char_2009.gif) :
:![[thin space (1/6-em)]](https://www.rsc.org/images/entities/char_2009.gif) DNA as well as chrysin
DNA as well as chrysin![[thin space (1/6-em)]](https://www.rsc.org/images/entities/char_2009.gif) :
:![[thin space (1/6-em)]](https://www.rsc.org/images/entities/char_2009.gif) DNA complexes present in their respective solutions (Fig. 7A and B), whereas many inflection points were observed in the case of flavone (Fig. 7C). The fluctuations of points in flavone's plot indicate heterogeneous binding of flavone.
DNA complexes present in their respective solutions (Fig. 7A and B), whereas many inflection points were observed in the case of flavone (Fig. 7C). The fluctuations of points in flavone's plot indicate heterogeneous binding of flavone.
 | ||
| Fig. 6 Fluorescence spectra of (A) baicalein, (B) chrysin and (C) flavone with different concentration of octamer DNA. | ||
 | ||
| Fig. 7 Plot of 1/F versus R for baicalein (436 nm) (A), chrysin (426 nm) (B) and flavone (381 nm) (C) with octamer DNA. | ||
Binding constants (Kb) were calculated McGhee–von Hippel equation as described in Section 3.1 and the plots were displayed in ESI Fig. 9 A–C,† and values are given in Table 1.
 | ||
| Fig. 8 Fluorescence spectra of (A) baicalein (B) chrysin and (C) flavone with different concentration of CT DNA. | ||
The 1/F vs. R plot shows inflection points at 0.45 and 0.6 respectively for baicalein and chrysin. Hence the possible stoichiometries that exist are 1![[thin space (1/6-em)]](https://www.rsc.org/images/entities/char_2009.gif) :
:![[thin space (1/6-em)]](https://www.rsc.org/images/entities/char_2009.gif) 0.45 and 1
0.45 and 1![[thin space (1/6-em)]](https://www.rsc.org/images/entities/char_2009.gif) :
:![[thin space (1/6-em)]](https://www.rsc.org/images/entities/char_2009.gif) 0.6 for these two compounds (Fig. 9 A–C). The plot was linear with fluctuations in the data points for flavone, indicating the possibility of multi-stoichiometric complexes in the solution.
0.6 for these two compounds (Fig. 9 A–C). The plot was linear with fluctuations in the data points for flavone, indicating the possibility of multi-stoichiometric complexes in the solution.
 | ||
| Fig. 9 Plot of 1/F versus R for baicalein (436 nm) (A), chrysin (426 nm) (B) and flavone (381 nm) (C) with CT DNA. | ||
Fluorescence spectral variations indicate the mode of interaction and changes in the local environment of the fluorophores. In DNA–small molecule interaction, a large blue shift associated with an increase in the fluorescence intensity demonstrates the groove mode of binding. In contrast, a redshift with an enhancement in intensity is related to the intercalation mode of binding.43
In this study, the blue shift in emission wavelengths of baicalein and chrysin and a significant enhancement of the intensity when complexed with octamer DNA suggest that these two molecules are in a nonpolar environment than when it is present in aqueous solution in the free state.
For flavone, the bathochromic shift in wavelength and the increment in intensity are minimal. These spectral features indicate partial intercalation or an external binding of flavone with DNA base pairs. The intensity variations (increase followed by decrease) suggest that electrostatic interaction and hydrogen bonding may also be involved in the binding between the two.
Baicalein fluorescence increased by more than an order, while chrysin fluorescence increased three times without any shift in the emission wavelength when complexed with CT DNA. Hence intercalation of these molecules into CT DNA is ruled out. The observed changes indicate that the two molecules are now in a more hydrophobic environment and might have intercalated. For flavone, the intensity first increased, then decreased. These changes indicate external binding or partial intercalation along with electrostatic interaction and hydrogen bonding.44,45
Therefore, it can be deduced that baicalein and chrysin interact with both octamer and CT DNA through partial intercalation. At the same time, flavone might have partially intercalated or externally bound to the DNA. Similar observations are obtained from the absorption data.
Binding constants (Kb) were calculated McGhee–von Hippel equation as described in Section 3.1 and the plots were displayed in ESI Fig. 9† and values are given in Table 1. Scatchard plot was not done in the case of flavone as there was increase and decrease of fluorescence intensity while titration, leading to scattered data points. Similar values for binding constants were reported for flavones and other small molecules compounds in literature.24,46,47
3.3 Displacement assay
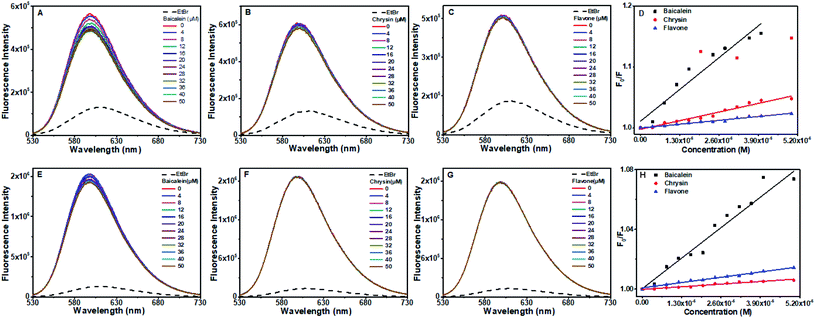
Many DNA binding dyes can be employed to decipher the mode of DNA–ligand interaction. In competitive displacement assay, the ligand that displaces the dye bound to DNA interacts in the same manner as that of the displaced dye. Variations in the DNA–dye system's emission profile, on addition of the ligand, can give hints about the mode of binding.48,49Fig. 10A–C displays the emission profiles of the octamer DNA–EtBr system along with the addition of different concentrations of baicalein, chrysin and flavone, respectively. The emission intensity of EtBr changed slightly with baicalein whereas chrysin and flavone no significant changes were observed (till 50 μM), implicating that these compounds are not intercalated completely in the DNA helix and were not able to displace EtBr from its intercalated position. Stern–Volmer quenching plots are represented in Fig. 10D.
With the CT DNA–EtBr system, the spectral change and Stern–Volmer plots with various concentrations of flavone compounds are given in Fig. 10E–G. As evident in the figure, the CT DNA–EtBr fluorescence did not get affected by the addition of the compounds. Hence, it indicates that all three compounds could not displace EtBr completely. Quenching constants are tabulated in Table 2.
| Compound | d(CCAATTGG)2 | CT DNA | ||
|---|---|---|---|---|
| Ksv (103 M−1), with EtBr | Ksv (103 M−1), with Hoechst | Ksv (103 M−1), with EtBr | Ksv (103 M−1), with Hoechst | |
| Baicalein | 3.20 | 4.21 | 1.57 | 7.95 |
| Chrysin | 1.08 | 6.47 | 0.13 | 9.24 |
| Flavone | 0.48 | 1.35 | 0.27 | 5.93 |
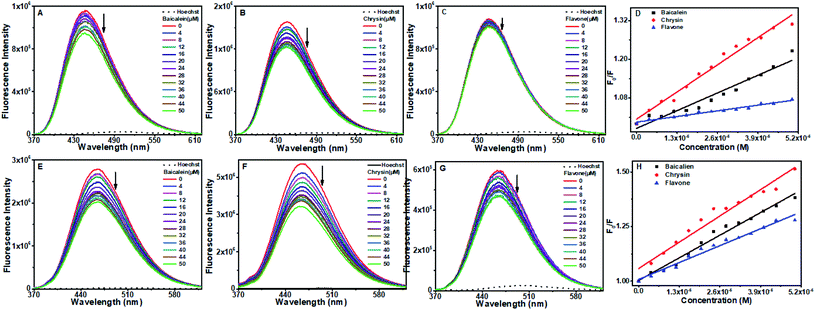
Fluorescence from the CT DNA–Hoechst system got quenched increasingly upon the progressive addition of all three flavone compounds indicating that they could displace Hoechst from its bound place. Quenching in the presence of chrysin was more, and the least quenching was by flavone.
EtBr displacement data suggest that the flavone compounds are not completely intercalated and signals for partial intercalation. In Hoechst dye displacement, the intensity variations suggest that the compounds are able to displace it to some extent indicating that they are bound near the AT region. Hoechst dye can bind to the unwound regions of DNA at higher concentration. Therefore this result cannot confirm its minor groove binding. Correlation with other data reported therefore indicate for a partial intercalation.
3.4 Potassium iodide (KI) quenching studies
Fluorescence quenching is a supportive method to investigate the binding mode of small molecules to double-helix DNA. DNA has polyanionic phosphate backbones, which can repel an anionic quencher. When a molecule is intercalated into the DNA, it will not be affected by the external anionic quencher. In contrast, partially intercalated or groove binding molecules will be less protected from the quencher52,53 and can get quenched to a certain extent.Flavones in solution was effectively quenched by KI (Fig. 12). In CT DNA and octamer DNA's presence, fluorescence intensities of baicalein, chrysin, and flavone were decreased minutely with the increasing amount of KI. However, the scale of quenching was very less. Stern–Volmer quenching constants (Ksv) were calculated, and the magnitude of Ksv in the presence of both DNA are given in Table 3. The Ksv values in the presence of DNA were very small compared to the value when they were in free form. The data suggest that baicalein and chrysin are quenched minutely, still not completely accessible to KI when they complex with DNA. These changes indicate that the compounds are in hydrophobic pockets and are not completely accessible to KI when bound to DNA. All the three flavones' fluorescence got quenched more in the presence of CT DNA than compared to the octamer sequence.
 | ||
| Fig. 12 Stern–Volmer quenching plot of (A) baicalein, (B) chrysin and (C) flavone in the absence and presence of CT-DNA and d(CCAATTGG)2 respectively upon successive addition of KI. | ||
| Flavones | Without DNA (M−1) | With CT-DNA (M−1) | With d(CCAATTGG)2 (M−1) |
|---|---|---|---|
| Baicalein | 76.58 | 11.67 | 4.94 |
| Chrysin | 161.99 | 52.28 | 6.25 |
| Flavone | 5.26 | 2.76 | 2.26 |
3.5 Effect of ionic strength
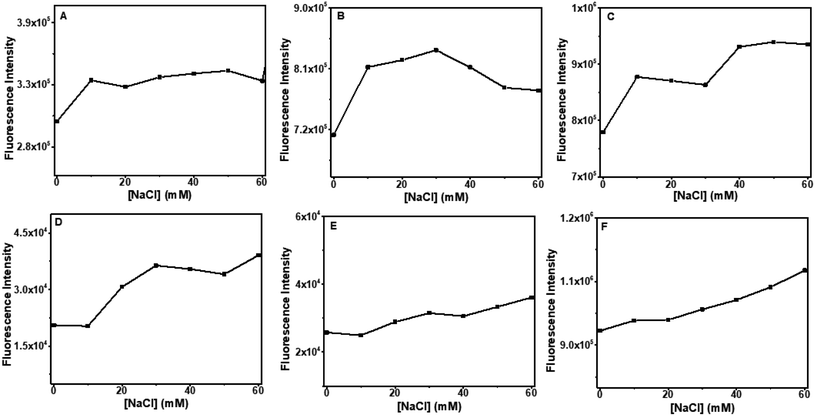
The effects of ionic strength in the formation of DNA–flavones complexes were analyzed using NaCl titration experiments. Titration of the electrolyte NaCl to the DNA–flavone bound solution can weaken the electrostatic interaction between the flavones and DNA. This can lead to the ejection of the compound from its position.54,55Changes in the fluorescence spectra of flavones–DNA system with increasing concentrations of NaCl (0–60 mM) were studied. It is observed that the fluorescence intensity of the compounds increased slightly on the addition of NaCl, as displayed in Fig. 13. No substantial variations were observed in the emission of DNA–baicalein and DNA–chrysin complexes after adding a sufficient amount of the salt. All the compounds have negligible fluorescence in the aqueous buffer than their DNA-bound form (see Fluorescence section). Therefore, the slight increase in the fluorescence tells that they are very much in the bound state and are well protected from the aqueous medium. This means that electrostatic interaction has only a small role in binding baicalein and chrysin with CT DNA and the octamer DNA sequences.
In contrast, the emission intensity increased by an apparent magnitude for the DNA–flavone system. The helix now gets tightened due to the electrostatic interaction between the negatively charged phosphate backbone and Na+ ions. Then the flavone is placed well into the hydrophobic region where it is protected from the cations. Since flavone is a small compact molecule, it might have got placed deep into the hydrophobic region and resulted in a slightly higher fluorescence.
4. Differential scanning calorimetry (DSC) studies
DSC is used to investigate the thermally induced structural transitions of DNA and its complex with a small molecule. The binding of baicalein, chrysin and flavone to both d(CCAATTGG)2 sequence and CT DNA were examined from DSC results using the shift in melting temperature Tm (ΔTm). DSC profiles were fitted with a non-two state model to obtain the best fit (Fig. 14). Table 4 reports the observed values of the heat enthalpies and Tm. Free octamer DNA was fitted with a single peak showing melting transition centered at Tm = 41.73 °C. The binding of baicalein and chrysin shifted Tm by 13.8 °C and 12.1 °C, which agrees for strong binding of these flavones with DNA. At the same time, Tm decreased by 2 °C for flavone–DNA complex, which implies its weak affinity to the DNA. Similar reduction or no change in Tm was reported for different flavones by Vitorino et al.13 The calorimetric enthalpy (ΔH) increased compared to alone DNA in the case of baicalein–DNA and chrysin–DNA complexes. These two compounds with more OH groups are binding more strongly as compared to flavone in which OH groups are replaced by H atoms (Fig. 1). These changes indicate that the structural changes in these three flavones are responsible for their differential binding. | ||
| Fig. 14 DSC thermograms showing excess heat capacity as the function of temperature for (A) free d(CCAATTGG)2 and complex at D/N = 1.0, with (B) baicalein, (C) chrysin, and (D) flavone. | ||
| Sample | Tm (°C) | ΔH (kcal mol−1) | ΔHV (kcal mol−1) | m (ΔHV/ΔH) | ΔTm (°C) |
|---|---|---|---|---|---|
| d(CCAATTGG)2 | 41.73 | 12.65 | 65.17 | 5.15 | — |
d(CCAATTGG)2 baicalein1![[thin space (1/6-em)]](https://www.rsc.org/images/entities/char_2009.gif) : :![[thin space (1/6-em)]](https://www.rsc.org/images/entities/char_2009.gif) 1 1 |
55.61 | 16.58 | 71.67 | 4.32 | 13.88 |
d(CCAATTGG)2 chrysin1![[thin space (1/6-em)]](https://www.rsc.org/images/entities/char_2009.gif) : :![[thin space (1/6-em)]](https://www.rsc.org/images/entities/char_2009.gif) 1 1 |
53.87 | 18.17 | 65.00 | 3.57 | 12.14 |
d(CCAATTGG)2 flavone1![[thin space (1/6-em)]](https://www.rsc.org/images/entities/char_2009.gif) : :![[thin space (1/6-em)]](https://www.rsc.org/images/entities/char_2009.gif) 1 1 |
39.66 | 8.72 | 81.28 | 9.32 | −2.07 |
CT DNA DSC profile exhibited a small peak followed by a broad peak, shown in Fig. 15. This feature may be due to more than two melting pathways or independent melting pathways from the single stranded and double stranded composition of CT DNA. The curve was fitted with three peaks to get the best fit. The second (Tm2) and third (Tm3) peaks were considered for analysis as they are closer to the melting temperature of CT DNA provided by the manufacturer. The first peak also showed a significant shift upon interacting with the compounds. As shown in Table 5, ΔTm2 = 6.95 °C and 2.8 °C and ΔTm3 = 7.19 °C and 5.22 °C for baicalein and chrysin, respectively, while ΔTm1 showed large deviation from the alone DNA value. The changes indicate a strong binding between CT DNA and molecules. For flavone, the shifts are small (∼0.5 °C) and hence represent low stability of its complex with CT DNA. The ratio of van't Hoff enthalpy to calorimetric enthalpy (ΔHV/ΔH = m) gives the average size of the simultaneous melting region of DNA. In a two-state behavior, m = 1 indicating that the DNA is directly converted to its denatured form. A deviation from this suggests a multi-state process where many intermediate states will be formed during the denaturing process.56,57
 | ||
| Fig. 15 DSC thermograms showing excess heat capacity as the function of temperature for (A) free CT DNA, and complex at D/N 1.0, with (B) baicalein, (C) chrysin, and (D) flavone. | ||
| Sample | Tm1 (°C) | ΔH1 (kcal mol−1) | ΔHV1 (kcal mol−1) | ΔHV1/ΔH1 | Tm2 (°C) | ΔH2 (kcal mol−1) | ΔHV2 (kcal mol−1) | m (ΔHV2/ΔH2) | Tm3 (°C) | ΔH3 (kcal mol−1) | ΔHV3 (kcal mol−1) | ΔTm2 (°C) | ΔTm3 (°C) |
|---|---|---|---|---|---|---|---|---|---|---|---|---|---|
| CT DNA | 56.60 | 6.86 | 35.26 | 5.13 | 77.05 | 8.16 | 83.30 | 10.2 | 86.54 | 15.26 | 49.83 | — | — |
CT DNA–baicalein 1![[thin space (1/6-em)]](https://www.rsc.org/images/entities/char_2009.gif) : :![[thin space (1/6-em)]](https://www.rsc.org/images/entities/char_2009.gif) 1 1 |
72.71 | 55.36 | 45.54 | 0.82 | 84.0 | 52.91 | 55.03 | 1.04 | 93.73 | 27.53 | 74.17 | 6.5 | 7.19 |
CT DNA–chrysin1![[thin space (1/6-em)]](https://www.rsc.org/images/entities/char_2009.gif) : :![[thin space (1/6-em)]](https://www.rsc.org/images/entities/char_2009.gif) 1 1 |
56.79 | 28.43 | 28.42 | 0.99 | 79.88 | 108.0 | 46.36 | 0.43 | 91.76 | 38.94 | 68.83 | 2.83 | 5.22 |
CT-DNA–flavone 1![[thin space (1/6-em)]](https://www.rsc.org/images/entities/char_2009.gif) : :![[thin space (1/6-em)]](https://www.rsc.org/images/entities/char_2009.gif) 1 1 |
49.80 | 4.25 | 48.6 | 11.4 | 78.10 | 10.46 | 92.95 | 8.8 | 87.07 | 17.27 | 50.98 | 1.05 | 0.53 |
Therefore, DSC data ascertained that baicalein and chrysin interact strongly with both DNAs forming stable complexes with a higher affinity for the octamer DNA sequence. Flavone exhibited a lower affinity with both DNA sequences and the complexes were less stable. The higher ΔTm values for baicalein and chrysin indicates the intercalation mode of binding.
5. Circular dichroism (CD) studies
CD spectroscopic technique is helpful to monitor the conformational changes of DNA in different conditions. The observed CD spectra of d(CCAATTGG)2 and CT DNA exhibited characteristic positive bands around 273 nm and 279 nm, respectively, due to base stacking and negative band around 240 nm and 245 nm due to the helicity of the DNA, the signature peaks of DNA in the right-handed B form.58,59 The changes in the CD spectra of DNA on the addition of flavone compounds were examined. The differences can be accounted for the corresponding alterations in the DNA structure.60,61 The three flavones under study did not show any significant signal in their CD spectra. The changes observed when flavone compounds were incubated with both the DNA, were depicted in ESI Fig. 10.† The intensities of the bands were changed without any induced signal.5.1 With octamer
The CD values of 240 nm and 273 nm bands of octamer DNA were decreased gradually when complexed with increasing concentrations of baicalein. The 240 nm band decreased by 88% at D/N = 2 without any significant shift while the 273 nm band decreased by 22% at D/N = 2 respectively with a red shift of ∼5 nm. With chrysin, the 240 nm band reduced by 16% at D/N = 2. The 273 nm band gradually reduced till D/N = 1 (27%) and after that the CD value increased slightly. No shift in wavelength was observed. Whereas for flavone, CD values decreased by 54% and 50% for negative and positive bands respectively without any shift. An isodichroic point around 259 nm indicates the existence of one major complex in the solution.5.2 With CT DNA
Similar nature in the CD spectra were observed with CT DNA. With baicalein, the CD values of the positive band at 279 nm decreased by 65% at D/N = 2 with a red shift of 14 nm. The negative band at 245 nm decreased by 80% at D/N = 2 without any shift. With chrysin, there was only a slight decrease in the CD bands without any shift. Complexation of flavone with CT DNA resulted in the reduction in intensities of the CD bands. There was a blue shift of 7 nm with a decrease in intensity of 64% at D/N 2 respectively for 279 nm band while 245 nm band decreased by 61% at D/N = 2 along with a blue shift of ∼4 nm. The intensity changes in the CD bands observed indicate the changes induced in the DNA conformation when flavones bound to both the DNA.The data shows that the changes were notably high with baicalein followed by flavone and least for chrysin. The changes in both bands indicate perturbation in the helicity as well as the stacking interaction of DNA causing a major conformational change in DNA. Decrease of the CD bands indicates changes in the helicity of DNA when it binds with a ligand and generally correlated to intercalation or groove binding of the ligand. Decrease in intensities of both bands is observed in the case of intercalation.62,63 Therefore, the CD changes for baicalein and flavone hints at the intercalation of them. Absence of any induced band hints that the molecules oriented not parallel to the nucleotide bases, but in a tilted fashion.64 The changes observed therefore predict that baicalein and flavone might have intercalated partially or in a tilted fashion. The dye displacement data supports this response.
Chrysin on the other hand did not exhibited any significant changes in the CD bands. The fluctuations in the baseline region above 300 nm is more for chrysin. These fluctuations without any noticeable changes hints for an intercalative mode of binding.64 The isodichroic regions (248 nm to 259 nm; 286 nm to 294 nm) observed indicate a strong complex formation through a single mode of binding. Absorbance and fluorescence intensities of all three compounds showed linearity with concentration ruling out the aggregation effects.
6. Molecular docking studies
Molecular docking is one of the most attractive techniques to understand the binding mechanism of small ligands with double-helical DNA in drug designing and elucidate the location of binding sites in target-specific interactions of the DNA. In this study, the three flavone compounds were docked with two duplex DNA sequences; d(CCAATTGG)2 (PBD ID:1JTL) and d(CGCGAATTCGCG)2 dodecamer (PDB ID:1BNA). Molecular docking provided the energetically favorable docked conformations and predicted first docked poses with the lowest energy were selected for analysis, out of hundred runs.6.1 With octamer sequence d(CCAATTGG)2
The docking results showed that the three flavones are bound to the central region of the DNA helix with a proximity to the AATT segment. With the octamer sequence d(CCAATTGG)2, baicalein and chrysin formed three hydrogen bonds each; with adenine (NH of A4; 1.9 Å), with the sugar-phosphate backbone of thymine bases (O4′ of T5, 2 Å; O3′ of T14, 2.5 Å). Binding energies for baicalein, chrysin and flavone were −8.28 kcal mol−1, −8.74 kcal mol−1, −8.46 kcal mol−1, respectively. The H bond lengths are within the range of 1.7–2.2 Å, and are of moderate to weak nature and contributed mainly by electrostatic interaction.65 All structures are rendered in PyMol (Fig. 16).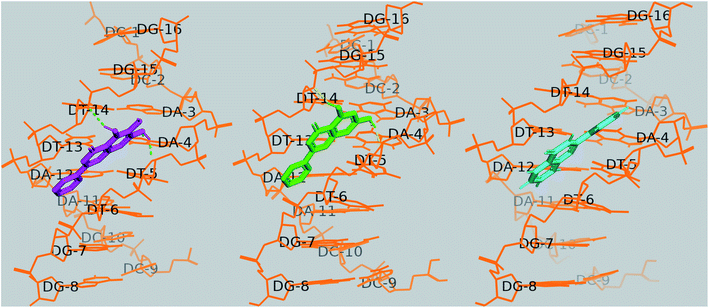 | ||
| Fig. 16 Docked poses of baicalein (magenta), chrysin (green) and flavone (cyan) with octamer DNA. Hydrogen bonds are shown as dashed lines. | ||
In the case of baicalein, cluster analysis showed two major clusters with 23 and 28 structures having the lowest binding energies −8.28 kcal mol−1 and −8.11 kcal mol−1. The docking poses of baicalein in these two clusters are flipped to each other, both in the AATT pocket. Baicalein formed two hydrogen bonds; one with adenine (N3H of A4; 1.9 Å) and with sugar-phosphate backbone of thymine bases (O4′ of T5, 2 Å).
Chrysin showed similar binding with octamer DNA and two clusters with 20 and 33 conformations. The structure with the lowest binding energy −8.74 kcal mol−1 formed two hydrogen bonds between O1of chrysin with N3H of A4 (1.78 Å) and 7OH of chrysin with O2 of T14 (1.795 Å).
Two major clusters were found for flavone; 30 and 65 conformations, each with binding energies −8.46 kcal mol−1, −8.21 kcal mol−1, respectively. Though flavone showed binding energy closer to baicalein, no H bond was observed to be formed between flavone and DNA in the most populated cluster (65 conformations), and the intermolecular energy was slightly higher for flavone. O1 of flavone is found to make H bond with O2 of T13 residue (2.92 Å) of octamer DNA.
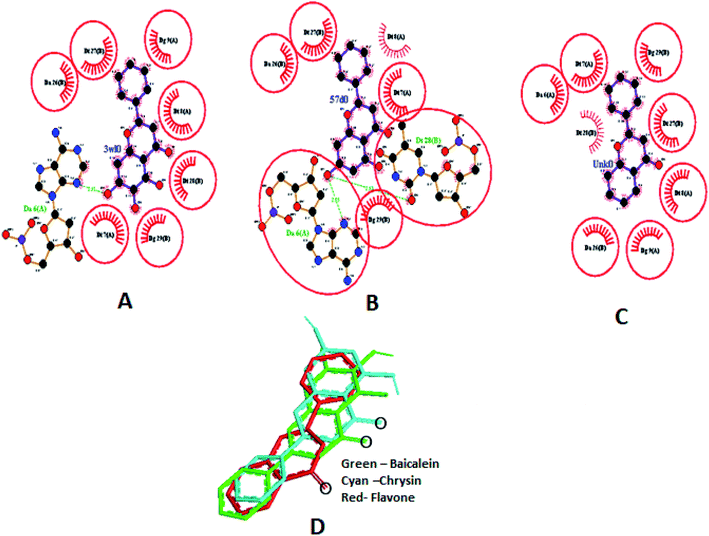
Different interactions involved in the complexes are depicted in Fig. 17A–C using Ligplot+.66 Both baicalein and chrysin have equivalent binding sites (red colour bonded residues), whereas flavone showed no equivalent binding sites. Ligplot illustrated the hydrophobic interactions involved in forming and stabilizing the DNA–ligand complexes (Fig. 17D). All three compounds are oriented in a similar fashion when bound to the DNA (Fig. 17D).
6.2 With 1BNA
Four hydrogen bonds were formed between baicalein and dodecamer DNA, viz., O1 of baicalein with O4 of T8 and N3 of A18, O4 with O3′ (backbone) of T19, 5OH with O3′ (backbone) of T19 and 7OH with O4′ (sugar ring) of T8. The lowest energy cluster consisted of 15 structures, and the lowest energy in this cluster was −8.33 kcal mol−1.Chrysin formed six hydrogen bonds with 1BDNA, viz., O1 of chrysin with N3 of A18, O4 with O3′ of C9, 5OH with O3′ and O5′ of C9 (backbone), 7OH with N3 of A17 and O4′ of A18 sugar ring. The lowest energy in the cluster having 30 structures was −8.61 kcal mol−1. Three hydrogen bonds are observed with flavone; between O4 of flavone and DNA, viz., N3 of A17, O4′ of A18 sugar ring, and O2 of C9. The lowest energy in the cluster with 60 structures was −8.22 kcal mol−1. Docked poses are shown in Fig. 18. Ligplot shown in Fig. 19A–C portrays the interactions involved. The docking poses show that baicalein and chrysin's orientations are similar while flavone is flipped by 180° (Fig. 19D).
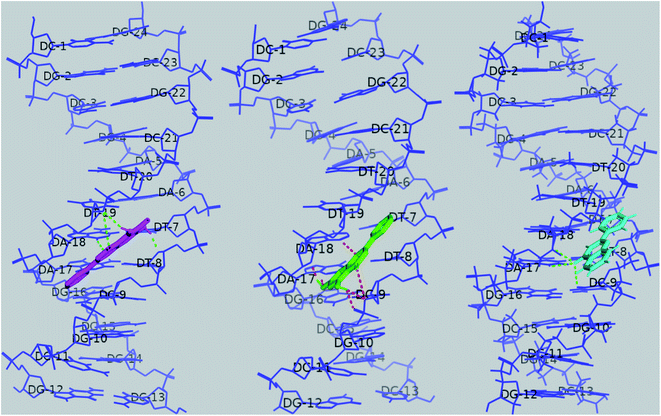 | ||
| Fig. 18 Docked poses of baicalein (magenta), chrysin (green) and flavone (cyan) with 1BNA. Hydrogen bonds are shown as dashed lines. | ||
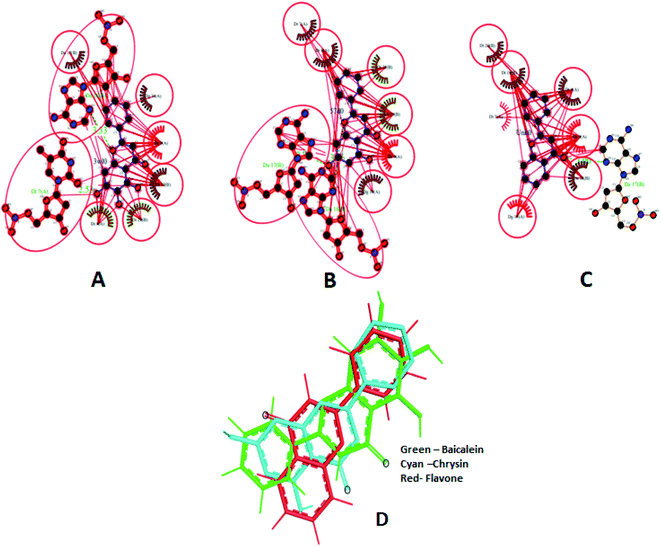 | ||
| Fig. 19 Ligplot showing the interactions of baicalein (3w10) (A), chrysin (57d0) (B) and flavone (Unk0) (C) with 1BNA. Hydrophobic interactions are shown as red lines, hydrogen bond interactions are in green, red circles and ellipses shows the equivalent sites among three complexes, thick red bonds represent equivalent residues involved in hydrophobic interaction. Docked poses of baicalein, chrysin and flavone superimposed (D). | ||
The molecular modelling analysis reveals that all three compounds are located near the AT rich region in the case of both DNA sequences. With both DNA sequences, it is observed that the flavone compounds form hydrogen bonds with the base and the sugar backbone. Atoms present in the minor groove region (N3 of A and O2 of T) are involved in the hydrogen bonds, confirming that they are bound in the minor groove region. The negative binding energy ensures that the interaction between the three flavone compounds and DNA sequences is thermodynamically favorable. Thus, these molecular docking data suggest that the flavones bind to DNA through groove modes of binding and are near the AT region. Vitorino et al.13 reported similar findings that hydroxyflavones exhibit external binding to DNA by forming hydrogen bonds with the DNA backbone's phosphate groups.
These results are not in line with the results of Tu et al.21 Therefore, we studied interactions of these flavones with few other DNA sequences. Docking of all three compounds with DNA sequences d(CGATCG)2 (PDB:1Z3F), d(CGTACG)2 (PDB:1K2K), d(CACGTG)2 (PDB:1UQC), d(TGATCA)2 (PDB:1SY8), d(CGAATTCG)2 (PDB:1BNA), d(CGTTAACG)2 (PDB:1CQO), d(CGCGATATCGCG)2 (PDB:1VTJ), were performed. The results showed that the flavones intercalated into the DNA bases only in the case of d(CGATCG)2, and in all other cases, it is binding externally to/near the AT regions. The docked poses are depicted in ESI Fig. 11A–G.† Many anticancer drugs such as daunorubicin, doxorubicin, adriamycin bind to the 5′-CpG 3′ sequence through intercalation.67–70 Docking results are not in agreement with the experimental data. This may be due to the reason that the experiments were performed in an aqueous environment whereas docking was performed in the absence of a water shell.
Flavones are reported to possess anticancer activity. Therefore, one of the possible mechanisms of their anticancer activity can be correlated to the intercalation of these molecules into the d(CGATCG)2 sequence and their partial intercalation to other DNA sequences. Also, it is known that type-2 restriction enzyme Pvu-1 recognizes the DNA sequence d(CGATCG)2.71 This hints that flavones may able to block Pvu-1 from binding to the DNA. Experimental data, as well as the docking results, indicate the possibility that they can alter or block the binding of many AT region binding proteins such as TATA box binding protein (TBP), male sex determining factor (SRY).72 These results open the door for examining the mechanism of flavones' therapeutic activity to understand their role and other potential targets in the cell.
7. Conclusion
In the reported work, we attempted to examine the DNA binding activity of baicalein, chrysin and flavone. Biophysical techniques and molecular modelling studies unveiled the interaction of these compounds with CT DNA and the sequence d(CCAATTGG)2. The changes in the melting temperatures of DNA in the free form and complex form with compounds were significant enough to predict for intercalative mode of binding. The stability of the complex was high for baicalein, followed by chrysin. Flavone formed a very weak complex. The changes in absorption spectra also support the mode of binding. CD studies confirmed the intercalation of the compounds resulting in large conformational changes of DNA. Absence of induced CD band hints that the compounds may be partially intercalated or intercalated in a tilted direction. Displacement assays shows that the compounds were able to displace EtBr and Hoechst to some extent. Molecular docking studies with different DNA sequences show that the molecules are bound near the AT region of the sequences in a groove binding mode, except with d(CGATCG)2. The discrepancy in the docking result can be due to the absence of an aqueous environment. In the case of d(CGATCG)2, the compounds are in the intercalated form, which agrees with the literature reports. This result hints that the three flavone compounds can be used for sequence-specific targeting and point to the potential use of them as drug-like molecules.Author contributions
Shailendra Kumar collected experimental data, analyzed and wrote the initial draft. Maya S Nair conceptualized, designed experiments, interpreted data, and edited the manuscript.Conflicts of interest
The authors declare that they have no competing financial interest or personal relationship that could have appeared to influence the work reported in this paper.Acknowledgements
Shailendra Kumar gratefully acknowledges University Grant Commission (UGC), India for a student research fellowship. Maya S Nair is grateful to the Council of Scientific and Industrial Research (CSIR), India for partial funding.References
- R. Palchaudhuri and P. J. Hergenrother, DNA as a target for anticancer compounds: methods to determine the mode of binding and the mechanism of action, Curr. Opin. Biotechnol., 2007, 18, 497–503 CrossRef CAS PubMed.
- W. D. Wilson and R. L. Jones, Intercalating drugs: DNA binding and molecular pharmacology, Adv. Pharmacol. Chemother, 1981, 18, 177–222 CAS.
- S. Neidle, Cancer drug design and discovery, Elsevier, 2011 Search PubMed.
- C. M. Nunn, E. Garman and S. Neidle, Crystal structure of the DNA decamer d(CGCAATTGCG) complexed with the minor groove binding drug netropsin, Biochemistry, 1997, 36, 4792–4799 CrossRef CAS PubMed.
- F. A. Tanious, T. C. Jenkins, S. Neidle and W. D. Wilson, Substituent position dictates the intercalative DNA-binding mode for anthracene-9,10-dione antitumor drugs, Biochemistry, 1992, 31, 11632–11640 CrossRef CAS PubMed.
- J. Bhattacharyya, A. Basu and G. S. Kumar, Intercalative interaction of the anticancer drug mitoxantrone with double stranded DNA: A calorimetric characterization of the energetics, J. Chem. Thermodyn., 2014, 75, 45–51 CrossRef CAS.
- J. M. Gottesfeld, J. M. Turner and P. B. Dervan, Chemical approaches to control gene expression, Gene Expr, 2000, 9(1–2), 77–91 CAS.
- G. S. Khan, A. Shah, Z-ur. Rehman and D. Barker, Chemistry of DNA minor groove binding agents, J. Photochem. Photobiol. B Biol., 2012, 115, 105–118 CrossRef CAS PubMed.
- S. Bhaduri, N. Ranjan and D. P. Arya, An overview of recent advances in duplex DNA recognition by small molecules, Beilstein J. Org. Chem., 2018, 14, 1051–1086 CrossRef CAS PubMed.
- A. G. Atanasov, S. B. Zotchev and V. M. Dirsch, et al., Natural products in drug discovery: advances and opportunities, Nat. Rev. Drug. Discov., 2021, 20, 200–216 CrossRef CAS.
- S. Banerjee, Z. Wang, M. Mohammad, F. H. Sarkar and R. M. Mohammad, Efficacy of selected natural products as therapeutic agents against cancer, J. Nat. Prod., 2008, 71, 492–496 CrossRef CAS PubMed.
- D. J. Newman and G. M. Cragg, Natural Products as Sources of New Drugs from 1981 to 2014, J. Nat. Prod., 2016, 79, 629–661 CrossRef CAS PubMed.
- J. Vitorino and M. J. Sottomayor, DNA interaction with flavone and hydroxyflavones, J. Mol. Struct., 2010, 975, 292–297 CrossRef CAS.
- C.-J. Hsieh, K. Hall, T. Ha, C. Li, G. Krishnaswamy and D. S. Chi, Baicalein inhibits IL-1beta- and TNF-alpha-induced inflammatory cytokine production from human mast cells via regulation of the NF-kappaB pathway, Clin. Mol. Allergy, 2007, 5, 5 CrossRef PubMed.
- P. Sithisarn, P. Rojsanga and P. Sithisarn, Inhibitory Effects on Clinical Isolated Bacteria and Simultaneous HPLC Quantitative Analysis of Flavone Contents in Extracts from Oroxylum indicum, Molecules, 2019, 24, 10 CrossRef PubMed.
- K. Zandi, B. T. Teoh, S. S. Sam, P. F. Wong, M. R. Mustafa and S. AbuBakar, Novel antiviral activity of baicalein against dengue virus, BMC Complement. Altern. Med., 2012, 12, 214 CrossRef CAS PubMed.
- H. C. Ahn, S. Y. Lee, J. W. Kim, W. S. Son, C. G. Shin and B. J. Lee, Binding aspects of baicalein to HIV-1 integrase, Mol. Cells, 2001, 12, 127–130 CAS.
- S. Samarghandian, J. T. Afshari and S. Davoodi, Chrysin reduces proliferation and induces apoptosis in the human prostate cancer cell line pc-3, Clinics, 2011, 66, 1073–1079 CrossRef.
- D. Y. Zhang, J. Wu, F. Ye and L. Xue, et al., Inhibition of cancer cell proliferation and prostaglandin E2 synthesis by Scutellaria baicalensis, Cancer Res., 2003, 63, 4037–4043 CAS.
- N. Cotelle, J. L. Bernier, J. P. Catteau, J. Pommery, J. C. Wallet and E. M. Gaydou, Antioxidant properties of hydroxy-flavones, Free Radic. Biol. Med., 1996, 20, 35–43 CrossRef CAS.
- B. Tu, Z. F. Chen, Z. J. Liu, L. Y. Cheng and Y. J. Hu, Interaction of flavones with DNA in vitro: Structure-activity relationships, RSC Adv., 2015, 5, 33058–33066 RSC.
- M. Rossi, R. Meyer and P. Constantinou, et al., Molecular structure and activity toward DNA of baicalein, a flavone constituent of the Asian herbal medicine ‘Sho-saiko-to, J. Nat. Prod., 2001, 64, 26–31 CrossRef CAS PubMed.
- G. Meng, W. Shumin, W. Jiali, L. Dan, G. Qingyu and L. Limin, Spectroscopic and Electrochemical Methods on the Interaction Mechanism of Baicalein with DNA, Chinese Journal of Applied Chemistry, 2014, 31, 114–119 Search PubMed.
- Y. Sun, S. Bi, D. Song, C. Qiao, D. Mu and H. Zhang, Study on the interaction mechanism between DNA and the main active components in Scutellaria baicalensis Georgi, Sens. Actuators, B, 2008, 129, 799–810 CrossRef CAS PubMed.
- P. P. Kuang, M. Joyce-Brady, X. H. Zhang, J. C. Jean and R. H. Goldstein, Fibulin-5 gene expression in human lung fibroblasts is regulated by TGF-β and phosphatidylinositol 3-kinase activity, Am. J. Physiol. Cell Physiol., 2006, 291, 1412–1421 CrossRef PubMed.
- S. Abhiman, L. M. Iyer and L. Aravind, BEN: A novel domain in chromatin factors and DNA viral proteins, Bioinformatics, 2008, 24, 458–461 CrossRef CAS PubMed.
- T. Matsubasa, M. Takiguchi, I. Matsuda and M. Mori, Rat Argininosuccinate Lyase Promoter: The Dyad-Symmetric CCAAT Box Sequence CCAATTGG in the Promoter Is Recognized by NF-Y 1, J. Biochem., 1994, 116, 1044–1055 CrossRef CAS PubMed.
- J. B. Park and M. Levine, Characterization of the promoter of the human ribonucleotide reductase R2 gene, Biochem. Biophys. Res. Commun., 2000, 267, 651–657 CrossRef CAS PubMed.
- P. Borger, H. Matsumoto and S. Boustany, et al., Disease-specific expression and regulation of CCAAT/enhancer-binding proteins in asthma and chronic obstructive pulmonary disease, J. Allergy Clin. Immunol., 2007, 119, 98–105 CrossRef CAS PubMed.
- C. Santoro, N. Mermod, P. C. Andrews and R. Tjian, A family of human CCAAT-box-binding proteins active in transcription and DNA replication: cloning and expression of multiple cDNAs, Nature, 1988, 334, 218–224 CrossRef CAS PubMed.
- G. M. Morris, R. Huey and W. Lindstrom, et al., AutoDock4 and AutoDockTools4: Automated docking with selective receptor flexibility, J. Comput. Chem., 2009, 30, 2785–2791 CrossRef CAS PubMed.
- N. M. O'Boyle, M. Banck, C. A. James, C. Morley, T. Vandermeersch and G. R. Hutchison, Open Babel: An open chemical toolbox, J. Cheminform, 2011, 3, 33 CrossRef PubMed.
- The PYMOL Molecular Graphics System, Version 2.4.1, Schrodinger, LLC Search PubMed.
- R. Kanwal, M. Datt, X. Liu and S. Gupta, Dietary flavones as dual inhibitors of DNA methyltransferases and histone methyltransferases, PLoS One, z2016, 11, e0162956 Search PubMed.
- A. S. Meyer and G. H. Ayres, The Mole Ratio Method for Spectrophotometric Determination of Complexes in Solution1, J. Am. Chem. Soc., 1957, 79, 49–53 CrossRef CAS.
- F. Barcelo and J. Portugal, Berenil recognizes and changes the characteristics of adenine and thymine polynucleotide structures, Biophys. Chem., 1993, 47, 251–260 CrossRef CAS PubMed.
- M. B. Gholivand, S. Kashanian, H. Peyman and H. Roshanfekr, DNA-binding study of anthraquinone derivatives using Chemometrics methods, Eur. J. Med. Chem., 2011, 46, 2630–2638 CrossRef CAS PubMed.
- P. J. Cox, G. Psomas and C. A. Bolos, Characterization and DNA-interaction studies of 1,1-dicyano-2,2-ethylene dithiolate Ni(II) mixed-ligand complexes with 2-amino-5-methyl thiazole, 2-amino-2-thiazoline and imidazole. Crystal structure of [Ni(i-MNT)(2a-5mt)2], Bioorg. Med. Chem., 2009, 17, 6054–6062 CrossRef CAS PubMed.
- N. Shahabadi, S. Kashanian and F. Darabi, DNA binding and DNA cleavage studies of a water soluble cobalt(II) complex containing dinitrogen Schiff base ligand: The effect of metal on the mode of binding, Eur. J. Med. Chem., 2021, 45, 4239–4245 CrossRef PubMed.
- J. D. McGhee and P. H. von Hippel, Theoretical aspects of DNA-protein interactions: Co-operative and non-co-operative binding of large ligands to a one-dimensional homogeneous lattice, J. Mol. Biol., 1974, 86, 469–489 CrossRef CAS.
- I. Piantanida, L. Mašić and G. Rusak, Structure-spectrophotometric selectivity relationship in interactions of quercetin related flavonoids with double stranded and single stranded RNA, J. Mol. Struct., 2009, 924–926, 138–143 CrossRef CAS.
- R. C. Yadav, G. S. Kumar and K. B. Prabal Giri, et al., Berberine, a strong polyriboadenylic acid binding plant alkaloid: spectroscopic, viscometric, and thermodynamic study, Bioorg. Med. Chem., 2005, 13, 165–174 CrossRef CAS PubMed.
- A. M. Pyle, J. P. Rehman, R. Meshoyrer, C. V. Kumar and N. J. Turro, Mixed-ligand complexes of ruthenium(II): Factors governing binding to DNA, J. Am. Chem. Soc., 1989, 111, 3051–3058 CrossRef CAS.
- A. G. Krishna, D. V. Kumar, B. M. Khan, S. K. Rawal and K. N. Ganesh, Taxol–DNA interactions: fluorescence and CD studies of DNA groove binding properties of taxol, Biochim. Biophys. Acta Gen. Subj., 1998, 1381, 104–112 CrossRef CAS.
- S. Bi, C. Qiao and D. Song, et al., Study of interactions of flavonoids with DNA using acridine orange as a fluorescence probe, Sens. Actuators, B, 2006, 119, 199–208 CrossRef CAS.
- C. Ji, X. Yin, H. Duan and L. Liang, Molecular complexes of calf thymus DNA with various bioactive compounds: Formation and characterization, Int. J. Biol. Macromol., 2021, 168, 775–783 CrossRef CAS.
- K. Bhadra and G. S. Kumar, Interaction of berberine, palmatine, coralyne, and sanguinarine to quadruplex DNA: a comparative spectroscopic and calorimetric study, Biochim. Biophys. Acta, 2011, 1810, 485–496 CrossRef CAS PubMed.
- J. Olmsted and D. R. Kearns, Mechanism of ethidium bromide fluorescence enhancement on binding to nucleic acids, Biochemistry, 1977, 16, 647–3654 CrossRef PubMed.
- C. E. Bostock-Smith and M. S. Searle, DNA minor groove recognition by bis-benzimidazole analogues of Hoechst 33258: insights into structure-DNA affinity relationships assessed by fluorescence titration measurements, Nucleic Acids Res., 1999, 27, 1619–1624 CrossRef CAS.
- Y. Guan, W. Zhou, X. Yao, M. Zhao and Y. Li, Determination of nucleic acids based on the fluorescence quenching of Hoechst 33258 at pH 4.5, Anal. Chim. Acta, 2006, 570, 21–28 CrossRef CAS.
- V. Nikolai, Binding of Hoechst with nucleic acids using fluorescence spectroscopy, J. Biophys. Chem., 2011, 2, 443–447 CrossRef.
- D. Sahoo, P. Bhattacharya and S. Chakravorti, Quest for Mode of Binding of 2-(4- (Dimethylamino)styryl)-1-methylpyridinium Iodide with Calf Thymus DNA, J. Phys. Chem. B, 2010, 114, 2044–2050 CrossRef CAS PubMed.
- D. Sarkar, P. Das, S. Basak and N. Chattopadhyay, Binding Interaction of Cationic Phenazinium Dyes with Calf Thymus DNA: A Comparative Study, J. Phys. Chem. B, 2008, 112, 9243–9249 CrossRef CAS PubMed.
- J. B. LePecq and C. Paoletti, A fluorescent complex between ethidium bromide and nucleic acids. Physical-chemical characterization, J. Mol. Biol., 1967, 827, 7–106 Search PubMed.
- C. Qiao, S. Bi, Y. Sun, D. Song, H. Zhang and W. Zhou, Study of interactions of anthraquinones with DNA using ethidium bromide as a fluorescence probe, Spectrochim. Acta Part A Mol. Biomol. Spectrosc., 2008, 70, 136–143 CrossRef PubMed.
- A. A. Saboury and A. A. Moosavi-Movahedi, Clarification of calorimetric and van't hoff enthalpies for evaluation of protein transition states, Biochem. Educ., 1994, 22, 210–211 CrossRef CAS.
- F. P. Schwarz, K. Puri and A. Surolia, Thermodynamics of the binding of galactopyranoside derivatives to the basic lectin from winged bean (Psophocarpus tetrogonolobus), J. Biol. Chem., 1991, 266, 24344–24350 CrossRef CAS PubMed.
- J. Kypr, I. Kejnovská, D. Renčiuk and M. Vorlíčková, Circular dichroism and conformational polymorphism of DNA, Nucleic Acids Res., 2009, 37, 1713–1725 CrossRef CAS PubMed.
- M. M. Islam, M. Chakraborty, P. Pandya, A. Al Masum, N. Gupta and S. Mukhopadhyay, Binding of DNA with Rhodamine B: Spectroscopic and molecular modeling studies, Dyes Pigm., 2013, 99, 12–422 CrossRef.
- B. Nguyen, D. Homelberg and C. Bailly, et al., Characterization of a Novel DNA Minor-Groove Complex, Biophys. J., 2004, 86, 1028–1041 CrossRef CAS PubMed.
- Y.-M. Chang, C. K.-M. Chen and M.-H. Hou, Conformational Changes in DNA upon Ligand Binding Monitored by Circular Dichroism, Int. J. Mol. Sci., 2012, 13, 3394–3413 CrossRef CAS PubMed.
- I. Piantanida, B. S. Palm, Z. Mladen and H.-J. Schneider, A new 4, 9-diazapyrenium intercalator for single-and double-stranded nucleic acids: distinct differences from related diazapyrenium compounds and ethidium bromide, J. Chem. Soc. Perkin Trans., 2001, 9, 1808–1816 RSC.
- H. Xu, K. C. Zheng and Y. Chen, et al., Effects of ligand planarity on the interaction of polypyridyl Ru(ii) complexes with DNA, Dalt. Trans., 2003, 11, 2260–2268 RSC.
- T. Šmidlehner, I. Piantanida and G. Pescitelli, Polarization spectroscopy methods in the determination of interactions of small molecules with nucleic acids - tutorial, Beilstein J. Org. Chem., 2018, 4, 84–105 CrossRef.
- G. A. Jeffrey, An Introduction to Hydrogen Bonding, Oxford University Press, New York, 1997 Search PubMed.
- R. A. Laskowski and M. B. Swindells, LigPlot+: multiple ligand-protein interaction diagrams for drug discovery, J. Chem. Inf. Model., 2011, 51, 2778–2786 CrossRef CAS PubMed.
- A. H.-J. Wang, Intercalative drug binding to DNA, Curr. Opin. Struct. Biol., 1992, 2, 361–368 CrossRef CAS.
- B. Jawad, L. Poudel, R. Podgornik, N. F. Steinmetz and W.-Y. Ching, Molecular mechanism and binding free energy of doxorubicin intercalation in DNA, Phys. Chem. Chem. Phys., 2019, 21, 3877–3893 RSC.
- A. H. Wang, G. Ughetto, G. J. Quigley and A. Rich, Interactions between an anthracycline antibiotic and DNA: molecular structure of daunomycin complexed to d(CpGpTpApCpG) at 1.2-A resolution, Biochemistry, 1987, 26, 1152–1163 CrossRef CAS PubMed.
- S. Mazzini, R. Mondelli and E. Ragg, Structure and dynamics of intercalation complexes of anthracyclines with d(CGATCG)2 and d(CGTACG)2. 2D-1H and 31P NMR investigations, J. Chem. Soc., Perkin Trans., 1998, 2, 1983–1992 RSC.
- https://www.Uniprot.org/uniport/P31031.
- C. A. Bewley, A. M. Gronenborn, and G. M. Clore, Minor Groove-Binding Architectural Proteins: Structure, Function, and DNA Recognition, in Annual Reviews Collection, National Center for Biotechnology Information (US), Bethesda (MD), 2002 Search PubMed.
Footnote |
| † Electronic supplementary information (ESI) available. See DOI: 10.1039/d1ra04101k |
| This journal is © The Royal Society of Chemistry 2021 |

