 Open Access Article
Development of an ultrafast fluorescent probe for specific recognition of hypochlorous acid and its application in live cells†
Zhencai Xu‡
ab,
Xiaofeng Wang‡a,
Tingting Duana,
Rong Hea,
Fangwu Wanga and
Xuejun Zhou *a
*a
aDepartment of Otolaryngology, Head and Neck Surgery, The First Affiliated Hospital of Hainan Medical University, Haikou 570102, China. E-mail: xuejunzhouent@hainmc.edu.cn
bGuanyun People's Hospital, Lianyungang 222000, China
First published on 14th July 2021
Abstract
Hypochlorous acid (HOCl), a highly potent oxidant of reactive oxygen species, plays critical roles in many physiological and pathological processes. In this work, a novel coumarin-based fluorescent probe, Cou–HOCl, was prepared for the detection of HOCl. The probe exhibited good selectivity over other analytes, excellent sensitivity with a detection limit of 16 nM, and fast response within 5 s. And further study demonstrated that the probe could be used not only to image exogenous HOCl in various cells, but also to determine the fluctuating levels of HOCl in macrophage cells during inflammation.
Introduction
Hypochlorous acid (HOCl) is an indispensable reactive oxygen species (ROS) in organisms, which is intimately involved in various pathophysiological processes and has a significant impact on organisms.1 HOCl is produced in the body by inflammatory cells such as macrophages and neutrophils via the reaction of hydrogen peroxide (H2O2) and chloride ions (Cl−) catalyzed by myeloperoxidase (MPO).2,3 HOCl can effectively kill bacteria in cells, which allows HOCl to be used as a powerful tool to resist pathogens that invade the immune system.4 However, abnormal production of HOCl may cause oxidative stress, leading to the occurrence of various diseases including inflammation, cardiovascular disease, nervous system disease, and even cancer.5–7 In view of the important role of HOCl in living systems, there is an urgent need to develop tools to study the dynamic changes of HOCl in vivo.Various methods such as electrochemistry, iodometry and colorimetry are available to detect HOCl, but they are very complicated to execute.8,9 In recent years, fluorescence imaging technology has developed rapidly and attracted increasing attention because it can be used to study changes of molecules at the cellular level in real time, and do so non-invasively and with high selectivity and sensitivity. Fluorescent probes are the ideal tools for use with fluorescence imaging technology to investigate molecular life activities.10–14 Many efforts have been made to develop fluorescent probes of HOCl on the basis of reactions with various sensing moieties including oxime oxidation,15,16 selenium oxidation,17,18 p-aminophenol oxidation,19,20 lactam oxidation,21–23 double bond oxidation,24–26 thioester chlorination,27 and others.28 However, some of these HOCl probes are limited by poor sensitivity, poor photostability, and slow response.29,30 Therefore, developing HOCl fluorescent probes featuring advantages such as high sensitivity, high photostability, and rapid response is still very important.
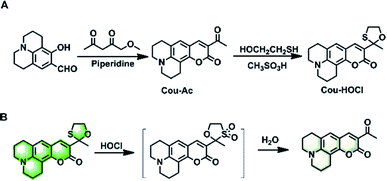
Herein, we describe a simple coumarin-based fluorescent probe, Cou–HOCl, for detecting HOCl based on an HOCl-mediated oxidation deprotection mechanism. Cou–HOCl was obtained by simple condensation of coumarin derivatives and mercaptoethanol (Scheme 1). In the absence of HOCl, Cou–HOCl itself exhibited a strong green fluorescence. After reacting with HOCl, Cou–HOCl showed a dramatic decrease in fluorescence. It was worth noting that Cou–HOCl displayed excellent sensitivity and selectivity. The biological evaluation also demonstrated that Cou–HOCl could be employed to visualize the fluctuating levels of HOCl in cells.
Results and discussion
Spectral properties of Cou–HOCl
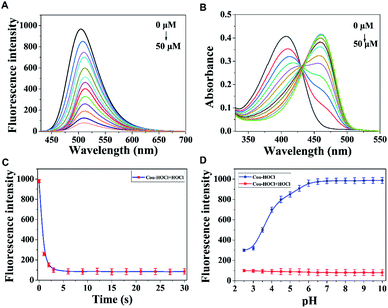
With the probe in hand, UV-Vis and fluorescence spectra were first acquired. As shown in Fig. 1A, upon being excited with light having a wavelength of 410 nm, Cou–HOCl displayed an emission peak at 510 nm. As the HOCl concentration was increased from 0 to 50 μM, the fluorescence emission showed a prompt decrease in intensity and a slight red shift. The fluorescence intensity of Cou–HOCl at about 510 nm and the concentration of HOCl (0–50 μM) showed a predominantly linear relationship (F510 nm = −17.99 × [HOCl]/μM + 979.83, R2 = 0.9987). Based on the standard method of 3σ/k, the detection limit of HOCl was calculated to be 16 nM (Fig. S1†). Free Cou–HOCl yielded a maximum absorption peak at 410 nm, as shown in Fig. 1B. Upon increasing the concentration of HOCl from 0 to 50 μM, a new absorption peak at 470 nm emerged and increased in intensity with a well-defined isobestic point at 430 nm. The fluorescence intensity changes at 510 nm over time are shown in Fig. 1C. After adding 50 μM HOCl to the solution of Cou–HOCl, the reaction was basically completed within 5 s, and the fluorescence intensity remained stable over the course of 30 s. The time-dependent changes in fluorescence indicated the ability of the probe to quickly respond to HOCl, and in fact do so more quickly than most of the previously reported HOCl probes.30 Next, we investigated the ability of Cou–HOCl to recognize HOCl in conditions with different pH values from 2.5 to 10.0. As shown in Fig. 1D, the fluorescence intensity at 510 nm remained unchanged in the pH range 6.0–10.0, showing the excellent stability of Cou–HOCl. Throughout the pH range 2.5–10.0, the fluorescence intensity of Cou–HOCl was less in the presence of HOCl than in its absence. The results implied that Cou–HOCl could be deployed for the detection of HOCl in the physiological pH range of living systems. Various competing analytes such as reactive sulfur species, metal ions, reactive nitrogen species and reactive oxygen species were applied together with fluorescence spectroscopy to investigate the selectivity of Cou–HOCl toward HOCl. As shown in Fig. S2,† the presence of HOCl triggered an apparent fluorescence decrease, while other analytes such as GSH, Cys, Hcy, Fe2+, Fe3+, Zn2+, Cu2+, NO, KO2, H2O2, 1O2, HO˙, and t-BuOOH did not cause such fluorescence changes. All of these results showed the excellent sensing performance of Cou–HOCl toward HOCl over other competing analytes. To verify the reaction mechanism, we acquired 1H NMR spectra of Cou–HOCl to which HOCl was added in CD3CN/H2O (v/v = 9/1). As depicted in Fig. S3,† Cou–HOCl was observed to convert to Cou–Ac.Imaging application of Cou–HOCl
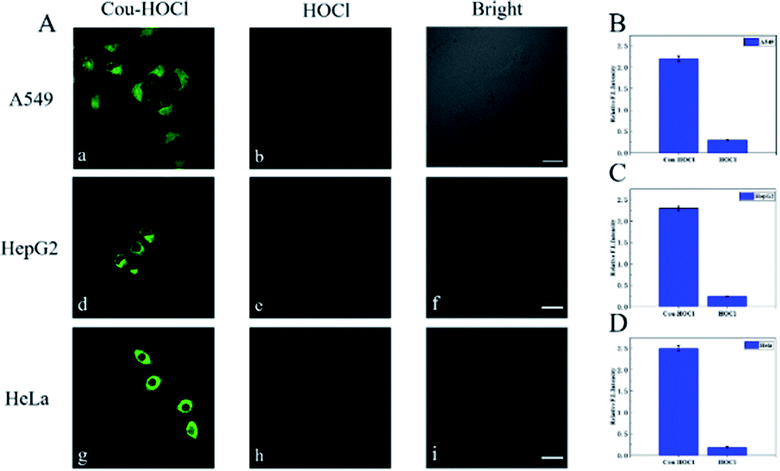
The excellent spectral properties of Cou–HOCl motivated us to investigate its potential applications in live cells. Prior to the cell imaging, the cytotoxic activity of Cou–HOCl was first evaluated by performing Cell Counting Kit-8 (CCK-8) assays. As can be seen from Fig. S4,† Cou–HOCl showed inconspicuous cytotoxicity even at a concentration of 100 μM in various cells, which indicated that the probe could be applied for cell imaging. Cou–HOCl was incubated with different types of cells including A549, HepG 2 and HeLa cells for 30 minutes and in each case a remarkable green fluorescence was seen (Fig. 2). However, following incubation with 50 μM of HOCl, the intensity of the green fluorescence decreased rapidly. The results confirmed that Cou–HOCl could sensitively detect HOCl in biological systems.Subsequently, we set out to investigate the ability of using Cou–HOCl to detect HOCl in inflammatory cells. Different samples of live RAW264.7 cells were first pretreated with different concentrations of HOCl (0, 5, 10, 15, 20, 30, and 50 μM, respectively), and then each incubated with Cou–HOCl. As shown in Fig. 3A, in the absence of HOCl, the cells loaded with Cou–HOCl showed a strong green fluorescence signal. As the concentration of the exogenous HOCl was increased, the intracellular green fluorescence gradually weakened in a concentration-dependent manner. Compared with the control group, the addition of 50 μM HOCl reduced the fluorescence intensity at least five fold (Fig. 3B), which indicated that Cou–HOCl could effectively penetrate the cell membrane and be used to detect changes in the level of exogenous HOCl in RAW264.7 cells. To investigate the feasibility of using Cou–HOCl to image endogenous HOCl in inflammatory cells, we chose LPS (an inflammation activator) to stimulate RAW264.7 cells to produce endogenous HOCl. As displayed in Fig. 3C and D, the green fluorescence of the LPS-treated group was weaker than that of the control group. Myeloperoxidase (MPO) is a well-known peroxidase that could catalyze the conversion of hydrogen peroxide and chloride ions to HOCl. To investigate the mechanism of the catalysis of the production of HOCl by MPO, different samples of the cells were treated with MPO, H2O2 + Cl−, and MPO + H2O2 + Cl−, respectively. For the MPO and H2O2 + Cl− treatment groups, the green fluorescence intensities were slightly reduced compared to the control, while the intensity for the MPO + H2O2 + Cl− treatment group was significantly reduced. To further verify the intracellular fluorescence changes caused by endogenous HOCl, different samples of the cells were treated with LPS, 4-aminobenzoic acid hydrazide (ABH) or salicyl hydroxamic acid (SHA) (two well-known MPO inhibitors), and Cou–HOCl, respectively. The green fluorescence signals of the cells were well maintained in the presence of ABH or SHA. Overall, these results demonstrated that Cou–HOCl was a simple tool capable to detect and image exogenous and endogenous HOCl levels in inflammatory cells.
Conclusions
In conclusion, we have rationally designed and synthesized a fluorescent probe with high selectivity and sensitivity for HOCl detection. The fluorescence imaging of HOCl in various cell lines demonstrated the potential biological application of Cou–HOCl. Furthermore, Cou–HOCl could be applied for directly visualizing endogenous HOCl in inflammatory cells. Due to the advantages of Cou–HOCl, we believe that it can serve as an important tool for cell biology research and clinical medical diagnosis.Author contributions
Zhencai Xu: methodology, data curation, writing – original draft. Xiaofeng Wang: validation, data curation. Tingting Duan: data curation. Rong He: validation. Fangwu Wang: writing – original draft. Xuejun Zhou: supervision, project administration, funding acquisition.Conflicts of interest
There are no conflicts to declare.Acknowledgements
This work was supported by the Natural Science Foundation of Hainan Province (819MS121).Notes and references
- E. A. Souza, D. Maitra, G. M. Saed, M. P. Diamond, A. A. Moura, S. Pennathur and H. M. Abu-Soud, PLoS One, 2011, 6, e27641 CrossRef PubMed.
- D. I. Pattison and M. J. Davies, Chem. Res. Toxicol., 2001, 14, 1453–1464 Search PubMed.
- C. M. Spickett, A. Jerlich, O. M. Panasenko, J. Arnhold, A. R. Pitt, T. Stelmaszyńska and R. J. Schaur, Acta Biochim. Pol., 2000, 47, 889–899 CrossRef CAS.
- J. Marcinkiewicz, B. Chain, B. Nowak, A. Grabowska, K. Bryniarski and J. Baran, Inflamm. Res., 2000, 49, 280–289 CrossRef CAS PubMed.
- M. S. Petrônio and V. F. Ximenes, Biochim. Biophys. Acta, 2012, 1824, 1090–1096 CrossRef.
- M. L. Aiken, R. G. Painter, Y. Zhou and G. Wang, Free Radic. Biol. Med., 2012, 53, 2308–2317 CrossRef CAS.
- Y. W. Yap, M. Whiteman and N. S. Cheung, Cell. Signal., 2007, 19, 219–228 CrossRef CAS PubMed.
- N. O. Soto, B. Horstkotte, J. G. March, P. L. López de Alba, L. López Martínez and V. Cerdá Martín, Anal. Chim. Acta, 2008, 611, 182–186 CrossRef.
- O. Ordeig, R. Mas, J. Gonzalo, F. J. Del Campo, F. J. Muñoz and C. de Haro, Electroanalysis, 2005, 17, 1641–1648 CrossRef CAS.
- Q. Yang, T. Lan and W. He, Dyes. Pigments, 2021, 186, 108997 CrossRef CAS.
- H. Liu, M. N. Radford, C. T. Yang, W. Chen and M. Xian, Br. J. Pharmacol., 2019, 176, 616–627 CrossRef CAS.
- J. L. Kolanowski, F. Liu and E. J. New, Chem. Soc. Rev., 2018, 47, 195–208 RSC.
- R. Lü, J. Mol. Cell. Cardiol., 2017, 110, 96–108 CrossRef.
- J. Chan, S. C. Dodani and C. J. Chang, Nat. Chem., 2012, 4, 973–984 CrossRef CAS PubMed.
- L. Wang, M. Ren, Z. Li, L. Dai and W. Lin, Anal. Methods, 2019, 11, 1580–1584 RSC.
- G. Cheng, J. Fan, W. Sun, K. Sui, X. Jin, J. Wang and X. Peng, Analyst, 2013, 138, 6091–6096 RSC.
- G. Cheng, J. Fan, W. Sun, J. Cao, C. Hu and X. Peng, Chem. Commun., 2014, 50, 1018–1020 RSC.
- B. Wang, P. Li, F. Yu, P. Song, X. Sun, S. Yang, Z. Lou and K. Han, Chem. Commun., 2013, 49, 1014–1016 RSC.
- K. Wang, P. Jia, X. Li, X. Zhang, C. Liu, Y. Yu, H. Zhu, Z. Li, W. Sheng and B. Zhu, Dyes. Pigments, 2020, 177, 108310 CrossRef CAS.
- P. Jia, Z. Zhuang, C. Liu, Z. Wang, Q. Duan, Z. Li, H. Zhu, B. Du, B. Zhu, W. Sheng and B. Kang, Anal. Chim. Acta, 2019, 1052, 131–136 CrossRef CAS.
- S. L. Shen, X. Q. Huang, H. L. Jiang, X. H. Lin and X. Q. Cao, Anal. Chim. Acta, 2019, 1046, 185–191 CrossRef CAS PubMed.
- T. R. Wang, X. F. Zhang, X. Q. Huang, X. Q. Cao and S. L. Shen, Spectrochim Acta A, 2021, 247, 119115 CrossRef CAS PubMed.
- J. T. Hou, M. Y. Wu, K. Li, J. Yang, K. K. Yu, Y. M. Xie and X. Q. Yu, Chem. Commun., 2014, 50, 8640–8643 RSC.
- Y. Gan, G. Yin, X. Zhang, L. Zhou, Y. Zhang, H. Li and P. Yin, Talanta, 2021, 225, 122030 CrossRef CAS.
- H. Ren, F. Huo and C. Yin, New J. Chem., 2021, 45, 4724–4728 RSC.
- B. Wang, F. Zhang, S. Wang, R. Yang, C. Chen and W. Zhao, Chem. Commun., 2020, 56, 2598–2601 RSC.
- H. Zhang, X. Yin, J. Hong, Y. Deng and G. Feng, Talanta, 2021, 223, 121768 CrossRef CAS PubMed.
- D. Zhang, S. Guo, L. Li and K. Shang, Analyst, 2020, 145, 7477–7487 RSC.
- S. Dong, L. Zhang, Y. Lin, C. Ding and C. Lu, Analyst, 2020, 145, 5068–5089 RSC.
- T. Yudhistira, S. V. Mulay, Y. Kim, M. B. Halle and D. G. Churchill, Chem. Asian. J., 2019, 14, 3048–3084 CrossRef CAS PubMed.
Footnotes |
| † Electronic supplementary information (ESI) available. See DOI: 10.1039/d1ra04082k |
| ‡ These two authors contributed equally to this work. |
| This journal is © The Royal Society of Chemistry 2021 |


