 Open Access Article
Enhanced toluene adsorption/desorption dynamic performances over modified USY zeolites after an aqueous ammonia treatment†
Shan Gaoab,
Yuanru Liaoa,
Yaoyu Zhanga,
Yue Liu *ab and
Zhongbiao Wu
 ab
ab
aDepartment of Environmental Engineering, Zhejiang University, 866 Yuhangtang Road, Hangzhou, 310058, P. R. China. E-mail: yueliu@zju.edu.cn; Fax: +86 87953088; Tel: +86 571 87953088
bZhejiang Provincial Engineering Research Center of Industrial Boiler & Furnace Flue Gas Pollution Control, 866 Yuhangtang Road, Hangzhou, 310058, P. R. China
First published on 29th September 2021
Abstract
The dynamic adsorption/desorption performances of modified hierarchical USY zeolites treated with an ammonia solution (NH4OH) at different concentrations were investigated using gas-phase toluene as an indicator. The characterization results indicated that the ammonia treatment could result in the expansion of microporous channels and the formation of a mesoporous structure without evident decrease in crystallinity. The experiment results regarding dynamic adsorption/desorption performances revealed that the mass transfer resistance of modified USY adsorbents were greatly reduced treating with NH4OH. Among the modified samples, the 0.1 mol L−1 NH4OH treated USY adsorbent exhibited large adsorptive capacity and highest desorption rate, which show good cyclic performance that could preserve its adsorbent capacity after 20 cycles. In contrast, pristine USY samples had lost around 28% of the initial adsorption capacity after 20 cycles. Moreover, the NaOH-treated sample showed great crystallinity decline compared to the NH4OH-treated samples due to excessive silicon atom leaching from the USY framework, and had lower adsorption capacity under humid conditions. Therefore, NH4OH-modified USY zeolites could be promising adsorbents for the adsorption/desorption process of volatile organic compounds (VOCs).
Introduction
Volatile organic compounds (VOCs) are known as one of the major causes of the formation of photochemical ozone and secondary organic aerosol (SOA), which could result in harmful health effects and serious environmental problems.1,2 VOCs emission control has become one of the thorniest environmental challenges in numerous industrial processes. There are numerous technologies available for eliminating VOCs, among which adsorption enrichment-combustion technology has been considered as a reliable method owing to the advantages including high efficiency, energy saving and relatively low operating cost for industrial source, and adsorption enrichment-combustion is especially suitable for treating VOCs emissions with low concentration and large gas flow rate.3–6For the VOC adsorption enrichment process, activated carbon is one of the widespread sorbents due to its developed microporosity, which ensures excellent adsorption capacities.4 However, the limitation of activated carbon applications is its sensitivity towards high temperatures, difficult regeneration and hygroscopicity.7 Therefore, developing different alternative adsorbents is desirable to overcome these problems. Zeolites as sort of aluminosilicates, possessing unique physiochemical properties, such as ordered porosity, thermal stability, and non-flammable, and show promising potential for adsorption applications.8 Metal–organic frameworks (MOFs) and zeolitic imidazolate frameworks (ZIFs) are new and advanced porous materials for adsorbents, with tremendous flexibility in equipping the porous material with specific physical characteristics and chemical functionalities.9–11 Taking into consideration both the functionality and the cost, USY (ultra-stable Y) zeolites are highly dealuminated with a stable siliceous 12-membered ring framework, which has been proved to have a great affinity towards various VOCs.12 However, the complete desorption temperature of Y zeolites was reported over 350 °C for toluene,13 which could be attributed to the diffusion limitation due to the high proportion of microspores. This would result in the inhibition of its real application.
It was pointed out by the previous study that expanding the pore diameter of zeolites can effectively reduce the diffusion resistance and thus decrease the desorption regeneration temperature.14,15 Currently, a series of synthetic approaches are available to reduce the diffusion restriction of absorbents, where post-synthesis modification particularly the alkaline treatment has been found to be a convenient and efficient way to generate intracrystalline mesopores by the hydrolysis of Si atoms.16–18 However, for VOC adsorption, the over-desilication of zeolites may somewhat lower its adsorption capacity, for excessive desilication would do harm to the structure of the framework.19 As such, synthesis parameters during the modification process should be carefully tuned to obtain the superior comprehensive performance for VOC adsorption/desorption enrichment.
In this study, we focused on the synthesis of hierarchical USY zeolites using an ammonia solution at different concentrations as well as NaOH solution for a comparison. Also, toluene (typically seen in VOCs emission) was employed herein for experimental dynamic adsorption/desorption experimental tests. The relative characterizations were also performed to reveal the structure–performance relationship. The aim of this study is to explore the promising adsorbent with both large adsorption and well desorption capabilities.
Experimental
Synthesis procedure
A pristine USY zeolite (bulk Si/Al = 22, Na-form) was purchased from Tianjin Yuan Li Chemical Co., Ltd. The solid (1.0 g) was added to an aqueous ammonia or sodium hydroxide solution (0.1 mol L−1, 100 mL g−1) and the solution was mechanically stirred at 250 rpm for 1 h. The mixture was immediately filtered and washed (three times) with distilled water, the retained solid was dried overnight at 80 °C, and then the dried solid was weighed to calculate the mass loss. Subsequently, the samples were calcined under a nitrogen flow (2 mL s−1 g−1) at 350 °C for 2 h at the heating rate of 2 °C min−1. The samples are denoted as 0.02NH4OH, 0.1NH4OH, 0.2NH4OH, 0.1NaOH for the USY zeolite treated with 0.02 mol L−1 aqueous ammonia, 0.1 mol L−1 aqueous ammonia, 0.2 mol L−1 aqueous ammonia and 0.1 mol L−1 sodium hydroxide solutions, respectively.Materials characterizations
Powder XRD patterns were recorded on Rigaku D/MAX RA X at 40 kV and 40 mA using a Cu Kα radiation at the 2θ range from 0.5 to 50°. The adsorption–desorption isotherms of nitrogen were obtained at 77 K using the surface area and porosity measurement system (JW-BK132F, Beijing JWGB Sci.& Tech. Co., Ltd, Beijing, China), and the samples were degassed under vacuum conditions at 200 °C for 2 h before measurements. The specific surface areas of the samples were calculated using the multiple-point Brunauer–Emmett–Teller (BET) method with P/P0 range from 0.01 to 0.2. The total pore volumes (Vtotal) were calculated at a relative pressure of 0.99, and the pore size distributions were determined using the Barrett–Joyner–Halenda (BJH) method. The micropore volumes (Vmicro) and micropore surface areas (Smicro) were calculated using the t-plot method.Measurements for adsorption–desorption performances
Dynamic adsorption experiments were carried out by the following steps: the as-synthesized powder samples were first crushed and sieved from 40 to 60 mesh, and then 100 mg sample was put in a fixed adsorbent bed with an inner diameter of 6 cm and height of 230 cm, as shown in Fig. 1. After that, the sample was pre-treated at 300 °C for 1 h under N2 flow before test to degas contaminants (e.g., water, organic residues) from the solid surface. The adsorption tests were then performed with a gas flow of 500 ppm toluene (balanced with N2) at 30 °C. The total gas flow rate was kept at 50 sccm (standard cubic centimeters per minute). The dynamic equilibrium adsorption capacity (q) was calculated by integrating breakthrough curves as the equation20 shown below:
 | (1) |
The desorption measurement was carried out in a constant-temperature hot-air desorption facility (as shown in Fig. 1). The samples after saturated adsorbed were added into the sample crucible hanging in a hot chamber equipped with an analytical balance. Also, the hot chamber was put in an oil bath to keep the temperature at 200 °C. During the test, a nitrogen flow (20 sccm) controlled via the mass flow meter was introduced into the heating chamber through a gas heating pipe for preheating. The desorption rate was obtained by measuring the real-time weight loss of the samples via an analytical mass balance.
Results and discussion
Characterizations of the adsorbents
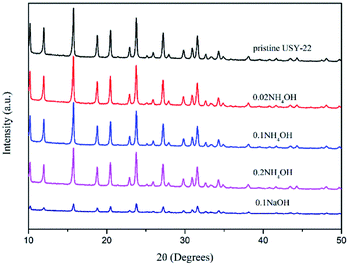
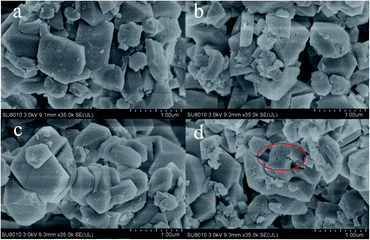
The XRD patterns of the NH4OH-treated adsorbents together with pristine USY and NaOH-treated sample are shown in Fig. 2. The XRD peaks indicated a typical faujasite topology of the USY structure for all the samples.21,22 Also, it could be also obtained that the peak intensity gradually decreased with an increase in the ammonia content, which indicated that the loss of crystallinity is due to the desilication process with the alkaline treatment. The NaOH-treated sample showed a more serious damage in the crystal structure compared to NH4OH treated one at the same content. For instance, after the 0.1 mol L−1 NaOH treatment, more than 70% relative XRD crystallinity reduction was detected, while that was around 15% for the 0.1 mol L−1 NH4OH treated sample. The morphologies of the samples were then characterized by scanning electron microscopy (SEM) (Fig. 3). It could be found that the particle shape and size were well preserved, even after the NaOH solution treatment. However, the occurrence of corrosive ‘pits’ could be observed, particularly after the NaOH solution treatment. This should be the results from the dissolution of the silicon atoms in the framework after the alkaline treatment.23–25The textural properties of all the samples are listed in Table 1. It could be seen that the specific surface area and pore volume of each sample after the alkali treatment improved compared with pristine USY zeolite. Among all the samples, the 0.1 mol L−1 NH4OH treated samples possessed the largest surface area and pore volume. Furthermore, the mass loss rate of the sample was less than 3 wt% after the ammonia treatment, indicating the preservation of the USY crystal structure. However, the NaOH-treated sample showed a much higher mass loss (more 10%) owing to the excessive silicon leaching. The pore size distribution (shown in Fig. 4) further revealed that the alkali treatment has a significant pore-enlarging effect on the USY zeolite, and mesopores can be introduced successfully. The pores of the pristine USY zeolites are mainly distributed at around 0.56 nm. After treatment with alkali solutions, the size of micropores significantly shifted to a higher scale (ranged from 0.6 to 0.7 nm) with the pore volume increased as well. Simultaneously, numerous mesopores (2–5 nm) emerged in the sample with the alkaline treatment. The N2 adsorption–desorption isotherms (see Fig. S1†) showed that the alkaline-treated samples except pristine USY zeolite exhibit type IV isotherms, indicating their mesoporous structure.26 Moreover, it could be seen that the NaOH treated sample showed a little bit lower pore size compared to ammonia treated ones. This could be attributed to the reason that the increase in the silicon dissolution rate in the framework may block the micropore channels to a certain degree.27
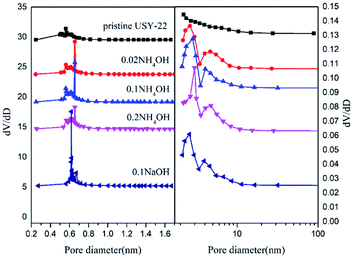 | ||
| Fig. 4 The micropore and mesoporous pore size distributions of USY samples before (pristine USY) and after the alkali treatment at different concentrations. | ||
Dynamic adsorption performances
Fig. 5 presents the breakthrough curves of different samples to clarify the dynamic performances of toluene adsorption. The effects of the NH4OH treatment on the adsorption capacity showed two different aspects. First, the improved textural properties would increase the adsorption sites, thereby promoting toluene adsorption. On the other hand, the dissolution of Si atoms with the alkaline treatment weakened the affinity between toluene and the adsorbent framework, which thereby decreasing the adsorption capacity of toluene. Therefore, the samples after the alkaline treatment did not show evident changes in saturated adsorption capacity compared to pristine USY adsorbent (147.6–169.3 mg g−1, see Table 2). Furthermore, it could be clearly seen in Fig. 5 that there are more number of narrow adsorption zones for alkali-treated adsorbents than that for the pure USY zeolite, indicating a decrease in the mass transfer resistance. As interpreted above, the alkali treatment would result in the expansion of micropores and introduction of mesopores. Hence, the adsorption diffusion rate of toluene molecule over adsorbent particles was greatly increased. In order to better understand the adsorption behaviors, the experimental results in Fig. 5 were further fitted by a mathematic adsorption model proposed by Yoon and Nelson28 according to the following equation:
 | (2) |
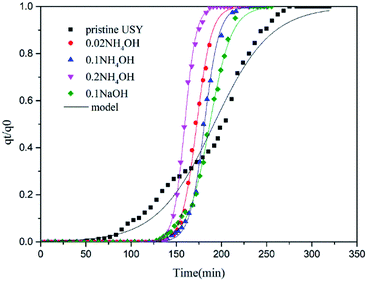 | ||
| Fig. 5 Breakthrough curves and mathematic model for USY samples before (pristine USY) and after the alkali treatment. | ||
| Samples | Adsorption capacity (mg g−1) | Adsorption capacity under humid condition (RH = 30%) (mg g−1) | Decline percentage (%) |
|---|---|---|---|
| USY-22 | 169.3 | 142.6 | 15.8 |
| 0.02NH4OH | 157.0 | 139.2 | 11.3 |
| 0.1NH4OH | 164.3 | 146.6 | 10.7 |
| 0.2NH4OH | 147.6 | 140.7 | 4.7 |
| 0.1NaOH | 167.0 | 127.6 | 23.6 |
In actual industrial conditions, the presence of water vapor is unavoidable. As it was reported, there would be competitive adsorption between water vapor and VOCs over zeolites.20,29,30 Therefore, the adsorption performance of alkali-treated samples under humid conditions was also investigated (see Fig. S2†), and their relative saturated adsorption amounts are given in Table 2. It could be seen that the adsorption capacity of all the samples decreased with water vapor addition. Actually, the dissolution of silicon enhances the polarity of the adsorbent, leading to its enhanced affinity to water and the decline in the toluene adsorption capacity. Moreover, the adsorption capacity of the NaOH-treated sample dropped most obviously (decreased by ca. 20.7%, as shown in Table 2), which is attributed to the excessive dissolution of silicon.
Dynamic desorption performances
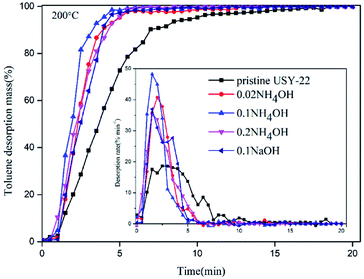
Regeneration ability is of great importance for evaluating adsorbents' practical performances in adsorption–desorption enrichment applications. To identify alkali-treated USY samples desorption capabilities, constant thermal flow desorption experimental tests were conducted, and the results are presented in Fig. 6. It could be clearly found that the pristine USY zeolite sample exhibited longer regeneration time and lower desorption rate at 200 °C than the alkaline treated samples. After the alkaline treatment, the toluene elution time of each sample was brought forward, the peak of desorption rate was increased and the width of desorption peak was narrowed. This fact indicated that their thermal desorption performance at 200 °C was significantly improved. For example, the 0.1 mol L−1 NH4OH-treated sample could be recovered completely within 5 min, while that would be extended to around 10 min for the pristine USY zeolite. The main reason of the improved desorption rate could be attributed to the reduction of mass transfer resistance by introducing mesoporous channels and especially enlarging the pore size of micropores with alkali treatment. Moreover, the desilication process with the alkali treatment led to the decline of affinity between toluene and USY framework, which would also facilitate the desorption process. The 0.1 mol L−1 ammonia solution treated sample exhibited the highest desorption rate, which might be due to its relative larger size of microscale pores (see Fig. 4), as the mass transfer inner micropores is the rate controlling step of adsorption.Adsorption/desorption cyclic performances
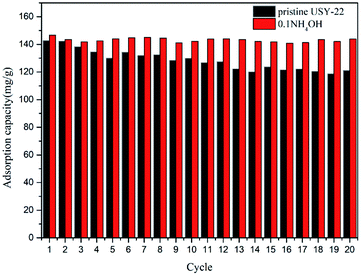
Stable cyclic performance was crucial for practical use. To investigate the multi-cycle behaviors of the 0.1NH4OH sample, 20 adsorption/desorption cycles were employed. Each cycle was conducted in two stages, with a toluene adsorption step under 50 sccm 500 ppm toluene feed gas at 30 °C until saturation and regeneration step under N2 flow at 200 °C for 5 min. The amount of the toluene adsorption capacity for each cycle is shown in Fig. 7. It revealed that the 0.1 mol L−1 NH4OH-treated sample showed a well cyclic stability in comparison with the pristine USY zeolite. For the pristine USY sample, the toluene capacities decreased gradually and showed a loss of more than 28% after 20 cycles. In contrast, the NH4OH-treated adsorbent exhibited much better reversible adsorption performance, almost preserving its initial capacity. This was obviously the result from the speed up of mass transfer rate owing to the improved pore-structure after the ammonia solution treatment.Conclusions
In this study, the dynamic toluene adsorption–desorption behaviors over modified hierarchical USY zeolites via the ammonia solution treatment were investigated. The main conclusions could be drawn as follows:(1) NH4OH treatment could introduce the mesoporous structure into USY samples and enlarge the micropore size without destroying their main crystal structure, where the specific surface area, pore volume and pore size all increased. In contrast, the NaOH treatment would somewhat damage the crystal structure of USY due to over dissolution of the silicon atoms from the framework.
(2) The effects of the NH4OH treatment on adsorption capacity showed two different aspects. First, the improved textural properties raised the adsorbed sites, thereby promoting the toluene adsorption. Second, the dissolution of silicon weakened the affinity between toluene and adsorbent framework, leading to the decrease in adsorption capacity. As such there are no evident changes in adsorption capacity after the NH4OH treatment. In addition, the second effect would be more serious for the NaOH-treated sample particularly under humid conditions with a decrease in more than 20% in adsorption capacity.
(3) The mass transfer resistance was found greatly reduced after the NH4OH treatment owing to the improved micro- and meso-structure. As such, the adsorption–desorption process could be accelerated. For instance, the adsorbed capacity of the 0.1 mol L−1 NH4OH treated sample could be regenerated within 5 min and revealed superior cyclic stability. After 20 adsorption–desorption cycles, its adsorptive capacity could almost be preserved, while more than 28% of the initial capacity was lost for the pristine USY zeolite.
Conflicts of interest
There are no conflicts to declare.Acknowledgements
This work was supported by the National Key Research and Development Program of China (2017YFC0210201) and the Program for Zhejiang Leading Team of S&T Innovation (No. 2013TD07).References
- D. Das, V. Gaur and N. Verma, Carbon, 2004, 42, 2949–2962 CrossRef CAS.
- A. Fuertes, G. Marban and D. Nevskaia, Carbon, 2003, 41, 87–96 CrossRef CAS.
- H. Yamauchi, A. Kodama, T. Hirose, H. Okano and K.-I. Yamada, Ind. Eng. Chem. Res., 2007, 46, 4316–4322 CrossRef CAS.
- J. Yang, Y. Chen, L. Cao, Y. Guo and J. Jia, Environ. Sci. Technol., 2012, 46, 441–446 CrossRef CAS PubMed.
- H. Zaitan, M. H. Manero and H. Valdés, J. Environ. Sci., 2016, 41, 59–68 CrossRef CAS PubMed.
- X. Zhang, B. Gao, A. E. Creamer, C. Cao and Y. Li, J. Hazard. Mater., 2017, 338, 102–123 CrossRef CAS PubMed.
- J. Zhu, J. Chen, P. Zhuang, Y. Zhang, Y. Wang, H. Tan, J. Feng and W. Yan, Atmos. Pollut. Res., 2021, 12, 1–11 CrossRef CAS.
- Y. Qin, Y. Wang, H. Wang, J. Gao and Z. Qu, Procedia Environ. Sci., 2013, 18, 366–371 CrossRef CAS.
- K. V. Kumar, G. Charalambopoulou, M. Kainourgiakis, A. Gotzias, A. Stubos and T. Steriotis, RSC Adv., 2014, 4, 44848–44851 RSC.
- A. Gotzias, Phys. Chem. Chem. Phys., 2017, 19, 871–877 RSC.
- A. G. Kontos, G. E. Romanos, C. M. Veziri, A. Gotzias, M. K. Arfanis, E. Kouvelos, V. Likodimos, G. N. Karanikolos and P. Falaras, Appl. Surf. Sci., 2020, 529, 147058 CrossRef CAS.
- H. Cheng and M. Reinhard, Environ. Sci. Technol., 2006, 40, 7694–7701 CrossRef CAS PubMed.
- W. Zhang, Z. Qu, X. Li, Y. Wang, D. Ma and J. Wu, J. Environ. Sci., 2012, 24, 520–528 CrossRef CAS.
- D. Verboekend and J. Pérez-Ramírez, Catal. Sci. Technol., 2011, 1, 879–890 RSC.
- T. Masuda, Y. Fujikata, T. Nishida and K. Hashimoto, Microporous Mesoporous Mater., 1998, 23, 157–167 CrossRef CAS.
- J. Van Aelst, M. Haouas, E. Gobechiya, K. Houthoofd, A. Philippaerts, S. P. Sree, C. E. Kirschhock, P. Jacobs, J. A. Martens and B. F. Sels, J. Phys. Chem. C, 2014, 118, 22573–22582 CrossRef CAS.
- J. Van Aelst, D. Verboekend, A. Philippaerts, N. Nuttens, M. Kurttepeli, E. Gobechiya, M. Haouas, S. P. Sree, J. F. Denayer and J. A. Martens, Adv. Funct. Mater., 2015, 25, 7130–7144 CrossRef CAS.
- D. Verboekend and J. Pérez-Ramírez, ChemSusChem, 2014, 7, 753–764 CrossRef CAS PubMed.
- Y. Fang, F. Yang, X. He and X. Zhu, Front. Chem. Sci. Eng., 2019, 13, 543–553 CrossRef CAS.
- H. Wang, T. Wang, L. Han, M. Tang, J. Zhong, W. Huang and R. Chen, J. Mater. Res., 2016, 31, 516–525 CrossRef CAS.
- P. Bodzioch, K. Dymek, R. Jędrzejczyk, D. Chlebda, J. Łojewska, M. Sitarz, G. Kurowski, P. Jeleń and P. Jodłowski, Spectrochim. Acta, Part A, 2020, 230, 118060 CrossRef PubMed.
- W. Lutz, R. Bertram, D. Heidemann, R. Kurzhals, C. Rüscher and G. Kryukova, Z. Anorg. Allg. Chem., 2011, 637, 75–82 CrossRef CAS.
- J. C. Groen, S. Abelló, L. A. Villaescusa and J. Pérez-Ramírez, Microporous Mesoporous Mater., 2008, 114, 93–102 CrossRef CAS.
- J. C. Groen, R. Caicedo-Realpe, S. Abelló and J. Pérez-Ramírez, Mater. Lett., 2009, 63, 1037–1040 CrossRef CAS.
- J. Pérez-Ramírez, S. Abello, A. Bonilla and J. C. Groen, Adv. Funct. Mater., 2009, 19, 164–172 CrossRef.
- P. Pérez-Romo, H. Armendáriz-Herrera, J. S. Valente, M. de Lourdes Guzmán-Castillo, F. Hernández-Beltrán and J. J. Fripiat, Microporous Mesoporous Mater., 2010, 132, 363–374 CrossRef.
- D. Verboekend and J. Pérez-Ramírez, Chem.–Eur. J., 2011, 17, 1137–1147 CrossRef CAS PubMed.
- Y. H. Yoon and J. H. Nelson, Am. Ind. Hyg. Assoc. J., 1984, 45, 517–524 CrossRef CAS PubMed.
- Z. Wang, H. Lu, B. Zhang and Y. Chen, Chin. J. Environ. Eng., 2010, 11, 2566–2570 Search PubMed.
- Y. Zhou, H. Lu, Z. Wang and Y. Chen, Chin. J. Environ. Eng., 2012, 5, 1653–1657 Search PubMed.
Footnote |
| † Electronic supplementary information (ESI) available: Nitrogen adsorption–desorption isotherms; breakthrough curves. See DOI: 10.1039/d1ra04034k |
| This journal is © The Royal Society of Chemistry 2021 |


