 Open Access Article
Physical and photocatalytic properties of sprayed Dy doped ZnO thin films under sunlight irradiation for degrading methylene blue†
G. El Fidhaab,
N. Bitrib,
F. Chaabounib,
S. Acosta c,
F. Güelld,
C. Bittencourt
 c,
J. Casanova-Chafer
 e and
E. Llobet
 *e
*e
aUniversité de Tunis, École Nationale Supérieure d'ingénieurs de Tunis, Avenue Taha Hussein Montfleury, 1008 Tunis, Tunisia
bUniversité de Tunis El Manar, Ecole Nationale d'Ingénieurs de Tunis, Laboratoire de Photovoltaïque et Matériaux Semi-conducteurs, 1002 Tunis, Tunisia
cChimie des Interactions Plasma-Surface (ChIPS), Research Institute for Materials Science and Engineering, Université de Mons, 7000, Mons, Belgium
dENFOCAT-IN2UB, Universitat de Barcelona, C/Martí i Franquès 1, 08028 Barcelona, Spain
eMINOS, Universitat Rovira i Virgili, Avda. Països Catalans, 26, 43007, Tarragona, Spain. E-mail: eduard.llobet@urv.cat
First published on 16th July 2021
Abstract
Dysprosium-doped zinc oxide (ZnO) thin films have been prepared through spray pyrolysis onto glass substrates. Cross-sections of the deposited thin films were assessed through Scanning Electron Microscopy (SEM), showing thicknesses between 200 and 300 nm. The thin film roughness was evaluated using the obtained images from the Atomic Force Microscope (AFM) micrographs. The crystallographic structure of the samples was analyzed by X-ray diffraction (XRD) revealing polycrystalline thin films. However, the slight shift towards a higher 2θ angle in Dy-doped ZnO films as compared to the pure ones indicates the incorporation of Dy3+ into the ZnO crystal lattice. The analysis of the oxidation state via X-ray photoelectron spectroscopy (XPS) confirms the incorporation of Dy ions in the ZnO matrix. Besides, UV-Vis-NIR spectrophotometry analysis and photoluminescence (PL) spectroscopy showed that bandgap energy values of ZnO decreased when dysprosium doping increased. Therefore, Dy doped ZnO thin films can be potentially used as a solar-light-driven photocatalyst. Among the different doping yields, the ZnO doped with 6% dysprosium provides the highest degradation rate for methylene blue (MB) under solar irradiation. Specifically, 9% of dye degradation was achieved under sunlight irradiation for 120 minutes.
1. Introduction
Population growth and the waste from heavy industry have resulted in increasing problems linked to environmental pollution, such as water pollution. Therefore, this pollution constitutes a key challenge nowadays, requiring much research effort to tackle it. For instance, the use of renewable natural resources has been established as a promising method for the degradation of organic and toxic pollutants in wastewater. In particular, photocatalysis has been revealed as one of the most advanced and effective technologies for eliminating dangerous and non-biodegradable chemicals from the environment.1 In this regard, titanium dioxide (TiO2) and zinc oxide (ZnO) are the most widely employed semiconductors because they are inexpensive, abundant and relatively clean photocatalysts for photochemical degradation.2 Previous reports have demonstrated the superior photocatalytic activity of ZnO as compared to TiO2 because it absorbs a larger fraction and quanta of the sunlight spectrum than TiO2. In consequence, ZnO usually exhibits a higher degradation capability of organic pollutants than TiO2 under solar irradiation.3,4Zinc oxide is an n-type semiconductor belonging to the II–VI group. In its wide variety of forms, it has attracted great attention due to its outstanding chemical and physical properties, including high chemical stability.5 ZnO is a multi-functional metal oxide semiconductor material with high transparency in the visible region, wide-direct bandgap around 3.3 eV and high excitation energy of 60 eV.6 These properties are quite favorable for optoelectronic applications, photovoltaic conversion, microelectronics, solar cells, gas sensing, light-emitting diodes (LEDs) and photodetectors.7–9 ZnO shows potential for developing photocatalytic applications, namely, the decomposition of organic pollutants and harmful dyes in water. Additionally, ZnO gathers the requirements needed for this application since it is stable in nature and presents high electronic mobility.10
More noticeably, many research efforts have been directed towards enhancing the photocatalytic efficiency of ZnO, proving that increasing the surface defects of the metal oxide induces a shift of the absorption towards the visible light, which increases the efficiency of pollutant degradation under visible light irradiation. Recently, more attention is being directed towards the metal doping of ZnO.11 In particular, doping with rare-earth (RE) ions has attracted great interest due to their highly conductive, magnetic, electrochemical and luminescent properties, which are based on the electronic transitions occurring within 4f energy shells.12 It has been shown that rare-earth metal doping effectively shifts the absorption to the visible light region and inhibits the recombination of photogenerated charged species, which are favorable conditions for photocatalysis applications.13
In previous studies, several rare-earth ions were used to dope ZnO such as Gd3+,14 Tb3+ (ref. 15) or Ce3+.16 Among RE ions, Dy3+ doped ZnO has attracted great interest in photocatalytic applications due to its action as an effective scavenger for electrons in the conduction band of ZnO, slowing the recombination rate of charge carriers. This is translated into an enhancement of the photocatalytic activity of ZnO. In this setting, it was already reported that upon doping of ZnO with Ln ions (where Ln might be La, Eu, Gd, Dy and Ho), a complex formation takes place with the interaction of Lewis base and f-orbitals of Ln3+ ions.17 Thus, Ln3+ ions are charged, allowing the concentration of organic pollutants on the ZnO surface. Besides, the use of Dy has been demonstrated as a good candidate for photocatalytic application using the sol–gel method.18 This is explained by the increasing of OH radicals used in the degradation of dye molecules produced by the involvement of f orbitals in delaying electron–hole pair recombination and energy transfer in the photonic process.
Previous works reported the MB degradation using photocatalysts based on ZnO thin films doped with Sn,19 Sr,20 Co,21 Nb-Al22 or Nd.23 The choice of nanomaterials with significant photocatalytic activity is a key parameter,24,25 especially those water-stable for being considered as a potential option to be employed in commercial applications.26 However, not limited to the nanomaterials employed, Y. C. Chen and collaborators demonstrated that different nanostructure morphologies show variable photocatalytic activities owing to divergent efficiencies towards dye degradation.27 Thereby, a wide range of possibilities is available to tune the photocatalytic activity of the sensitive layers.
To the best of our knowledge, MB is one of the dyes present in wastewater from textile industries. MB can cause negative effects on the environment since it prevents sunlight from entering the body of water affecting organisms in the aquatic environment. Ingestion of MB may cause a burning sensation which leads to vomiting and can as well produce eye burnt resulting in permanent injury.28 Since solar energy is a sustainable energy source, the use of photocatalytic nanomaterials is a promising technology for industrial wastewater treatments as dye degradation.29 However, several parameters as light intensity, environmental temperature, or pH of the medium can impact significantly the efficiency of the photocatalysis processes.30 Therefore, photocatalysts should ideally gather several properties such as long-term stability under variable operational conditions, specificity towards the water pollutants, and high absorption coefficient to optimize the solar spectrum harvesting.31
This paper reports the enhancement effect of doping ZnO with dysprosium on the sunlight photocatalytic activity of thin films prepared using a spray pyrolysis technique. There is no previous systematic study of preparing ZnO doped Dy thin films via spray pyrolysis. The use of this technique shows significant advantages as compared to other methods, such as their simplicity of operation, inexpensiveness and easiness for being scaled up to mass production, leading to potential commercial applications. This paper analyzes the photocatalytic activity of the Dy doped ZnO thin films by assessing their ability to degrade methylene blue dye under natural renewable energy. The use of rare-earth doped ZnO nanomaterials for photocatalysis purposes is generally assessed by using UV or visible lamps under laboratory conditions. Nonetheless, the present work shows a degradation efficiency comparable to those already published by using natural sunlight irradiation. This fact would pave the way to degrade water pollutants as MB at industrial scale.
2. Experimental details
2.1. Preparation of undoped and Dy-doped ZnO thin films
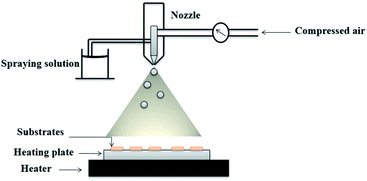
Undoped and Dy doped ZnO thin films were deposited by chemical spray pyrolysis using an aqueous solution onto glass substrates. Before spraying the solution, the glass substrates with a dimension of 2 × 2 cm2 were cleaned with a detergent, rinsed in acid, distilled water, acetone and finally dried in a furnace at 120 °C for 15 min.The spray solution was prepared by dissolving 0.05 M zinc chloride [ZnCl2·2H2O, Sigma Aldrich ≥% 99] in 200 ml distilled water. Whereas for the Dy doped ZnO thin films, dysprosium chloride (DyCl3·2H2O, Sigma Aldrich) was added to the precursor solution at fixed [Dy]/[Zn] concentration ratios of 2, 4 and 6 wt%. The solution was stirred for a few minutes to obtain a homogeneous solution, then sprayed for 40 minutes through a path along the axes (x,y). The deposition temperature was fixed at 400 °C, controlled using a thermocouple related to the hot plate. The distance between the nozzle and the substrate was set to 20 cm. Compressed air was used as carrier gas at a constant flow rate of 10 ml min−1, while the rate solution flow was fixed at 2 ml min−1. These two parameters control the droplet size in such a way that the pyrolytic decomposition of the droplets takes place on the surface of the substrates to form thin films. Fig. 1 depicts a scheme of the spray pyrolysis method used.
2.2. Characterization of the thin films
After spraying, the study of the morphological properties and elemental compositions for the different samples was carried out using electron scanning microscopy (SEM) equipped with energy dispersive spectroscopy (EDX). The measurement of the surface root mean square (RMS) roughness of the films was obtained using atomic force microscopy (AFM) (Dimension Icon, Bruker) operated in intermittent contact mode. The phase purity and the crystal structure of the samples were analysed using X-ray diffraction (XRD) (Philips X'Pert) with a copper source (Cu-Kα radiation, λ = 0.154187 Å) in the 2θ range of 20–70°.The chemical composition of the samples and oxidation state of the ions were evaluated through X-ray photoelectron spectroscopy (XPS) using a Versaprobe PHI 219 5000 from Physical Electronics, equipped with a monochromatic 220 Al Kα X-ray source. The transmittance and reflectance measurements were carried out using a Shimadzu-UV1800 spectrophotometer in the range of 300–1800 cm. PL measurements were made using a chopped Kimmon IK Series He–Cd laser (325 nm and 40 mW). Fluorescence was dispersed with an Oriel Corner Stone 1/8 74![[thin space (1/6-em)]](https://www.rsc.org/images/entities/char_2009.gif) 000 monochromator, detected using a Hamamatsu H8259-02 with a socket assembly E717-500 photomultiplier, and amplified through a Stanford Research Systems SR830 DSP.
000 monochromator, detected using a Hamamatsu H8259-02 with a socket assembly E717-500 photomultiplier, and amplified through a Stanford Research Systems SR830 DSP.
2.3. Photocatalytic experiment
For the measurement of the photocatalytic activity, methylene blue was chosen as an organic pollutant. Its degradation under solar irradiation for different doping yields and exposure times was studied. An aqueous solution of MB with a concentration of 3 mg L−1 was stirred a few minutes. Afterwards, pure and Dy doped ZnO layers (2%, 4% and 6%) were placed on 4 glass boxes containing 30 ml of MB solution and were magnetically stirred and kept under dark conditions for 30 minutes. In that way, it is possible to guarantee the adsorption/desorption equilibrium between the photocatalyst and the dye. Then, they were exposed to sunlight irradiation for 2 hours, while an aliquot of 3 ml was taken every 30 min. Considering that photocatalytic experiments were conducted in Tunis (Tunisia; latitude 10.18°) using the direct sunlight, the MB photodegradation was performed under a power that is estimated to range from 180 to 230 W m−2.32The evaluation of the degradation of the methylene blue was studied using a Shimadzu-UV1800 spectrophotometer. This experiment was repeated three times to ensure the certainty responses of the photocatalyst. The absorption was monitored in the wavelength range of 400–900 nm, showing a decrease in the peak intensity at 660 nm. The photocatalytic degradation rate was calculated by using the following equation:33
| % photodegradation rate = (A0 − A)/A0 | (1) |
3. Results and discussion
3.1. Morphological analysis
Atomic force microscopy was used to evaluate the surface roughness of samples with different Dy dopant concentrations. Fig. 2 shows the two (2D) and three (3D) dimensional AFM micrographs. The images show that the surface morphology of the ZnO:Dy films are granular and consist of spherical, agglomerated, dense and compact grains. It can be observed that, the morphology does not significantly change for ZnO samples doped up to 4%.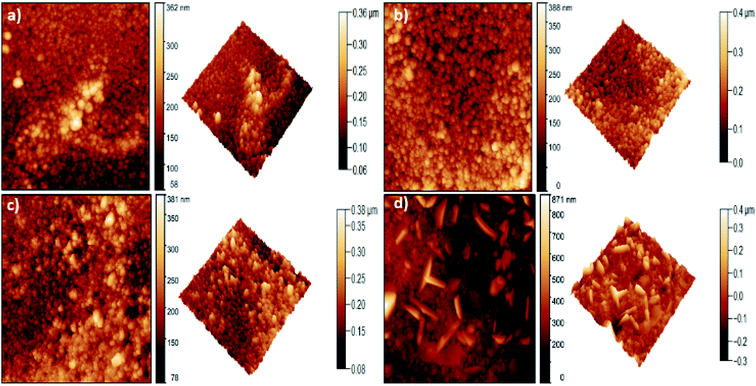 | ||
| Fig. 2 2D (left side) and 3D (right side) AFM topography for (a) undoped ZnO, (b) ZnO:Dy 2%, (c) ZnO:Dy 4% and (d) ZnO:Dy 6% thin films. | ||
However, a change in the morphology of the samples doped at 6% is clearly visible. At this dopant level, the particles become non-uniform and a few sharp columnar features can be observed. This can be explained by the possibility of growth and coalescence of grains during the spray pyrolysis process.34
Moreover, dysprosium-doping leads to an increase in the surface roughness (Table 1) from 21 nm for undoped ZnO up to 73 nm for ZnO doped at 6%. Higher roughness in thin films is one of the advantages of the spray technique. Allowing to enhance the adsorption of dye molecules at the surface, favorable for the photocatalytic degradation.
| Sample | Pure | Dy 2% | Dy 4% | Dy 6% |
|---|---|---|---|---|
| Roughness (nm) | 21.66 | 32.38 | 31.68 | 73.08 |
| Thickness (nm) | 200 | 220 | 235 | 280 |
| [Dy/Zn] (%) | 0.0 | 1.9 | 4.6 | 6.2 |
| Eg (eV) | 3.22 | 3.07 | 3.13 | 2.93 |
| Eu (meV) | 509 | 556 | 680 | 734 |
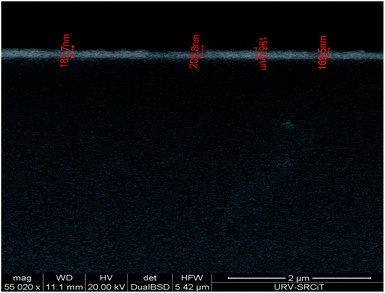
SEM images were performed for both, doped and undoped ZnO (Fig. S1, ESI†). Besides, the film thicknesses were estimated by measuring the cross-section of the SEM images. It was found that the different ZnO films were about 200–300 nm thick. Fig. 3 presents an example of the cross-section of an SEM image for a pure ZnO thin film. The value of the thickness increases as the percentage of doping increases. These results are probably related to the higher roughness registered for higher Dy content.
3.2. Structural and compositional analysis
XRD patterns of all as-deposited samples, pure and Dy3+ doped (2%, 4% and 6%) ZnO films are shown in Fig. 4a. All films present sharp diffraction peaks indicating a suitable crystallinity, with a preferential crystal growth along the (002) plane.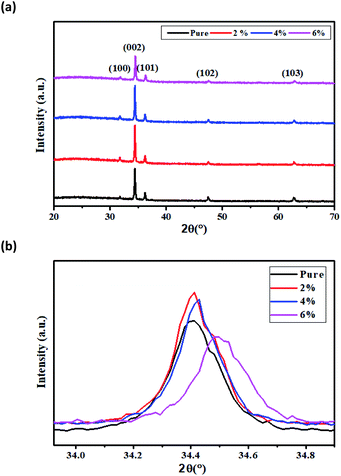 | ||
| Fig. 4 (a) X-ray diffraction spectra of Dy doped ZnO thin films. (b) Shifting of the main diffraction angle with increasing doping concentrations. | ||
The patterns exhibited multiple peaks of pure ZnO phases with other orientations such as (100), (101), (102) and (103). These peaks correspond to the hexagonal wurtzite structure of ZnO with P63mc space group. The indexed peaks are in agreement with the standard peak positions in JCPDS card no. 01-0.80-0074. The absence of additional peaks attributed to Dy phases indicates that Dy3+ ions are well incorporated into the ZnO lattice. Fig. 4b shows the 2θ angle of the main peak (002). It can be observed a small shift of this peak to higher angles with the increase of the dopant concentration, which is due to the incorporation of Dy ions into the ZnO crystal system. This could be explained by the substitution of Zn2+ ions having smaller ionic radii (0.74 Å) with dopant ions having higher ionic radii Dy3+ (0.91 Å).
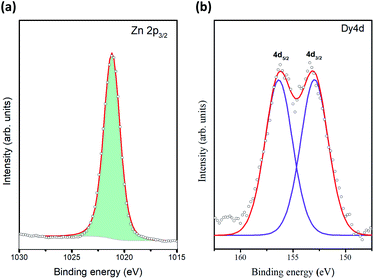
The elemental compositions of the prepared thin films were determined using the EDX, the results of the loading levels of Dy achieved in ZnO are also summarized in Table 1. These results indicate the Dy/Zn ratios achieved in the thin films, being 1.9, 4.6 and 6.2 wt%. The chemical composition of the samples was evaluated using X-ray photoelectron spectroscopy. The oxidation state of Zn and Dy ions were investigated through the analysis of the high-resolution spectra of the Zn2p3/2, Zn LMM and Dy4d core levels. The Zn LMM Auger data (Fig. 5a) shows the fingerprint for Zn2+ oxidation state,35 this assertion is validated by the observation of the Zn2p3/2 peak centered at 1021.1 eV corresponding to Zn2+. The XPS spectrum recorded in the region of the Dy4d core level (Fig. 5b) shows a doublet with components centered at 153.2 eV (Dy4d3/2) and at 156.6 eV (Dy4d5/2), these components denote the presence of Dy3+,36 and no other oxidation state was founded. Table S2 (ESI†) depicts the comparison of pure ZnO and 6% Dy doped quantification through XPS. Indeed, O 1s core level was also analyzed for both, pure ZnO and Dy doped (Fig. S2, ESI†). Two main peaks were observed at 530.0 eV and 531.8 eV, attributed to lattice oxygen of Zn–O and Zn–OH groups (defective ZnO), respectively.37,38
Experimental results of XPS are in agreement with XRD, confirming that Dy3+ is incorporated into the ZnO lattice as a substitutional dopant and compensating the charges. Besides, Zn vacancies are formed.39,40
3.3. Optical analysis
The transmittance and reflectance spectra of the pure and Dy-doped ZnO thin films are shown in Fig. 6a. These films show high transparency within the visible range and near the IR region with an average transmittance varying between 75% and 85% and a sharp fundamental absorption edge in the UV region. The overall average reflectance values are about 15%. The high transparency of these samples would enable their use as an optical window in solar cell applications.In addition, the optical absorption edge of Dy-doped ZnO films is red-shifted compared to pure samples, moving forward to the visible light region. This red-shift may be due to the formation of shallow electronic levels inside the bandgap occurring from the doping atoms residing in the lattice.41
The direct bandgap energy (Eg) of ZnO thin films semiconductors is the transition between the valence and conduction bands, obtained by extrapolating the linear portion of the plots of (αhv)2 versus hv to hv = 0. It can be calculated using the Tauc model42 as indicated in the following equation:
| (αhν)2 = B(hν − Eg) | (2) |
 | (3) |
Fig. 6b shows the optical bandgap energy for the undoped and doped samples. The bandgap decreases from 3.22 eV to 2.93 eV when the Dy doping level increases. This shift of the energy gap can be explained by the generation of defects and disorder in the ZnO lattice due to the incorporation of dopants, which influences the structure of the bandgap, thus allowing the formation of localized states and deep levels in the bandgap. Similar results were reported by O. Yayapao et al.,41 revealing a decrease in the bandgap following the introduction of Dy ions in the ZnO matrix. Indeed, the decrease in the band gap energy facilitates the increase in the separation of the photo-induced electron–hole pairs, resulting in an easier electron excitation. These results enhance the visible light photocatalytic efficiency of the Dy-doped ZnO.44
The Urbach energy gives an idea about the disorder in the samples and can be calculated using the Urbach law (see Fig. 6c):45
 | (4) |
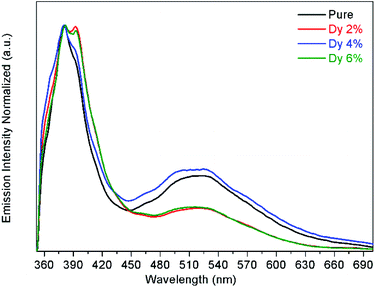
The PL spectroscopy is employed to investigate the separation capacity of the electron–hole pairs and to probe the crystal defects because it originates from either the photoinduced electron–hole bandgap recombination or in the intrinsic defects. Fig. 7 shows the PL spectra for the undoped and doped samples. By pumping at 325 nm, it can be observed two emission bands, one emission in the UV at around 380 nm and a broader emission band in the visible range from 450 to 700 nm. The UV peak corresponds to the near band-edge emission, associated with exciton recombination processes,46 while the broad emission band observed in the visible range is attributed to defects.47
The exciton peak is located at 380 nm for the undoped and 2, 4% doped samples, while for the 6% doped sample is shifted to 382 nm. Also, another peak is observed at 393 nm for the doped samples. This second peak can be explained by the formation of a shallow level inside the band gap and close to the conduction band of ZnO, and is due to the impurity Dy3+ atoms substituting the Zn2+ atoms in the lattice, which is was also corroborated by the red-shift observed in the transmittance and reflectance spectra results. The full width at half maximum (FWHM) of this UV peak increases from 387 to 477 meV from the undoped to the 6% doped sample. This broadening observed on the FWHM indicates that the recombination of photogenerated electron–hole pairs increases as the Dy-doping increases. On the other hand, the defect band has its maximum emission intensity at around 520 nm and could be related to oxygen vacancies.47 This PL results are in agreement with the transmittance and reflectance measurements.
3.4. Photocatalytic activity
The photocatalytic activity of the undoped and Dy doped ZnO thin films was evaluated using methylene blue (MB). Since this organic dye shows a strong absorbance band at 660 nm, their intensity decreases when MB degrades, this variation in the intensity was assessed at regular time intervals.The time evolution of absorbance spectra for pure and ZnO doped thin films (2%, 4% and 6%), recorded from 400–900 nm wavelengths for MB dye solutions irradiated under solar irradiation (Fig. S3, ESI†). These figures show that, as time elapses, the intensity of the peak at 660 nm decreases revealing that the MB is rapidly degrading. For a given period elapsed, as the Dy doping of ZnO increases the difference between the intensity of the 660 nm peak is also increased. This indicates that 6% Dy doped ZnO is the most efficient at degrading MB irradiation time. The MB degradation rate (calculated using eqn (1)) for all the samples tested after 120 minutes under solar irradiation. Indeed, the photocatalytic efficiency increases with doping content and the highest value of about 92% was characteristic of the sample doped at 6% under sunlight irradiation (Fig. 8). The obtained results are in good agreement with those found by S. Nguanprang et al. for Dy-doped ZnO nanoparticles at 5% deposited by the combustion technique.48 This increase in photocatalytic activity with the increase in doping can be explained by the inhibition of the recombination of photogenerated electron–hole pairs following the substitution of Zn2+ by Dy3+. Indeed, the optical and morphological results confirm this enhancement, and the sample doped at 6% with Dy presents the lowest value of bandgap energy. Besides, this sample shows the highest surface roughness (RMS), leading to an increase in the adsorption of the MB on the surface.
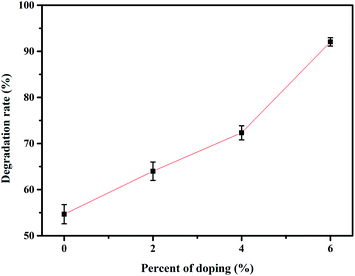 | ||
| Fig. 8 Degradation rate of MB after solar irradiation for 2 hours using the Dy doped ZnO thin films at various Dy contents. | ||
This parameter facilitates the separation and the transfer of photogenerated charge carriers, resulting in an enhancement of photocatalytic efficiency.49
The kinetic rate K can be calculated using the following equation:50
| ln(A0/A) = Kt | (5) |
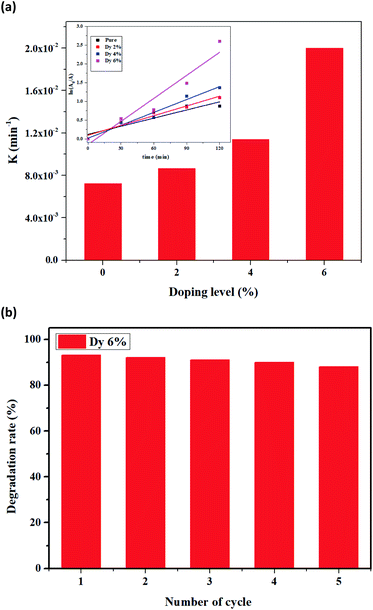
In order to study the stability of the degradation efficiency for the 6% Dy-doped ZnO sample, five consecutive cycles of MB degradation under solar light were performed (Fig. 9b). A cleaning protocol of the surface was used before each cycle to ensure a reliable film recovery. Specifically, the active layer was rinsed several times with distilled water and dried with nitrogen. Finally, a thermal treatment was conducted in a oven for 15 min at 200 °C. As a result, a negligible decrease in the photocatalytic efficiency was observed after five cycles, demonstrating the outstanding stability of Dy doped ZnO thin films for degrading methylene blue. It is worth noting that ZnO is prone to suffering photo-corrosion than other materials such as TiO2,51 however, with the experimental conditions applied, a noteworthy recyclability of the thin films developed was achieved.
3.5. Mechanism of photocatalytic degradation
The proposed degradation mechanism of MB in the presence of a Dy-doped ZnO thin film is described in detail. It is well-known that hydroxyl radicals remove the organic contaminants from wastewater on the surface of the Dy-doped ZnO thin films. Whereas, when the energy of the incident light is equal or exceeds the bandgap energy, thin films generate at the surface electron/hole (e−/h+) pairs. The mechanism is presented in the steps below:| ZnO + hν → h+vB + e−CB | (6) |
The production of holes under solar irradiation by the oxygen vacancies:
| V+oxg + e− → Voxg + h+vB | (7) |
The reaction between (hVB+) with the adsorbed water (H2O) at the surface of the thin films produces hydroxyl radicals (OH˙)
| ZnO + h+vB + H2O(ads) → H+ + OH˙ | (8) |
In addition, dysprosium is a powerful Lewis acid with a partly occupied 4f orbital can easily react with electrons from the conduction band. Consequently, Dy can trap electrons via the conduction band and thus, enhance the inhibition of the recombination of charge carriers.52
| Dy3+ + e−CB → Dy2+ | (9) |
| Dy2+ + O2(ads) → O2˙− | (10) |
| O2˙− + H+ → HO2˙ | (11) |
In fact, water molecules and oxygen permit to trap the holes and electrons to form hydroxyl radicals that react with the dye molecule present in the solution, favoring its degradation.
| HO.2+ H+ + e−CB → H2O2 | (12) |
| H2O2 + e−CB → HO˙ + OH− | (13) |
| h+vB + H2O → H+ + OH˙ | (14) |
| H+ + OH˙ → HO˙ (formation of hydroxyl radical) | (15) |
Hydroxyl radicals OH˙ enable the decomposition of hazardous pollutants as MB into inorganic compounds, which makes the solution colorless.
(Mineralization of MB dye)
| MB dye + OH˙ → CO2↑ + H2O | (16) |
Thereby, the complete decomposition of MB results in CO2 and H2O. However, it can be expected that intermediate compounds are formed during the photodegradation process. For instance, gas-chromatography-mass spectrometry analyses have revealed the presence of benzoic acid groups during the photodegradation process of MB.53,54 It is worth noting that photodegradation of MB was performed under scavenger-free conditions, which is leading to optimum decomposition rates. For instance, U. Alam et al. studied the role of different scavengers in MB degradation using Nd-ZnO nanoparticles.55 Specifically, this work reports the use of isopropyl alcohol, benzoquinone and EDTA-2Na to trap OH˙, O2˙− and holes. As a result of this scavenger-assisted process, the highest reduction in the MB degradation rate was achieved using isopropyl alcohol, due to the quenching of hydroxyl radicals, revealing their key importance during the photocatalytic process.
4. Conclusions
We have investigated the structural, optical and morphological properties of pure and dysprosium doped ZnO thin films prepared by a simple chemical method of spray pyrolysis. XRD measurements proved the presence of the hexagonal wurtzite phase of ZnO and no additional peaks wer introduced by doping with dysprosium elements. The obtained AFM images showed an increase in the roughness of the ZnO thin films by Dy doping until 73 nm at 6%. XPS results confirm that in doped ZnO, Dy3+ is incorporated into the ZnO lattice. The transmittance spectra show that all films have a transmittance in the range of 80% in the visible range and the optical bandgap decreases from 3.22 eV in undoped samples to 2.93 eV for samples doped with 6% Dy favoring the degradation of MB under solar irradiation.The dye degradation in the presence of pure ZnO was found to be 57% and increased up to 92% for Dy doped ZnO at 6%. This is the highest efficiency achieved throughout the samples tested. With that, Dy-doped ZnO thin films have a great potential to be employed in photocatalytic applications for wastewater purification.
Conflicts of interest
There are no conflicts to declare.Acknowledgements
E. L. is supported by the Catalan Institution for Advanced Studied via the 2018 Edition of the ICREA Academia Award. CB is a Research Associate of the National Funds for Scientific Research (FNRS, Belgium). This work was supported in part by MICINN and FEDER via grants no. RTI2018-101580-B-I00.References
- L. Diamandescu, M. Cernea, F. Tolea, E. C. Secu, R. Trusca, M. Secu and M. Enculescu, Ceram. Int., 2018, 44, 21962–21975 CrossRef CAS.
- D. P. Ojha and H. J. Kim, Chem. Eng. Sci., 2020, 212, 115338 CrossRef CAS.
- S. Rehman, R. Ullah, A. M. Butt and N. D. Gohar, J. Hazard. Mater., 2009, 170, 560–569 CrossRef CAS PubMed.
- S. Fatin, H. N. Lim, W. T. Tan and N. M. Huang, Int. J. Electrochem. Sci., 2012, 7, 9074–9084 CAS.
- R. E. Adam, H. Alnoor, G. Pozina, X. Liu, M. Willander and O. Nur, Solid State Sci., 2020, 99, 106053 CrossRef CAS.
- M. Willander, M. Q. Israr, J. R. Sadaf and O. Nur, Nanophotonics, 2012, 1, 99–115 CrossRef CAS.
- A. Mhamdi, M. S. Alkhalifah, S. Rajeh, A. Labidi, M. Amlouk and S. Belgacem, Phys. B, 2017, 521, 178–187 CrossRef CAS.
- M. Wang, Y. Lian and X. Wang, Curr. Appl., 2009, 9, 189–194 CrossRef.
- D. Raoufi, J. Lumin., 2013, 134, 213–219 CrossRef CAS.
- L. Zhu and W. Zeng, Sens. Actuators, A, 2017, 267, 242–261 CrossRef CAS.
- S. Bhatia, N. Verma and R. Kumar, J. Alloys Compd., 2017, 726, 1274–1285 CrossRef CAS.
- A. Hastir, N. Kohli and R. C. Singh, J. Phys. Chem. Solids, 2017, 105, 23–34 CrossRef CAS.
- S. P. Chand and V. Singh, J. Rare Earths, 2020, 38, 29–38 CrossRef.
- S. Selvaraj, M. K. Mohan, M. Navaneethan, S. Ponnusamy and C. Muthamizhchelvan, Mater. Sci. Semicond. Process., 2019, 103, 104622 CrossRef CAS.
- L. Yang, Y. Tang, A. Hu, X. Chen, K. Liang and L. Zhang, Phys. B, 2008, 403, 2230–2234 CrossRef CAS.
- A. George, S. K. Sharma, S. Chawla, M. M. Malik and M. S. Qureshi, J. Alloys Compd., 2011, 509, 5942–5946 CrossRef CAS.
- A. N. Ökte, Appl. Catal., A, 2014, 475, 27–39 CrossRef.
- G. A. S. Josephine and A. Sivasamy, Appl. Catal., B, 2014, 150–151, 288–297 CrossRef CAS.
- L. Xu, G. Zheng, F. Xian and J. Su, Mater. Chem. Phys., 2019, 229, 215–225 CrossRef CAS.
- M. Yarahmadi, H. Maleki-Ghaleh, M. E. Mehr, Z. Dargahi, F. Rasouli and M. H. Siadati, J. Alloys Compd., 2021, 853, 157000 CrossRef CAS.
- L. Roza, Y. Febrianti, S. Iwan and V. Fauzia, Surf. Interfaces, 2020, 18, 100435 CrossRef CAS.
- H. Jafari, S. Sadeghzadeh, M. Rabbani and R. Rahimi, Ceram. Int., 2018, 44, 20170–20177 CrossRef.
- G. Poongodi, R. M. Kumar and R. Jayavel, Ceram. Int., 2015, 41, 4169–4175 CrossRef CAS.
- W.-H. Lin, Y.-H. Chiu, P.-W. Shao and Y.-J. Hsu, ACS Appl. Mater. Interfaces, 2016, 8, 32754–32763 CrossRef CAS PubMed.
- Y.-C. Pu, H.-Y. Chou, W.-S. Kuo, K.-H. Wei and Y.-J. Hsu, Appl. Catal., B, 2017, 204, 21–32 CrossRef CAS.
- C. Florica, A. Costas, N. Preda, M. Beregoi, A. Kuncser, N. Apostol, C. Popa, G. Socol, V. Diculescu and I. Enculescu, Sci. Rep., 2019, 9, 17268 CrossRef PubMed.
- Y.-C. Chen, T.-C. Liu and Y.-J. Hsu, ACS Appl. Mater. Interfaces, 2015, 7, 1616–1623 CrossRef CAS PubMed.
- T. A. Kurniawan, Z. Mengting, D. Fu, S. K. Yeap, M. H. D. Othman, R. Avtar and T. Ouyang, J. Environ. Manage., 2020, 270, 11087 Search PubMed.
- Y.-A. Chen, Y.-T. Wang, H. S. Moon, K. Yong and Y.-J. Hsu, RSC Adv., 2021, 11, 12288–12305 RSC.
- Y.-H. Chiu, T.-F. Chang, C.-Y. Chen, M. Sone and Y.-J. Hsu, Catalysts, 2019, 9, 430 CrossRef CAS.
- M.-J. Fang, C.-W. Tsao and Y.-J. Hsu, J. Phys. D: Appl. Phys., 2020, 53, 143001 CrossRef CAS.
- K. Belkilani, A. B. Othman and M. Besbes, Appl. Phys. A, 2018, 124, 122 CrossRef CAS.
- R. Nasser, W. B. H. Othmen, H. Elhouichet and M. Férid, Appl. Surf. Sci., 2017, 393, 486–495 CrossRef CAS.
- M. A. Amara, T. Larbi, A. Labidi, M. Karyaoui, B. Ouni and M. Amlouk, Mater. Res. Bull., 2016, 75, 217–223 CrossRef CAS.
- J. O. Primo, C. Bittencourt, S. Acosta, A. Sierra-Castillo, J.-F. Colomer, S. Jaerger, V. C. Teixeira and F. J. Anaissi, Front. Chem., 2020, 8, 11 CrossRef PubMed.
- X. Dong, X. Cheng, X. Zhang, L. Sui, Y. Xu, S. Gao, H. Zhao and L. Huo, Sens. Actuators, B, 2018, 255, 1308–1315 CrossRef CAS.
- M. Kumar, G. Josephine, G. Tamilarasan, A. Sivasamy and J. Sridevi, J. Environ. Chem. Eng., 2018, 6, 3907–3917 CrossRef.
- A. Fonseca, R. Siqueira, R. Landers, J. L. Ferrari, N. L. Marana, J. R. Sambrano, F. A. L. Porta and M. A. Schiavon, J. Alloys Compd., 2018, 739, 939–947 CrossRef.
- M. Prathap Kumar, G. A. Suganya Josephine, G. Tamilarasan, A. Sivasamy and J. Sridevi, J. Environ. Chem. Eng., 2018, 6, 3907–3917 CrossRef CAS.
- F.-Y. Lo, Y.-C. Ting, K.-C. Chou, T.-C. Hsieh, C.-W. Ye, Y.-Y. Hsu, M.-Y. Chern and H.-L. Liu, J. Appl. Phys., 2015, 117, 213911 CrossRef.
- O. Yayapao, T. Thongtem, A. Phuruangrat and S. Thongtem, J. Alloys Compd., 2013, 576, 72–79 CrossRef CAS.
- J. Tauc, R. Grigorovici and A. Vancu, Phys. Status Solidi B, 1966, 15, 627–637 CrossRef CAS.
- D. E. Milovzorov, A. M. Ali, T. Inokuma, Y. Kurata, T. Suzuki and S. Hasegawa, Thin Solid Films, 2001, 382, 47–55 CrossRef CAS.
- R. Mimouni, A. Souissi, A. Madouri, K. Boubaker and M. Amlouk, Curr. Appl. Phys., 2017, 17, 1058–1065 CrossRef.
- Y. Zhang, Y. Shen, F. Gu, M. Wu, Y. Xie and J. Zhang, Appl. Surf. Sci., 2009, 256, 85–89 CrossRef CAS.
- J. S. Reparaz, F. Güell, M. R. Wagner, G. Callsen, R. Kirste, S. Claramunt, J. R. Morante and A. Hoffmann, Appl. Phys. Lett., 2010, 97, 133116 CrossRef.
- F. Güell and P. R. Martínez-Alanis, J. Lumin., 2019, 210, 128–134 CrossRef.
- S. Sa-nguanprang, A. Phuruangrat, T. Thongtem and S. Thongtem, Inorg. Chem. Commun., 2020, 117, 107944 CrossRef CAS.
- J. Yin, Z. Xing, J. Kuang, Z. Li, M. Li, J. Jiang, S. Tan, Q. Zhu and W. Zhou, J. Alloys Compd., 2018, 750, 659–668 CrossRef CAS.
- J.-C. Sin, S.-M. Lam, K.-T. Lee and A. R. Mohamed, Ceram. Int., 2014, 40, 5431–5440 CrossRef CAS.
- X.-B. Xiang, Y. Yu, W. Wen and J.-M. Wu, New J. Chem., 2018, 42, 265–271 RSC.
- J.-C. Sin, S.-M. Lam, K.-T. Lee and A. R. Mohamed, Ceram. Int., 2013, 39, 5833–5843 CrossRef CAS.
- B. Yang, J. Zuo, X. Tang, F. Liu, X. Lu, X. Tang, H. Jiang and L. Gan, Ultrason. Sonochem., 2014, 21, 1310–1317 CrossRef CAS PubMed.
- J. Lin, X. Weng, X. Jin, M. Megharaj, R. Naidu and Z. Chen, RSC Adv., 2015, 5, 70874–70882 RSC.
- U. Alam, A. Khan, D. Ali, D. Bahnemann and M. Muneer, RSC Adv., 2018, 8, 17582–17594 RSC.
Footnote |
| † Electronic supplementary information (ESI) available. See DOI: 10.1039/d1ra03967a |
| This journal is © The Royal Society of Chemistry 2021 |

