DOI:
10.1039/D1RA03925C
(Paper)
RSC Adv., 2021,
11, 24938-24948
Preparation and properties of capric acid–stearic acid-based ternary phase change materials
Received
20th May 2021
, Accepted 5th July 2021
First published on 19th July 2021
Abstract
Two kinds of CA–SA-based ternary phase change materials (PCMs), namely, capric acid–stearic acid–palmitic acid (CA–SA–PA) and capric acid–stearic acid–octadecanol (CA–SA–OD), were prepared by the melting–blending method. By the step cooling curve method, the optimum mass ratio of the two PCMs were determined to be CA![[thin space (1/6-em)]](https://www.rsc.org/images/entities/char_2009.gif) :SA:PA = 77.4:8.6:14.0 and CA:SA:OD = 81.9:9.1:9.0, and the crystallization temperatures were 19.20 °C and 23.90 °C, respectively. The phase transition temperatures as measured by DSC were 18.60 °C and 24.82 °C, and the latent heat of phase transition were 129.15 J g−1 and 161.74 J g−1, respectively. The results are in good agreement with those measured by the step cooling curve method. The chemical and crystalline properties of the two PCMs were analyzed by FT-IR and XRD. It was found that CA–SA is combined with PA or OD by physical action, and the components have good compatibility and form a good eutectic structure. In addition, the results of heat storage and heat release experiments and the 500 times of accelerated melting–solidification cycling test showed that the two kinds of PCMs have good heat resistance and thermal reliability. Therefore, the prepared CA–SA–PA and CA–SA–OD have good performance and great application potential in building energy saving and solar energy utilization.
:SA:PA = 77.4:8.6:14.0 and CA:SA:OD = 81.9:9.1:9.0, and the crystallization temperatures were 19.20 °C and 23.90 °C, respectively. The phase transition temperatures as measured by DSC were 18.60 °C and 24.82 °C, and the latent heat of phase transition were 129.15 J g−1 and 161.74 J g−1, respectively. The results are in good agreement with those measured by the step cooling curve method. The chemical and crystalline properties of the two PCMs were analyzed by FT-IR and XRD. It was found that CA–SA is combined with PA or OD by physical action, and the components have good compatibility and form a good eutectic structure. In addition, the results of heat storage and heat release experiments and the 500 times of accelerated melting–solidification cycling test showed that the two kinds of PCMs have good heat resistance and thermal reliability. Therefore, the prepared CA–SA–PA and CA–SA–OD have good performance and great application potential in building energy saving and solar energy utilization.
1. Introduction
The entire world is facing a global crisis involving climate change, environmental deterioration, and energy shortage. All walks of life are committed to promoting the research, development, and application of clean, low-carbon, and environment-protection energy, and they are striving to facilitate society to move forward toward the green and sustainable development path. At present, the energy problem caused by industrial production, construction field, and social life demand is becoming increasingly serious; from the perspective of energy consumption alone, building energy consumption is an important part of the total social energy consumption,1,2 which is one of the main reasons for this crisis. The thermal insulation effect of traditional building materials is poor, which increases the operating load of indoor heating, ventilation, and air-conditioning system, further aggravating energy wastage and environmental pollution. Phase change materials (PCMs) can achieve energy absorption, storage, and release during phase transformation, which can effectively resolve the problem of energy utilization mismatch in time and space as well as achieve good control over environmental temperature.3 In recent years, research on the preparation of new-building energy storage materials using PCMs has become popular.4–7
There are many kinds of PCMs used in the field of building energy saving, among which fatty acids and fatty alcohols are potential latent heat energy storage materials with good thermal and chemical stability, high heat storage capacity, and small volume change during the phase transition process.8–14 However, the phase transition temperature of single fatty acids is high, which is difficult to meet the application requirements in the field of building energy conservation.15,16 Single fatty alcohol in the solidification process results in crystal transformation, leading to the formation of multiple freezing points, affecting its use.17 Based on the above advantages and disadvantages, as well as the characteristics that fatty acids and fatty alcohols can form a good eutectic in the molten state, binary or multi-eutectic composite phase change materials (CPCMs) with stable properties have been prepared to better meet the needs of practical engineering applications.18–20 Ding et al.21 studied the thermal performance of lauric acid–stearic acid (LA–SA) binary eutectic mixture, which can be applied to low-temperature water floor heating system; they found that it has an appropriate phase transition temperature and ideal latent heat of phase transition, as well as it can effectively improve the utilization efficiency of the latent heat storage system. Gu et al.22 prepared capric acid–hexadecanol (CA–H) binary CPCM with phase transition temperature and latent heat of 24.22 °C and 190.50 J g−1, respectively. Through research on its phase-transition energy storage characteristics, it was confirmed that the material exhibited great application potential in the field of building energy saving. Liu et al.23 prepared stearic acid–octadecanol (SA–OD) binary PCM by the melting–blending method; the 800 times of melting–solidification cycling test showed that PCM had good thermal stability. Ke24 prepared a series of binary and multiple fatty acid eutectic mixtures by the melting–blending and ultrasonic method. They found that these eutectics have stable chemical properties and are suitable for low-temperature energy storage applications such as building energy storage systems and thermal regulation textiles. Yu et al.25 prepared hexadecanol–palmitic acid–lauric acid (H–PA–LA) ternary eutectic CPCM by compounding LA into an H–PA binary eutectic mixture, and the test showed that the material yielded good thermal properties and stability. Based on the theoretical prediction results, Zhang et al.26 prepared lauric acid–myristic acid–palmitic acid (LA–MA–PA) ternary eutectic mixture with a mass ratio of 55.24:29.74:15.02 and phase transition temperature and latent heat of 31.40 °C and 145.80 J g−1, respectively, which has certain application potential in solar energy utilization. In addition, the binary and ternary eutectic CPCMs based on fatty acids and fatty alcohols are analyzed and discussed in other studies.27–31
Due to the high phase transition temperature of single fatty acids, they are not suitable for practical applications in the field of building energy conservation. In this paper, capric acid with a lower phase transition temperature and stearic acid with higher latent heat were used to prepare a binary eutectic. Capric acid–stearic acid–palmitic acid (CA–SA–PA) and capric acid–stearic acid–octadecanol (CA–SA–OD) ternary eutectic mixtures were prepared by compounding PA and OD (with higher latent heat) into the CA–SA binary eutectic mixture. The structure and properties of the two CA–SA-based ternary CPCMs were analyzed by DSC, FT-IR, and XRD measurements, which provided a reference for the research and application of fatty-acid- and fatty-alcohol-based ternary eutectic CPCMs.
2. Experimental section
2.1 Materials
Capric acid (CA, CH3(CH2)8COOH, 172.26, 98.5%, CP), stearic acid (SA, CH3(CH2)16COOH, 284.48, AR), palmitic acid (PA, CH3(CH2)14COOH, 256.42, AR), and octadecanol (OD, CH3(CH2)17OH, 270.49, CP) were purchased from Sinopharm Chemical Reagent Co., Ltd. The chemicals were used as received without further purification.
2.2 Preparation of CA–SA-based ternary PCMs
The CA–SA binary eutectic mixture with different components can be prepared by weighing a certain mass of CA and SA in a beaker, sealing them with a film, and heating them in an 80 °C drying oven, followed by taking them out after the sample completely melts and stirring them in a magnetic stirrer with the same heating temperature set at 80 °C for 0.5 h. After the optimum ratio of CA–SA binary eutectic mixture was determined, a certain mass of CA–SA and PA or CA–SA and OD was weighed in the beaker, sealed with a film, melted at 80 °C for several minutes, and then stirred under a magnetic force for 0.5 h to ensure uniform mixing of the samples. After stirring, the samples in the beaker were poured into the test tube and numbered, and a series of eutectic mixtures with different proportions could be prepared. The experimental device used in this study is shown in Fig. 1.
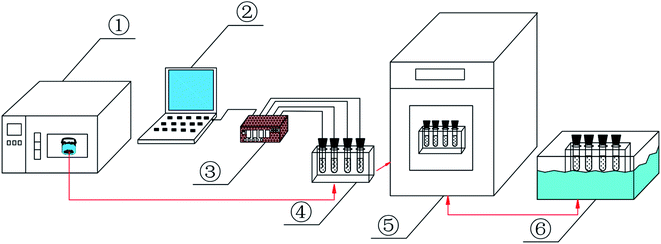 |
| | Fig. 1 Schematic of the experimental device (①: drying oven; ②: PC; ③: temperature-inspection instrument; ④: test-tube rack; ⑤: constant-temperature and constant-humidity incubator; ⑥: constant-temperature water tank). | |
2.3 Characterization
DSC (Mettler-Toledo DSC3, Switzerland) was used to determine the phase transition temperature and latent heat of CA, SA, CA–SA, PA, OD, CA–SA–PA, and CA–SA–OD. The test conditions were set as a nitrogen atmosphere with a flow rate of 50 ml min−1, and the heating/cooling rate was set at 5 °C min−1. The chemical structure of the PCMs was analyzed by FT-IR (PerkinElmer Spectrum 200, Thermo Electron, USA). Further, the infrared spectra were recorded on a KBr pellet at the test frequency of ∼4000–400 cm−1 and a resolution of 4 cm−1. The crystalline phases of the PCMs were characterized by XRD (Empyrean, PANalytical B.V., Netherlands) using Cu Kα radiation (λ = 1.5406 Å). The heat storage and release experiments were used to test the charge and discharge properties of the PCMs. The test tubes were placed in a 45 °C constant-temperature water tank and a 5 °C constant-temperature and constant-humidity incubator for the melting and solidification process, respectively, and changes in temperature–time in the whole cycle were recorded. The melting–solidification cycling test was used to verify the thermal reliability of the PCMs, and the changes in the thermal performance parameters after multiple melting–solidification cycling processes were compared. The chemical stability of the PCMs was characterized by a change in the FT-IR curve before and after the melting–solidification cycling.
3. Results and discussion
3.1 Determination of the ratio of eutectic mixture
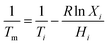
The optimum ratio and phase transition temperature of the eutectic mixture can be calculated by using the Schroeder formula:32| |
 | (1) |
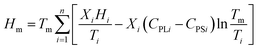
where Tm is the melting point of the eutectic mixture (K); Ti and Hi are the melting temperature (K) and latent heat (kJ mol−1) of the i-type component in the eutectic mixture, respectively; Xi is the mole fraction of the i-type component; and R is the gas constant, and it is 8.315 kJ (mol−1 K−1). The theoretical-transformation latent heat of the N-element eutectic mixture is calculated as follows:| |
 | (2) |
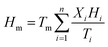
where Hm is the melting latent heat of the eutectic mixture (kJ mol−1); CPLi and CPSi denote the specific heat of the i-type component at a constant pressure in the liquid and solid states, respectively. When the molecular weight of each component in the eutectic mixture is large, the error caused by the sensible heat term can be ignored. The calculation can be simplified by eqn (3), and the error is less than 4%.20,33| |
 | (3) |
The thermophysical parameters of the raw materials involved in the preparation of the CA–SA binary mixture in this experiment are shown in Table 1. By substituting the parameters of CA and SA into eqn (1), the theoretical molar ratio of the CA–SA binary eutectic mixture can be calculated as 0.9275:0.0725, and the corresponding mass ratio was 89:11. The theoretical phase transition temperature was 301.53 K, that is, 28.38 °C. According to eqn (3), the theoretical latent heat of phase transformation of CA–SA was 143.04 J g−1. The theoretical solid–liquid equilibrium phase diagram of CA–SA binary eutectic system is shown in Fig. 2.
Table 1 Thermophysical parameters of CA and SA
| PCM |
Molecular weight |
Tm/°C |
hm/(J g−1) |
| CA |
172.26 |
30.73 |
141.83 |
| SA |
284.48 |
68.80 |
195.62 |
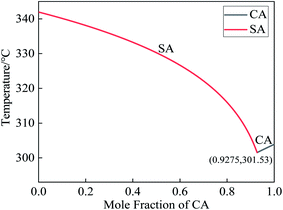 |
| | Fig. 2 Theoretical solid–liquid equilibrium phase diagram of CA–SA binary eutectic system. | |
A series of CA–SA binary mixtures were prepared by the melting–blending method. The step cooling curves of CA–SA at different ratios are plotted in Fig. 3. Fig. 3(a) shows the temperature–time change in pure CA and SA. Evidently, each of the two single fatty acids have a crystallization platform, and the crystallization temperatures of CA and SA are 30.8 °C and 68.5 °C, respectively. Fig. 3(b) and (c) show the step cooling curve of the CA–SA binary mixture. In this experiment, a series of CA–SA binary eutectic mixtures with CA mass fractions of 20%, 40%, 60%, and 80% were prepared, and their corresponding crystallization temperatures were 62.2 °C, 55.8 °C, 44.6 °C, and 29.9 °C, respectively. The obtained results show that the lowest eutectic temperature of the CA–SA binary mixture appears near the mass ratio of CA:SA = 90:10. When the mass fraction of CA is 89%, 90%, and 91%, the corresponding crystallization temperature is 25.4 °C, 25.2 °C, and 25.2 °C, respectively. The T–X phase diagram of the CA–SA binary eutectic system can be drawn according to the crystallization temperature of the binary mixture corresponding to different CA mass fractions, as shown in Fig. 4. As shown in Fig. 4, the T–X phase diagram of the CA–SA binary eutectic system is consistent with the theoretical solid–liquid phase diagram, and the crystallization temperature first decreases and then increases with an increase in the CA mass fraction. When the mass fraction of CA is 90%, the lowest eutectic temperature of the CA–SA binary mixture was obtained, which is 25.2 °C. Therefore, the optimum mass ratio of the CA–SA binary eutectic mixture is 90:10 and the crystallization temperature is 25.2 °C.
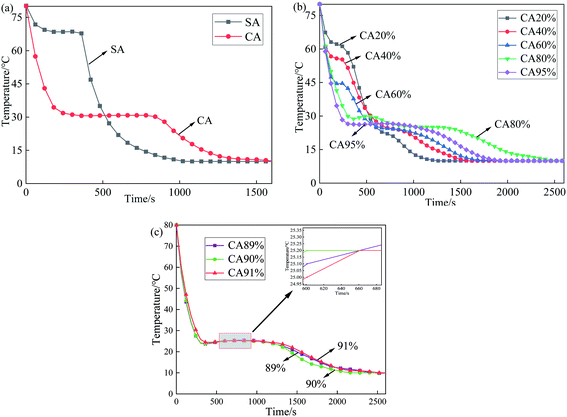 |
| | Fig. 3 Step cooling curves of CA, SA and CA–SA binary mixtures ((a) CA and SA; (b) different ratios of CA; (c) the ratio near the low eutectic point of CA–SA). | |
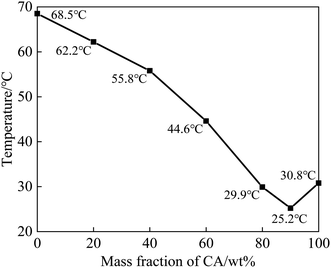 |
| | Fig. 4 T–X phase diagram of the CA–SA binary mixture. | |
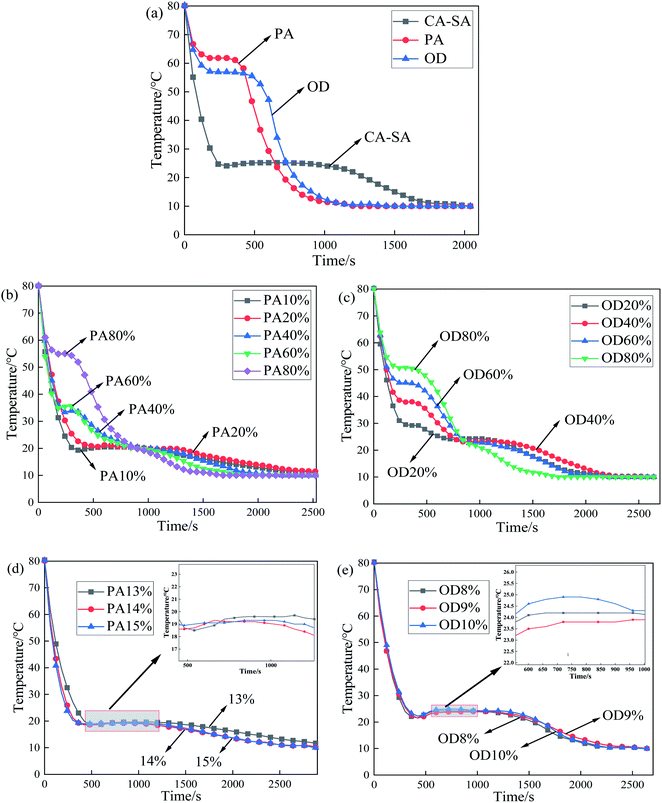
CA–SA–PA and CA–SA–OD ternary PCMs, also known as pseudo-binary PCMs, were prepared by combining a CA–SA eutectic mixture with PA and OD, respectively. The obtained results show that the thermal performance of the pseudo-binary mixture is similar to that of the ternary mixture in terms of melting temperature and latent heat of phase transition, and the Schroeder formula is also applicable to the theoretical calculation of such substances.34 According to eqn (1), the optimum mass ratios of CA–SA–PA and CA–SA–OD eutectic mixtures are 76:9:15 and 78:9:13, respectively, and the corresponding theoretical transformation temperatures are 25.08 °C and 25.64 °C. The theoretical values of the latent heat of phase transition are 144.80 J g−1 and 147.47 J g−1, respectively. In order to determine the proportion of CA–SA–PA and CA–SA–OD ternary eutectic mixture, the CA–SA binary eutectic mixture with a mass ratio of CA:SA = 90:10 was mixed with PA or OD in a certain proportion to prepare a series of ternary eutectic mixtures with different components. Thermal resistance was used to test the temperature–time variation in each component in the cooling process, and the step cooling curve is shown in Fig. 5.
 |
| | Fig. 5 Step cooling curves of CA–SA–PA and CA–SA–OD ternary eutectic ((a) CA–SA; (b) different ratios of PA; (c) different ratios of OD; (d) the ratio near the low eutectic point of CA–SA–PA; (e) the ratio near the low eutectic point of CA–SA–OD). | |
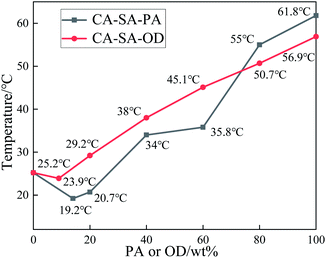
Fig. 5(a) shows the temperature–time variation for pure PA, pure OD, and CA–SA binary eutectic mixture during an exothermic process. As shown in Fig. 5(a), there is only one phase transition platform for CA–SA, PA, and OD, and the corresponding crystallization temperature is 25.2 °C, 61.8 °C, and 56.9 °C, respectively. Fig. 5(b) and (c) show the step cooling curves of CA–SA–PA and CA–SA–OD ternary mixtures, respectively. By comparing the crystallization temperature of a ternary eutectic mixture under a series of different components such as PA and OD proportions of 20%, 40%, 60%, and 80%, it is determined that the lowest eutectic point of CA–SA–PA appears when the mass fraction of PA is between 10% and 20%, while that of CA–SA–OD appears when the mass fraction of OD is between 0% and 10%. After narrowing the range, the temperature corresponding to each ratio was compared. When the mass fraction of PA is 14%, the minimum eutectic temperature of CA–SA–PA is obtained, which is 19.2 °C. Further, the crystallization temperatures of ternary PCMs with a mass fraction of PA of 13% and 15% are 19.6 °C and 19.3 °C, respectively, which are 0.4 °C and 0.1 °C higher than the corresponding minimum eutectic temperature. Similarly, when the mass fraction of OD is 9%, the lowest eutectic temperature of CA–SA–OD is obtained, which is 23.9 °C. Further, the crystallization temperatures of the ternary mixture with two adjacent ratios are both higher than 23.9 °C. Therefore, when the mass fraction of OD is 9%, it is considered to be the best mass ratio for a ternary eutectic system. It is worth noting that when the OD content of the CA–SA–OD ternary mixture is higher than that of the optimal ratio, there will be two obvious phase transition platforms, which may be caused by the formation of multiple freezing points due to the crystal transformation of fatty alcohol during the solidification process.
The T–X phase diagram of a ternary eutectic system in which the crystallization temperature of the CA–SA-based CPCM varies with the proportion of PA or OD is drawn according to the crystallization temperature values of the eutectic mixture measured under different ratios, as shown in Fig. 6. Evidently, with a gradual increase in the mass fraction of PA or OD, the crystallization temperature of the two ternary eutectic systems first decreases and then increases, and the crystallization temperature decreases to the lowest value when the mass fraction of PA and OD reaches 14% and 9%, respectively. Moreover, the optimal mass ratios of the corresponding ternary eutectic mixtures are CA:SA:PA = 77.4:8.6:14.0 and CA:SA:OD = 81.9:9.1:9.0, respectively. The obtained results show that the mass ratio of the two CA–SA-based PCMs determined by the experiment is almost the same as that predicted by theory, but there is a certain difference in the temperature value, which may be caused by a deviation in the material purity and instrument precision.
 |
| | Fig. 6 T–X phase diagram of CA–SA-based ternary PCMs. | |
3.2 Thermal properties of CA–SA-based ternary CPCMs
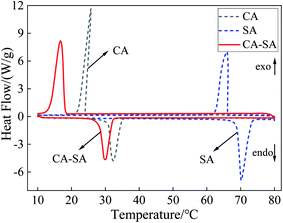
According to the step cooling curve method, the optimum ratio of the CA–SA binary eutectic mixture was determined when the mass fraction of CA was about 90%. Therefore, the CA–SA binary mixtures with CA mass fractions of 89%, 90%, and 91% were tested by DSC, and the results are listed in Table 2. Evidently, the phase transition temperature of the CA–SA eutectic mixture with a CA mass fraction of 90% is lower than those with mass fractions of 89% and 91%. Therefore, it can be further confirmed that the result obtained by the step cooling curve method is the best ratio, and the minimum eutectic point of the CA–SA binary mixture is 28.12 °C. Fig. 7 shows the DSC curves of pure CA, pure SA, and CA–SA binary eutectic mixture. The obtained results show that the melting temperature and latent heat of CA are 30.73 °C and 141.83 J g−1, respectively, while those of SA are 68.80 °C and 195.62 J g−1, respectively. Further, the melting temperature and latent heat of CA–SA are 28.12 °C and 138.96 J g−1, respectively. Evidently, the phase transition temperature of binary PCM is lower than that of the pure, single substances. There is only one endothermic peak and one exothermic peak in the CA–SA binary mixture; further, the shape of the DSC curve is similar to that of the corresponding pure material, which indicates that the CA–SA binary eutectic mixture forms a good eutectic.
Table 2 Thermophysical parameters of the CA–SA binary mixture
| Mass ratio (CA:SA) |
Tm/°C |
ΔHm/J g−1 |
Tf/°C |
ΔHf/J g−1 |
| 89:11 |
29.82 |
155.22 |
18.72 |
145.18 |
| 90:10 |
28.12 |
138.96 |
18.10 |
128.45 |
| 91:9 |
28.81 |
148.51 |
20.36 |
139.00 |
 |
| | Fig. 7 DSC curves of CA, SA, and CA–SA binary mixtures. | |
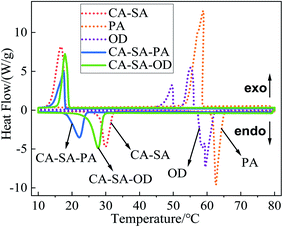
The thermal performance parameters of CA–SA–PA and CA–SA–OD ternary PCMs were measured by DSC, and the minimum eutectic points of the two CA–SA-based ternary eutectic mixtures were further determined. The thermophysical parameters of CA–SA–PA with PA mass fractions of 13%, 14%, and 15% and CA–SA–OD with OD mass fractions of 8%, 9%, and 10% were measured. The corresponding DSC test results are listed in Table 3. Evidently, when the mass fraction of PA is 14%, the melting phase transition temperature of the ternary eutectic mixture is lower than that of the two adjacent ratios, which are 0.12 °C and 0.02 °C lower than that of the CA–SA–PA ternary mixture with PA mass fractions of 13% and 15%, respectively. Similarly, as shown in Table 3, the phase transition temperature of the CA–SA–OD ternary eutectic mixture with an OD mass fraction of 9% is lower than that of the two adjacent ratios, which are 0.21 °C and 0.39 °C lower. Therefore, it can be determined that the best ratio of the two CA–SA-based PCMs is CA:SA:PA = 77.4:8.6:14.0 and CA:SA:OD = 81.9:9.1:9.0, and the corresponding phase transition temperatures are 18.60 °C and 24.82 °C, respectively. Moreover, the results also confirmed that the optimal ratio determined by the step cooling curve method was accurate, and the phase transition temperature values measured by the two methods were close; further, the deviations were only 0.60 °C and 0.92 °C. The DSC curves of CA–SA, PA, OD, CA–SA–PA, and CA–SA–OD are plotted in Fig. 8. The melting phase transition temperature and latent heat of CA–SA are 28.12 °C and 138.96 J g−1, respectively. The melting temperature of PA and OD are 61.65 °C and 58.69 °C, respectively, and their latent heat values of melting are 195.06 J g−1 and 219.40 J g−1, respectively. Moreover, the melting temperature of CA–SA–PA and CA–SA–OD are 18.60 °C and 24.82 °C, respectively, and the melting latent heat are 129.15 J g−1 and 161.74 J g−1, respectively. The mass ratio of CA–SA–PA is close to the theoretical prediction; however, there are some differences in the temperature values, which may be caused by the purity of materials, accuracy of instruments, and deviation of operation. It is worth mentioning that there is only one endothermic peak and one exothermic peak in the two kinds of ternary CPCMs, and their curve shape is similar to that of the CA–SA binary PCM, which indicates that the two ternary systems have formed a good eutectic.
Table 3 Thermophysical parameters of CA–SA–PA and CA–SA–OD ternary mixtures
| Mass fraction |
Tm/°C |
ΔHm/J g−1 |
Tf/°C |
ΔHf/J g−1 |
| PA13% |
18.72 |
118.88 |
17.52 |
110.72 |
| PA14% |
18.60 |
129.15 |
18.00 |
125.13 |
| PA15% |
18.62 |
136.19 |
17.75 |
126.95 |
| OD8% |
25.03 |
139.75 |
18.76 |
130.40 |
| OD9% |
24.82 |
161.74 |
19.69 |
116.26 |
| OD10% |
25.21 |
143.76 |
18.96 |
137.27 |
 |
| | Fig. 8 DSC curves of CA–SA-based PCMs. | |
3.3 Chemical structure of CA–SA-based ternary CPCMs
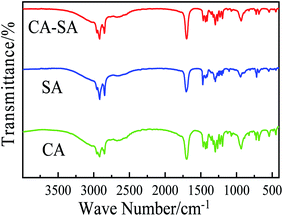
The chemical structure of CPCMs can be analyzed by means of a Fourier-transform infrared (FT-IR) spectrometer. Comparing the wavenumber of the characteristic absorption peak obtained from the experiment with the stretching vibration range of the group, the corresponding vibration type can be determined. The FT-IR spectra of pure CA, pure SA, and CA–SA binary eutectic mixture were measured, and the corresponding infrared spectra are shown in Fig. 9. By comparing the FT-IR curves of the CA–SA binary mixture with those of CA and SA and the corresponding vibration types of each characteristic peak, it is found that the characteristic peaks of CA and SA simultaneously exist on the curve of CA–SA, which is a simple superposition of the characteristic peaks of the two pure substances, and no new vibration absorption peak is produced. Therefore, it is shown that the combination of CA and SA in the CA–SA eutectic mixture is combined by a physical action, which depends on the intermolecular force rather than chemical reaction. The FT-IR curves of CA–SA, PA, OD, CA–SA–PA, and CA–SA–OD are shown in Fig. 10. The FT-IR curves of the CA–SA binary eutectic mixture have the antisymmetric stretching vibration absorption peak of –CH3 and symmetric stretching vibration absorption peak of –CH2 at 2918.15 cm−1 and 2851.61 cm−1, respectively. At 1699.16 cm−1 and 1296.74 cm−1, the stretching vibration peaks of C![[double bond, length as m-dash]](https://www.rsc.org/images/entities/char_e001.gif) O and C–O appear, respectively. Moreover, the characteristic peaks at 1465.74 cm−1, 934.44 cm−1, and 724.76 cm−1 are caused by the antisymmetric bending of –CH2, bending of –OH, and out-of-plane bending vibration of C–H, respectively. The characteristic absorption peaks of PA at 2916.67 cm−1 and 2847.72 cm−1 are produced by the antisymmetric and symmetric stretching of –CH2, respectively. At 1704.06 cm−1 and 1295.50 cm−1, the stretching vibration peaks of CO and C–O appear, respectively. Moreover, at 1472.58 cm−1, 941.44 cm−1, and 718.08 cm−1, the absorption peaks caused by the antisymmetric bending of –CH2, bending of –OH, and out-of-plane bending vibration of C–H are observed, respectively. The FT-IR curves of OD have the stretching vibration, bending vibration, and in-plane bending vibration absorption peaks of –OH at 3326.13 cm−1, 1472.10 cm−1, and 718.01 cm−1, respectively. The vibration absorption peaks at 2917.15 cm−1 and 2848.10 cm−1 are caused by the antisymmetric stretching vibration of –CH3 and the symmetric stretching vibration of –CH2, respectively. The characteristic absorption peaks of CA–SA–PA appeared at 2922.83 cm−1, 2853.87 cm−1, 1710.29 cm−1, 1465.22 cm−1, 1296.18 cm−1, 934.92 cm−1, and 724.69 cm−1, while those of CA–SA–OD appeared at 2916.24 cm−1, 2851.86 cm−1, 1699.98 cm−1, 1466.71 cm−1, 1296.56 cm−1, 933.94 cm−1, and 721.97 cm−1; at these wavenumbers, CA–SA–PA and CA–SA–OD also have the above characteristic absorption peaks. Compared with the FT-IR curves of CA–SA and PA or OD, the strength and location of the characteristic peaks and curve shapes of CA–SA–PA and CA–SA–OD ternary eutectic mixtures are more consistent with those of CA–SA, which is mainly due to the higher content of CA–SA in ternary PCMs, resulting in the weak characteristic peaks strength of PA and OD. In addition, neither of the two generated PCMs exhibit a new characteristic absorption peak, which is only a simple combination of the spectral curves of the two substances. Therefore, the two CA–SA-based CPCMs are formed by the physical interaction of the CA–SA binary eutectic mixture with PA or OD, and there is no chemical reaction and no new substance formation.
O and C–O appear, respectively. Moreover, the characteristic peaks at 1465.74 cm−1, 934.44 cm−1, and 724.76 cm−1 are caused by the antisymmetric bending of –CH2, bending of –OH, and out-of-plane bending vibration of C–H, respectively. The characteristic absorption peaks of PA at 2916.67 cm−1 and 2847.72 cm−1 are produced by the antisymmetric and symmetric stretching of –CH2, respectively. At 1704.06 cm−1 and 1295.50 cm−1, the stretching vibration peaks of CO and C–O appear, respectively. Moreover, at 1472.58 cm−1, 941.44 cm−1, and 718.08 cm−1, the absorption peaks caused by the antisymmetric bending of –CH2, bending of –OH, and out-of-plane bending vibration of C–H are observed, respectively. The FT-IR curves of OD have the stretching vibration, bending vibration, and in-plane bending vibration absorption peaks of –OH at 3326.13 cm−1, 1472.10 cm−1, and 718.01 cm−1, respectively. The vibration absorption peaks at 2917.15 cm−1 and 2848.10 cm−1 are caused by the antisymmetric stretching vibration of –CH3 and the symmetric stretching vibration of –CH2, respectively. The characteristic absorption peaks of CA–SA–PA appeared at 2922.83 cm−1, 2853.87 cm−1, 1710.29 cm−1, 1465.22 cm−1, 1296.18 cm−1, 934.92 cm−1, and 724.69 cm−1, while those of CA–SA–OD appeared at 2916.24 cm−1, 2851.86 cm−1, 1699.98 cm−1, 1466.71 cm−1, 1296.56 cm−1, 933.94 cm−1, and 721.97 cm−1; at these wavenumbers, CA–SA–PA and CA–SA–OD also have the above characteristic absorption peaks. Compared with the FT-IR curves of CA–SA and PA or OD, the strength and location of the characteristic peaks and curve shapes of CA–SA–PA and CA–SA–OD ternary eutectic mixtures are more consistent with those of CA–SA, which is mainly due to the higher content of CA–SA in ternary PCMs, resulting in the weak characteristic peaks strength of PA and OD. In addition, neither of the two generated PCMs exhibit a new characteristic absorption peak, which is only a simple combination of the spectral curves of the two substances. Therefore, the two CA–SA-based CPCMs are formed by the physical interaction of the CA–SA binary eutectic mixture with PA or OD, and there is no chemical reaction and no new substance formation.
 |
| | Fig. 9 FT-IR curves of CA, SA, and CA–SA binary mixture. | |
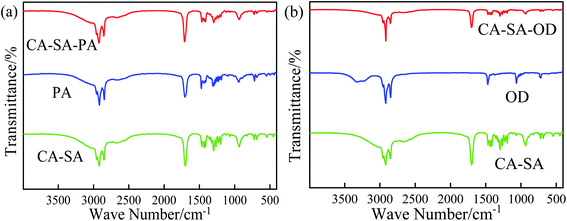 |
| | Fig. 10 FT-IR curves of CA–SA-based PCMs. | |
3.4 Crystal structure of CA–SA-based ternary CPCMs
The crystalline properties of CA, SA, and CA–SA binary eutectic mixture are analyzed, and the test results are shown in Fig. 11. Evidently, there are three strong diffraction peaks of CA at 11.50° with a lattice spacing of 7.6372 Å, at 19.23° with a lattice spacing of 4.6103 Å, and at 21.44° with a lattice spacing of 4.1479 Å. Further, the three diffraction peaks of SA are located at 20.60°, 21.66°, and 24.26° with a lattice spacing of 4.3106 Å, 4.0996 Å, and 3.6781 Å, respectively. Moreover, the diffraction peaks of CA–SA appear at angles of 11.47°, 19.46°, 21.49°, and 23.63°, and the corresponding lattice spacing distances are 7.6592 Å, 4.5185 Å, 4.1401 Å, and 3.7475 Å, respectively. By comparing the X-ray diffraction patterns of CA–SA binary PCMs with those of pure CA and pure SA, it can be found that the diffraction peaks of CA and SA simultaneously exist in the diffraction patterns of the CA–SA eutectic mixture. After combining the two fatty acids, the diffraction peak of CA at 11.50° changes to 11.47°, and the lattice spacing increases from 0.76372 nm to 0.76592 nm. Moreover, the diffraction peak of SA at 24.26° also shifts to a smaller angle, and the spacing increases by 0.00694 nm. Thus, the molecules of CA and SA enter each other's interlayer and combine to form a eutectic structure, and the similar positions of the diffraction peaks indicate a similar regular crystal structure. The XRD curves of CA–SA–PA and CA–SA–OD ternary systems are shown in Fig. 12. The diffraction peaks of PA are located at 20.43°, 21.66°, and 24.22° with a lattice spacing of 4.3344 Å, 4.1043 Å, and 3.6898 Å, respectively, while the diffraction peaks of OD appear at angles of 20.60°, 21.72°, and 24.58° with lattice spacing of 4.3044 Å, 4.0614 Å, and 3.6234 Å, respectively. By observation and comparison, it can be found that the diffraction peaks of CA–SA and PA or OD simultaneously exist in the diffraction patterns of the ternary eutectic mixture. After PA or OD is compounded with the binary eutectic mixture, the diffraction angle moves to a smaller angle, and the lattice spacing increases accordingly, which indicates that CA–SA and PA or OD form a eutectic structure. The similar positions of diffraction peaks also show that the composite has regular crystal structures similar to the raw material.
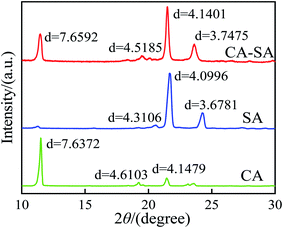 |
| | Fig. 11 XRD curves of CA, SA, and CA–SA binary mixture. | |
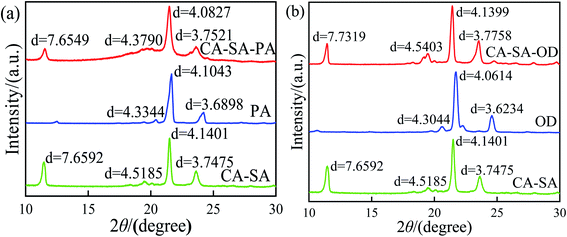 |
| | Fig. 12 XRD curves of CA–SA-based PCMs. | |
3.5 Heat storage and heat release performance of CA–SA-based ternary CPCMs
The step cooling curves of CA–SA–PA and CA–SA–OD ternary eutectic mixtures during the melting–solidification cycles are shown in Fig. 13. Evidently, the PCMs go through three processes in one cycle, namely, endothermic, temperature-stable, and exothermic. In the endothermic process, CA–SA–PA and CA–SA–OD took about 680 s and 880 s to raise the temperature from 5 °C to 45 °C, respectively. While the two kinds of PCMs cost about 1790 s and 1430 s, respectively, to reduce their temperature back to 5 °C. In addition, during the endothermic process, the heating rate of CA–SA–PA significantly decreased in the temperature range of ∼18.2–21.2 °C, which was in the solid–liquid phase transition stage and lasted for about 160 s. The phase transition of CA–SA–OD occurred in the temperature range of 22.1 °C to 27.1 °C, and it stayed for about 290 s. With regard to the exothermic process, CA–SA–PA and CA–SA–OD stayed for 430 s and 390 s in the range of ∼18.4–19.4 °C and ∼23–23.7 °C, respectively, for crystallization. It can be seen that under the same test conditions, the heating time of CA–SA–PA from 5 °C to 45 °C is shorter than that of CA–SA–OD, but the cooling time is longer than that of CA–SA–OD. Therefore, the two kinds of CA–SA-based PCMs have their own advantages in the melting and solidification process, and both have good heat storage and heat release abilities, which can effectively have their own energy storage and temperature control characteristics in practical applications.
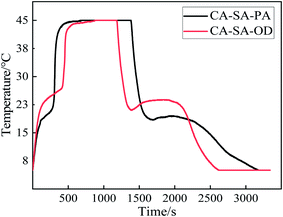 |
| | Fig. 13 Step cooling curves of CA–SA-based PCMs during melting–solidification cycles. | |
3.6 Thermal cycling stability of CA–SA-based ternary CPCMs
Thermal cycling stability is an important parameter to measure the service life of materials. It is verified by comparing changes in the thermal performance parameters of PCMs before and after multiple heat storage and heat release cycles. The variation curves of CA–SA–PA and CA–SA–OD ternary eutectic mixtures after several melting–solidification cycles are plotted in Fig. 14. The melting temperatures of CA–SA–PA after 0, 100, 200, 300, and 500 melting–solidification cycles are 18.60 °C, 18.44 °C, 18.22 °C, 17.79 °C, and 18.47 °C, respectively, and the latent heat of melting is 129.15 J g−1, 124.50 J g−1, 139.14 J g−1, 131.03 J g−1, and 141.99 J g−1, respectively. Therefore, the maximum deviation in the phase transition temperature of CA–SA–PA ternary eutectic mixture is 0.81 °C, and the deviation rate is less than 5%. Moreover, the maximum deviation in the latent heat is 12.84 J g−1, and the change rate is less than 10%. Similarly, Fig. 14(b) and (d) show that the phase transition temperature of CA–SA–OD changes marginally after several melting–solidification cycles, while the fluctuation range in its latent heat of melting is ∼2–16 J g−1, and the deviation is small. Therefore, the phase transition temperature and latent heat of the two kinds of ternary PCMs are within the acceptable range of the experiment, and both of them have good thermal cycling stability. In contrast, CA–SA–PA has better thermal cycling stability than CA–SA–OD, and it is more durable in practical use. It can better maintain its own heat storage and heat release capacity to meet engineering application requirements.
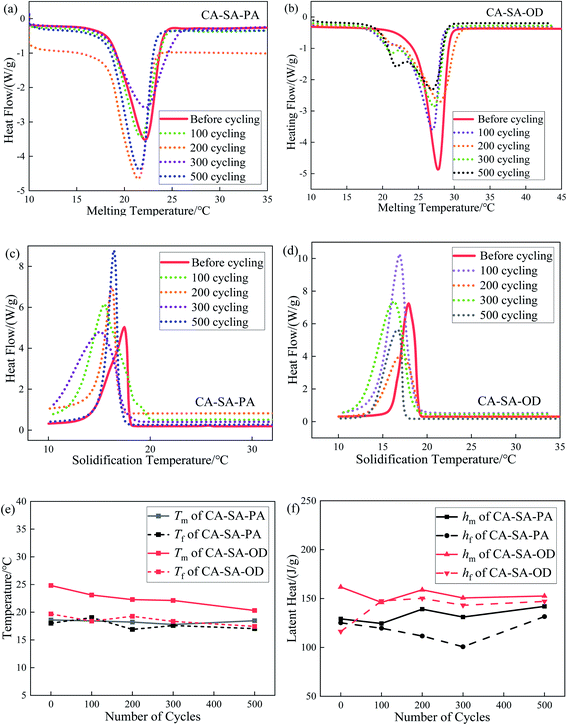 |
| | Fig. 14 Variation curves of thermal performance parameters of CA–SA based PCMs before and after thermal cycling ((a) melting temperatures of CA–SA–PA; (b) melting temperatures of CA–SA–OD; (c) solidification temperatures of CA–SA–PA; (d) solidification temperatures of CA–SA–OD; (e) Tm and Tf of cycles; (f) latent heat of CA–SA–PA and CA–SA–OD). | |
3.7 Chemical stability of CA–SA-based ternary CPCMs
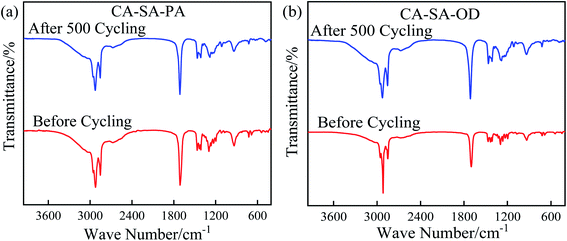
Chemical stability is another important parameter affecting the service life of materials, which is verified by comparing changes in the chemical structure of PCMs before and after multiple heat storage and heat release cycles. The FT-IR curves of CA–SA–PA and CA–SA–OD ternary eutectic mixtures after multiple cycles are plotted in Fig. 15. Evidently, CA–SA–PA and CA–SA–OD have no new characteristic peaks before and after multiple cycles, but only the intensity of the absorption peak changes, which indicates that the two CA–SA-based ternary PCMs have good chemical stability. In practical engineering applications, they can better maintain their own chemical structure stability so as to achieve the desired effect.
 |
| | Fig. 15 FT-IR curves of CA–SA-based PCMs before and after multiple cycles. | |
4. Conclusion
(1) The theoretical ratio, phase transition temperature, and latent heat of ternary eutectic mixtures are reasonably predicted. The theoretical ratios of CA–SA, CA–SA–PA, and CA–SA–OD eutectic mixtures are 89:11, 76:9:15, and 78:9:13, respectively. Moreover, the theoretical phase transition temperatures are 28.38 °C, 25.08 °C, and 25.64 °C, respectively. The theoretical latent heat values are 143.04 J g−1, 144.80 J g−1, and 147.47 J g−1, respectively.
(2) The minimum crystallization temperature of CA–SA binary eutectic mixture was determined to be 25.2 °C by the step cooling curve method, and the corresponding ratio was CA:SA = 90:10. The obtained results show that the phase transition temperature of the CA–SA binary mixture with the ratio of 90:10 is the lowest, and the melting temperature and latent heat are 28.12 °C and 138.96 J g−1, respectively, which are very close to the theoretical prediction.
(3) PA and OD were compounded into the CA–SA binary eutectic mixture. The crystallization temperatures of the two ternary eutectic mixtures with the ratio of CA:SA:PA = 77.4:8.6:14.0 and CA:SA:OD = 81.9:9.1:9.0 were preliminarily determined to be the lowest, which is 19.2 °C and 23.9 °C, respectively. The obtained results show that the melting temperatures of CA–SA–PA and CA–SA–OD are the lowest under the above ratio, namely, 18.60 °C and 24.82 °C, respectively, while the melting latent heat values are 129.15 J g−1 and 161.74 J g−1, respectively, indicating that the temperatures measured by the two methods are close. The FT-IR and XRD data show that there was no chemical reaction in the preparation of CA–SA, CA–SA–PA, and CA–SA–OD eutectic mixtures, and the components had good compatibility, which was induced by intermolecular forces.
(4) The two kinds of ternary eutectic mixtures have their own advantages in the process of melting and solidification, and they have good heat storage and heat release capacity, thermal cycling stability, and chemical stability, which can effectively improve their energy storage and temperature control performance in practical applications. Combined with the above characteristics, it is confirmed that the two CA–SA-based CPCMs are suitable for building energy conservation.
Conflicts of interest
There are no conflicts to declare.
Acknowledgements
This work was supported by the financial assistance from the Natural Science Foundation of China (51966004) and the Program of Qingjiang Excellent Talents (JXUSTQJYX2017003).
References
- E. Elnajjar, Energy Build., 2017, 151, 28–34 CrossRef.
- C. Q. Yao, X. F. Kong, Y. T. Li, Y. X. Du and C. Y. Qi, Energy Convers. Manage., 2018, 155, 20–31 CrossRef.
- F. L. Liu, J. Q. Zhu, B. G. Ma, W. B. Zhou and Y. Y. Li, J. Chin. Ceram. Soc., 2016, 44, 1178–1191 CAS.
- Y. Ma, Y. L. Luo, H. X. Xu, R. Q. Du and Y. Wang, Experimental and Computational Multiphase Flow, 2021, 3, 77–99 CrossRef.
- M. Martín, A. Villalba, A. I. Fernández and C. Barreneche, Energy Build., 2019, 192, 75–83 CrossRef.
- F. Mariaenrica, L. Mariateresa and S. Antonella, Materials, 2019, 12, 1–25 Search PubMed.
- M. Alam, P. X. W. Zou, J. Sanjayan and S. Ramakrishnan, Appl. Energy, 2019, 238, 1582–1595 CrossRef.
- X. Wang, Y. P. Zhang, W. Xiao, R. L. Zeng, Q. L. Zhang and H. F. Di, Chin. Sci. Bull., 2009, 54, 920–928 CAS.
- H. T. He, P. Zhao, Q. Y. Yue, B. Y. Gao, D. T. Yue and Q. Li, Renewable Energy, 2015, 76, 45–52 CrossRef CAS.
- A. Karaipekli and A. Sarı, Renew. Energy, 2008, 33, 2599–2605 CrossRef CAS.
- X. B. Gu, S. Qin, X. Wu, Y. Li and Y. X. Liu, J. Therm. Anal. Calorim., 2016, 125, 831–838 CrossRef CAS.
- Y. P. Yuan, N. Zhang, W. Q. Tao, X. L. Cao and Y. L. He, Renew. Sustain. Energy Rev., 2014, 29, 482–498 CrossRef CAS.
- M. M. Kenisarin, Sol. Energy, 2014, 107, 553–575 CrossRef CAS.
- R. L. Wen, P. Q. Jia, Z. H. Huang, M. H. Fang, Y. G. Liu, X. W. Wu, X. Min and W. Gao, J. Therm. Anal. Calorim., 2018, 132, 1753–1761 CrossRef CAS.
- M. Li, H. T. Kao, Z. S. Wu and J. M. Tan, Appl. Energy, 2010, 88, 1606–1612 CrossRef.
- M. Li, Z. S. Wu and H. T. Kao, Sol. Energy Mater. Sol. Cells, 2011, 95, 2412–2416 CrossRef CAS.
- J. G. Zuo, W. Z. Li and L. D. Weng, Energy Build., 2010, 43, 207–210 CrossRef.
- Y. P. Yuan, L. Bai and B. Niu, Mater. Rev., 2010, 24, 111–113 CAS.
- Y. P. Yuan, W. Q. Tao, X. L. Cao and L. Bai, J. Chem. Eng. Data, 2011, 56, 2889–2891 CrossRef CAS.
- C. Liu, Y. P. Yuan, N. Zhang, X. L. Cao and X. J. Yang, Mater. Rev., 2014, 28, 165–168 CAS.
- L. Ding, L. X. Wang, K. Georgios, Y. J. Lv and W. B. Zhou, J. Wuhan Univ. Technol.-Materials Sci. Ed., 2017, 32, 753–759 CrossRef CAS.
- Q. J. Gu, H. Fei, L. Y. Wang, M. Fang, D. H. Jiang and Y. C. Zhao, Chem. Ind. Eng. Prog., 2019, 38, 5033–5039 Search PubMed.
- M. R. Liu, Z. G. Sun, C. H. Li, M. M. Yang, M. G. Zhu and C. M. Li, Acta Energiae Solaris Sin., 2019, 40, 1553–1559 Search PubMed.
- H. Ke, Appl. Therm. Eng., 2017, 113, 1319–1331 CrossRef CAS.
- Y. S. Yu, Q. S. Jing and F. F. Song, J. Build. Mater., 2013, 16, 97–101 CAS.
- N. Zhang, Y. P. Yuan, X. Wang, X. L. Cao, X. J. Yang and S. C. Hu, Chem. Eng. J., 2013, 231, 214–219 CrossRef CAS.
- J. S. Dai, F. Ma, Z. Fu, C. Li, M. Jia, K. Shi, Y. L. Wen and W. T. Wang, Renewable Energy, 2021, 175, 748–759 CrossRef CAS.
- M. Y. Liu, Y. F. Xu, X. G. Zhang, J. X. Qiao, R. Y. Mi, Z. H. Huang and X. Min, ChemistrySelect, 2021, 6, 3884–3890 CrossRef CAS.
- S. Malvika, S. Sharon, Y. Apurv, K. Sujith and M. A. Anish, J. Electron. Mater., 2021, 50, 1608–1614 CrossRef.
- A. Sharma and A. Shukla, Energy Build., 2015, 99, 196–203 CrossRef.
- Y. B. Cai, X. F. Song, M. M. Liu, F. Li, M. S. Xie, D. L. Cai and Q. F. Wei, J. Therm. Anal. Calorim., 2017, 128, 661–673 CrossRef CAS.
- H. Z. Ke, Z. Y. Pang, B. Peng, J. Wang, Y. B. Cai, F. L. Huang and Q. F. Wei, J. Therm. Anal. Calorim., 2016, 123, 1293–1307 CrossRef CAS.
- Y. P. Yuan, L. Bai and B. Niu, Mater. Sci. Eng. R Rep., 2010, 24, 111–113 CAS.
- P. Zhao, Q. Y. Yue, H. T. He, B. Y. Cao, Y. Wang and Q. Li, Appl. Energy, 2014, 115, 483–490 CrossRef CAS.
|
| This journal is © The Royal Society of Chemistry 2021 |
Click here to see how this site uses Cookies. View our privacy policy here. 
 Open Access Article
 This Open Access Article is licensed under a Creative Commons Attribution-Non Commercial 3.0 Unported Licence
 *,
Qian He,
Linya Wang,
Yucheng Pan and
Jingtao Liu
*,
Qian He,
Linya Wang,
Yucheng Pan and
Jingtao Liu


