DOI:
10.1039/D1RA03918K
(Paper)
RSC Adv., 2021,
11, 30109-30131
Removal of methylene blue dye using nano zerovalent iron, nanoclay and iron impregnated nanoclay – a comparative study
Received
19th May 2021
, Accepted 24th August 2021
First published on 9th September 2021
Abstract
There has been an increasing challenge from the emission of methylene blue (MB) dye-containing wastewater and its management methods in industry. The sorption process is one conventionally used method. In this study, nanoclay, nano zero valent iron (nZVI), and iron impregnated nanoclay were prepared and studied for the removal of MB dye in batch mode. The effects of operating parameters like pH, dye concentration, sorbent dosage, and contact time were investigated and optimized. The nZVI, nanoclay, and iron impregnated nanoclay sorbents showed zeta potentials of −32.1, −53.4, and −40.7 mV, respectively. All the nano adsorbents were crystalline. The nanoclay was characterized by an average surface area, pore volume and pore diameter of 43.49 m2 g−1, 0.104 cm3 g−1 and 2.806 nm, respectively. nZVI showed a surface area of 47.125 m2 g−1, pore volume of 0.119 cm3 g−1, and pore diameter of 3.291 nm. And iron impregnated nanoclay showed a surface area of 73.110 m2 g−1 with a pore volume of 15 cm3 g−1 and a pore diameter size of 3.83 nm. A Langmuir EXT nitrogen gas adsorption isotherm (R2 ∼ 0.99) was the best fit. The thermodynamics parameters, such as ΔG° (−12.64 to −0.63 kJ mol−1), ΔH° (+0.1 to +62.15 kJ mol−1) and ΔS° (+0.10 to +0.22 kJ mol−1), confirmed that a spontaneous and endothermic adsorption process took place at a high rate of disorder. Iron impregnated nanoclay showed higher negative Gibbs free energy (−12.64 kJ mol−1), higher enthalpy change (+62.5 kJ mol−1) and entropy (+0.22 kJ mol−1) and gave a better MB removal performance. In addition, the lower negative heat of enthalpy for all adsorptions proved the dominance of physisorption. The methylene blue adsorption isotherm on nZVI and nanoclay showed the best fit with the Freundlich isotherm model with correlation coefficients (R2) ∼0.98 and 0.99, respectively. Whereas the Langmuir adsorption isotherm was the best fit for iron impregnated nanoclay (R2 ∼ 0.98). The adsorption activities of nZVI, nanoclay and iron impregnated nanoclay were fitted to a pseudo-second-order kinetic model with correlation coefficients (R2) of 0.999, 0.997 and 0.983, respectively. The optimal pH 7.0 (RE: 99.1 ± 0.73%), initial MB concentration 40 ppm (RE: 99.9 ± 0.03%), contact time 120 min (RE: 99.9 ± 0.9%), and adsorbent dose 80 (99.9 ± 0.03%) were obtained for iron impregnated nanoclay. The optimal operational parameters of nanoclay and nZVI, respectively, were pH 11.0 and 13.0, initial MB concentration 20 and 20 ppm, adsorbent dose 100 and 140 mg, and contact time 120 and 140 min. In general, iron impregnated nanoclay has shown promising cationic dye adsorbance for industrial applications; but a recyclability test is suggested before scale-up.
1. Introduction
Significant industrial development was observed from 1950 onwards.1 This growth was attributed to increasing global markets with increasing goods and services and advances in technology. The growth rate of the global annual textile market increased from 1.10% (2014) to 4.80% (2020) and its products have passed through various processes and chemical operations without compromising externality costs.2 Scientific and technological advances have now shifted from the use of raw materials to generic new manmade fibres and other chemical additives such as dyes and various solvents.3 Industries use more than nine thousand different types of chemicals, including dyes, in manufacturing processes and these have aggravated environmental pollution in general.4 During the manufacturing process, every kilogram of textile consumes 100 L of water and about 90% of these inputs get discharged as effluents into natural water bodies.5,6 The effluent is characterized by a high amount of various types of dyes and other organic chemicals.7–9 However, the quantity and nature of the composition depend on the type of fabric and treatment processes, such as mercerization, bleaching, dyeing, and printing, and the technology and equipment adopted and the existing management style.
Wastewater saturated with dyes disturbs the ecological balance of aquatic systems by blocking sunlight from penetrating beneath the water and altering photosynthetic activities etc. Certain dyes typically constitute carcinogenic aromatic amines and toxic heavy metals that affect the central nervous system, reproductive system, and kidneys.10–12 The dye-containing textile wastewater is extremely alkaline and contains high total dissolved solids (TDS), biological oxygen demand (BOD), chemical oxygen demand (COD), and alkalinity that cause human illnesses and irreversible environmental changes.2 The presence of a small amount of dye (1 mg L−1) in wastewater effluent seriously affects the aesthetic and transparency of water bodies and indirectly alters the functioning of aquatic life.13,14 In general, 40% of globally used dyes contain actively bound chlorine, a known carcinogen and a cause of great concern.15 Its origin and aromatic structure make it recalcitrant to microbial degradation and it mostly escapes from a conventional wastewater treatment process.16 Its persistent nature against light, bleach, and temperature challenges most wastewater treatment technologies.
Various technologies involving chemical, physical, biochemical and combined treatment methods have been introduced and put in place to remove dye from textile wastewater. So far, co-precipitation,17,18 coagulation,19 solvent extraction,20 flotation,21 electrochemical treatment,22 ion exchange,23 membrane filtration24 and reverse osmosis25 are among widely used dye removal technologies. Recently, Mesoporous Organo Silicate (PMOS) composites were synthesized and their photocatalytic degradation capacity for methylene blue was tested and an efficiency from 44 to 71% was achieved.26 Nazir et al. (2020) initiated a surface-induced ZIF-67 with Co-layered double hydroxide to remove methylene blue dye from solution.27 The authors developed a composite from in situ grown zeolite imidazolate frameworks (ZIF-67) on layered double hydroxides (LDH) and achieved ∼72.3% methylene blue dye removal efficiency. In another dimension, MOF has also been accustomed to be produced and used for toxic chemical and dye removal.28 Nanozero valent iron (nZVI) has also been reported as a promising cationic pollutant remover from wastewater.29 The synthesis of many other chemical-based nano adsorbent materials synthesis is also familiar. However, most materials are not economical and require huge investment. Most of the materials are expected to be obtained from the global market, which has direct cost implications for an industrial scale.
The high capital and operating costs, the formation of undesirable hazardous intermediates, large sludge production, and interference from other components in wastewater make the physical and chemical methods of dye removal more challenging. Meanwhile, adsorption using nano-matrices has attracted the scientific community greatly due to its eco-friendliness, cost-effectiveness and greater efficiency.30–32 Various nano-matrices, such as multi-walled carbon nanotubes and ligand-immobilized composites, have been utilized to remove dyes from aqueous media and showed high adsorption efficiency.33–35 Numerous forms of nanoclay materials, for instance kaolin,36,37 pumice,38 and bentonite,39,40 have been developed from natural sources and used as adsorbents for heavy metals and cationic dyes and shown relatively good results because of their lower ion exchange capacity and small surface charges. In addition, the materials' accessibility, stability, toxicity, surface area, surfactant nature and structural suitability, such as the availability of active pore space for modification, have been reported as challenges for their use at an industrial scale.12,41
The abundance and suitability for cationic pollutant removal of montmorillonite clay have been reported in studies.42–44 It has a pillared structure with an aluminum cation to increase the inner layer space of the clay.45 In addition, due to the presence of interlayer cations, its higher cation exchange capacity has been reported.42 A similar study indicated that nanosized montmorillonite bulk particles in contact with the human body do not exhibit toxicity or health concerns. Hence, its abundance, low toxicity, and the negative nature of its surfactant make it the best selected cationic pollutant remover in the pristine state or under surface or inner modifications. In Ethiopia, it is found abundantly associated with other crustal surface materials at different qualities.
In this study, montmorillonite mineral-rich clay was collected from a specific place called the ‘ASKO’ gorge of Addis Ababa, Ethiopia, and it was procedurally cleaned, acid-treated, brought to the nanoscale, and applied for methylene blue dye removal under pristine and modified conditions. Its MB removal efficiency was compared with its iron impregnated form and nZVI at various values of pH, initial methylene blue concentration, adsorbent dose and contact time. In addition, the chemical and physical properties of these nanomaterials were characterized and the corresponding dye adsorption properties were studied.
2. Materials and methods
2.1 Source and preparation of nanoclay
The raw natural clay sample was collected from 09° 03′ 45′′ N latitude and 38° 41′ 49.68′′ E longitude (1001776 – Northing & 466716 – Easting); Asko Chereta district, Kolife Keranio sub-city, Addis Ababa city, Ethiopia. Samples were taken from a depth of 2 m from the river flood plain deposits and used for adsorption studies after purification.
The natural clay was manually cleaned and milled using a ball mill (Ball Mill PM & E 132 A, 22 rpm, 220 V) for 30 min. Organic carbon present in the clay was removed by dispersing the milled powder in a 10 percent hydrogen peroxide solution under continuous stirring for 20 min at 30 °C. The slurry was then washed with acidified distilled water (HCl solution, pH 4) under continuous stirring at 800 rpm for 30 min to remove the inorganic carbon. Subsequently, it was allowed to settle for 3 hours at 30 °C. The micro-suspension including floating materials and the top water layer was carefully removed. The clay layer was transferred to a 500 mL beaker and dried overnight at 105 °C and further ground using the ball mill for 5 hours. Finally, the powder was calcined in a muffle furnace (Shapet Electric Company, India) for 6 hours at 720 °C.
2.2 Synthesis of nZVI
FeCl3·6H2O (Sigma-Aldrich, 97%), NaBH4 (Sigma-Aldrich, 97%), and absolute ethanol were used without further purification. The metal reduction method was used to produce nano zero-valent iron (nZVI) particles. About 0.5406 g of FeCl3·6H2O was dissolved in a 4![[thin space (1/6-em)]](https://www.rsc.org/images/entities/char_2009.gif) :
:![[thin space (1/6-em)]](https://www.rsc.org/images/entities/char_2009.gif) 1 (v/v) ethanol/water mixture (24 mL ethanol, 6 mL deionized water) under continuous stirring. A 0.1 M sodium borohydride solution (0.3783 g NaBH4 in 100 mL of deionized water) was prepared and poured into a burette. The borohydride solution from the burette was added drop-wise into iron chloride solution in the flask and nZVI was formed (eqn (1)). Then, it was left for 10 minutes under vigorous stirring. The nanoparticles from the supernatant solution were filtered using two Whatman filter papers (Whatman 42, 125 mm Ø) and simultaneously washed three times with 25 mL of absolute ethanol to remove all the water. The retentate thus obtained was dried at 323 K overnight in an oven and stored in a moisture-free place.
1 (v/v) ethanol/water mixture (24 mL ethanol, 6 mL deionized water) under continuous stirring. A 0.1 M sodium borohydride solution (0.3783 g NaBH4 in 100 mL of deionized water) was prepared and poured into a burette. The borohydride solution from the burette was added drop-wise into iron chloride solution in the flask and nZVI was formed (eqn (1)). Then, it was left for 10 minutes under vigorous stirring. The nanoparticles from the supernatant solution were filtered using two Whatman filter papers (Whatman 42, 125 mm Ø) and simultaneously washed three times with 25 mL of absolute ethanol to remove all the water. The retentate thus obtained was dried at 323 K overnight in an oven and stored in a moisture-free place.| | |
2FeCl3(s) + 6NaBH4(s) → 2Fe0(s) + 6NaCl(aq) + 6B(OH)3(aq) + 21FeH2(g)
| (1) |
2.3 Synthesis of iron impregnated nanoclay
FeCl2·4H2O (Sigma-Aldrich, 98%), NaBH4 (powder 98%, Aldrich 4511-2), and absolute ethanol were used without further purification. The borohydride reduction method used by Karabelli et al. was followed to produce the iron impregnated nanoclay.46 About 1.07 g of FeCl2·4H2O, corresponding to 0.30 g of Fe was dissolved in a 4![[thin space (1/6-em)]](https://www.rsc.org/images/entities/char_2009.gif) :
:![[thin space (1/6-em)]](https://www.rsc.org/images/entities/char_2009.gif) 1 (v/v) ethanol/water mixture (24.0 mL ethanol, 6.0 mL deionized water) and 1.50 g of the nanoclay was added to this solution. The mixture was left in an ultrasonic shaker for 30 min followed by centrifugation at 6000 rpm to separate the precipitated solids and then transferred to a 250 mL conical flask. Meanwhile, sodium borohydride solution was prepared by dissolving 0.61 g in 100 mL of deionized water and was added drop-wise to the aqueous nanoclay/Fe2+ dispersion under continuous stirring until the solution changed to a black precipitate. Once the NaBH4 solution had been consumed completely, the dispersion was stirred for an additional 30 min. Finally, the Fe0 nanoparticles and Fe-nanoclay particles were separated with a centrifuge and dried overnight at 50 °C.
1 (v/v) ethanol/water mixture (24.0 mL ethanol, 6.0 mL deionized water) and 1.50 g of the nanoclay was added to this solution. The mixture was left in an ultrasonic shaker for 30 min followed by centrifugation at 6000 rpm to separate the precipitated solids and then transferred to a 250 mL conical flask. Meanwhile, sodium borohydride solution was prepared by dissolving 0.61 g in 100 mL of deionized water and was added drop-wise to the aqueous nanoclay/Fe2+ dispersion under continuous stirring until the solution changed to a black precipitate. Once the NaBH4 solution had been consumed completely, the dispersion was stirred for an additional 30 min. Finally, the Fe0 nanoparticles and Fe-nanoclay particles were separated with a centrifuge and dried overnight at 50 °C.
2.4 Preparation of adsorbate
A 200 ppm of methylene blue stock solution was prepared by dissolving 117.6 mg of methylene blue (Merck, 85%, M: 319.85 g mol−1) in 200 mL of distilled water. A dilution series with concentrations of 2 ppm, 4 ppm, 6 ppm, 8 ppm, 10 ppm, and 12 ppm was prepared for calibration.
2.5 Methods of material characterization
A Bruker model S4 Pioneer sequential wavelength-dispersive X-ray spectrometer equipped with a goniometer (OVO-55, PET, LiF 200, LiF 220, Ge, ADP and InSb), automatic samplers, 4 kW Rh X-ray tube, 0.23 and 0.46° collimators and SPECTRA plus software was used to analyze the elemental composition of the source natural clay. The particle's shape, structure, and the compositions of nZVI, nanoclay, and iron impregnated nanoclay were characterized with a powder X-ray diffraction (Jeol, Japan) instrument equipped with a Cu Kα radiation source at a scanning range and speed of 5 to 90 °C and 2° min−1, respectively. The KBr method of FTIR spectral analysis was used to identify the molecules, compounds, and surface functional groups of the original clay and iron impregnated nanoclay. The spectra of nZVI, nanoclay and iron impregnated nanoclay were recorded using a spectrophotometer (Alpha II, Bruker) at a wavelength range between 2.5 and 15 μm (wavenumber range from 4000 cm−1 to 400 cm−1). Whereas the shape and surface morphology of the nanomaterials were studied using scanning electron microscopy (JSM 890, JEOL, Tokyo, Japan) at 7 kV and 1 × 10⁻¹² A. A Horiba Scientific SZ 100 (HORIBA, Bangalore, India) instrument and the electrophoretic light scattering (ELS) method were used to determine the zeta potentials of the nanoparticles within a pH range of 2.0 to 13.0. The ELS method of zeta potential analysis provides a better resolution and more reliable zeta potential result than other methods.47,48 Procedurally, the nanoparticles were illuminated with laser light to measure their electrophoretic mobility with a specifically applied electric field. Finally, the Smoluchowski equation (eqn (2)) that has been reported in the literature was used to calculate the zeta potentials of the nanoparticles.49,50| |
 | (2) |
where ζ is the zeta potential, ηt is the viscosity of the dispersion medium (mPa S), μ is the electrophoresis mobility of the nanoparticles at a particular temperature (cm2 V−1 s−1), ε is the dielectric constant of the dispersant liquid (water: 78), π is the constant (3.14).
A Nova Station A (Quantachrome Instruments, Florida, USA) was used to analyze the surface area, pore size distribution and adsorption/desorption isotherm of the nanomaterials. The test was carried out in a high nitrogen (99.5% N) and low oxygen environment. About 0.2905 g (0.25937 cm3 (v)) was degassed with nitrogen gas for 6 h at a temperature of 150 °C. Then, the adsorption analysis of the nanomaterials (nZVI, nanoclay and iron impregnated nanoclay) was performed for 200.9 min. A t-plot (de-Boer, FHH) method that was reported in ref. 51 and 52 was used to determine the pore size, micro/mesopore volume and specific surface area of the nZVI, nanoclay and iron impregnated nanoclay.
2.6 Adsorption experimental design
The MB adsorption capacity of each nanomaterial (nZVI, nanoclay and iron impregnated nanoclay) was evaluated by conducting batch adsorption experiments. The experiments were conducted with the aid of 100 mL stoppered bottles with 50 mL methylene blue solutions of concentrations ranging from 20 to 120 ppm kept in a thermal shaker under controlled conditions (temperature 30 °C, agitation speed 80 rpm). The adsorption parameter optimization was conducted at a contact time of 140 min. Firstly, optimization of adsorbate concentration was conducted by varying the MB concentration between 20 and 140 ppm while keeping the pH at 7.5 and the dosage at 60 mg. Then, optimization of pH was conducted experimentally by varying the pH level from pH 3 to pH 13 at a constant concentration (60 ppm) and adsorbent dosage (60 mg). Whereas the adsorbent dosage was optimized using experiments conducted at different dosage levels ranging from 20 to 140 mg and a constant pH 7.5 and concentration 60 ppm. Lastly, optimization of the contact time for adsorption of MB was conducted at different times between 20 and 140 min, while keeping the pH and concentration constant at 7.5 and 60 ppm, respectively. The residual MB concentration that remained in the solution was measured using a UV-Vis spectrophotometer (UV 2600 Shimadzu, Japan) at a wavelength of 663 nm. The MB removal (adsorption) efficiency (RE) as % of the adsorbents was calculated with eqn (3).| |
 | (3) |
where RE is the removal/adsorption efficiency, %; Cfinal is the final concentration of methylene blue in the solution, mg L−1, Cinitial is the initial concentration of methylene blue in the solution, mg L−1.
3. Results and discussion
3.1 Properties of the adsorbents
3.1.1 Elemental composition (XRF analysis) of source natural clay. The chemical compositions of the source nanoclay are summarized in Table 1. The source nanoclay contained predominantly SiO2 (47.6%) and Al2O3 (23.39%) followed by Fe2O3 (3.8%), K2O (1.53%) and TiO2 (1.17%). In addition, it contained trace amounts of MgO (0.72%), Na2O (0.7%), CaO (0.35%) and P2O5 (0.07%). The amount of silicon dioxide contained in the nanoclay was about twice that of aluminum oxide. As per Uddin's (2012) report, the 2![[thin space (1/6-em)]](https://www.rsc.org/images/entities/char_2009.gif) :
:![[thin space (1/6-em)]](https://www.rsc.org/images/entities/char_2009.gif) 1 ratio of SiO2 to Al2O3 in the nanoclay materials confirmed the predominant composition of montmorillonite minerals.42
1 ratio of SiO2 to Al2O3 in the nanoclay materials confirmed the predominant composition of montmorillonite minerals.42
Table 1 Elemental composition of source nanoclay materials
| Compound name |
SiO2 |
TiO2 |
Al2O3 |
Fe2O3 |
CaO |
MgO |
Na2O |
K2O |
P2O5 |
| Composition, % |
47.6 |
1.17 |
23.39 |
3.8 |
0.35 |
0.72 |
0.7 |
1.53 |
0.07 |
In addition, Engidasew and Abay's (2016) report showed the dominance of acidic welded tuff parent materials at a site with the same nanoclay source as the present study.53 The chemical weathering of the welded tuff in this area produces a nanoclay with a high composition of montmorillonite. Besides, the presence of different ions (Ca2+, Mg2+, Na+, K+) indicates the substitution of cations at the interlayer of the nanoclay sheet structure.
3.1.2 XRD analysis of the nano clay, nZVI and iron impregnated nano clay. The presence of major and micro peaks in the XRD spectrum confirmed the crystallinity of the nanoclay (Fig. 1(a) and (b)). The nanoclay characteristics with various XRD spectral peaks appearing at 2θ degrees of 20.70, 26.47, 36.26, 49.81, 59.48, and 73.08 with respective (hkl) Miller indices of (001), (011), (110), (112), (121) and (104) resembles the characteristics of a hexagonal silica crystalline solid material. Also, it has a spectral signature similar to a cubic structured potassium aluminum silicate (KAlSi2O6). The nanoclay spectral peaks were characterized by a d-spacing range between 4.29 Å and 1.29 Å. The average crystallite size of the nanoclay was 86.3 nm. The disappearance of the micro peaks, the smaller amplitude of the large peaks, and peak dislocations on the spectrum (Fig. 1(b)) showed the material structural change due to adsorption of methylene blue. In general, spectral changes in terms of their intensity and peak sizes after the adsorption process indicated the formation of new chemical species; which indirectly proves chemisorption processes in the system. Studies supported this conclusion, in which new particle sizes, peak intensities, peak disappearance and the formation of new peaks gave estimates for chemisorption and XRD determined all these occurrences.54
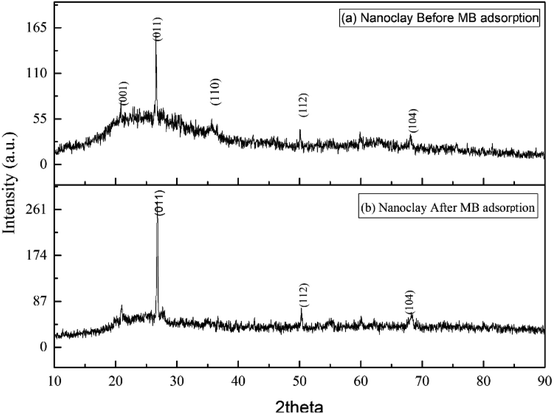 |
| | Fig. 1 (a) Nanoclay XRD chromatogram before adsorption and (b) nanoclay XRD chromatogram after adsorption. | |
The appearance of peaks at 2θ 45.66°, 62.96° and 82.31° with Miller indices (110), (200) and (211), respectively, reveals the existence of zero-valent state iron in the diffracted powder materials (Fig. 2(a)). A very small peak was observed at 2θ 30° (201) to indicate the formation of FeO. NZVI is unstable in aqueous and forms an oxide coating.55 The outer surface of the core–shell of iron (0) in aqueous media was covered by iron oxide (FeO–OH) and Fe2O3. These outer surface oxides appeared in the nZVI XRD spectrum at 2θ degree locations between 37.5° and 40° at hkl (311) for Fe2O3 and (211) for FeOOH. In addition, the average size distribution of the nZVI crystallite produced for this study was 62 nm. A destructive mode of spectral characteristics was observed on the spectrum after the adsorption process (Fig. 2(b)). The crystalline structure of the nZVI adsorbent was shifted to the amorphous state. The peak shown at 2θ degree and corresponding Miller indices 32.23° (121), 59.23° (400) and 61.69° (151) indicated the presence of chlorine that was produced from the destruction of methylene blue dye during the sorption processes (Fig. 2(b)). And the result showed the activity of chemisorption and formation of a chlorine peak in the XRD band. In general, the peak result was comparatively similar to a previously reported finding in Sun et al.56
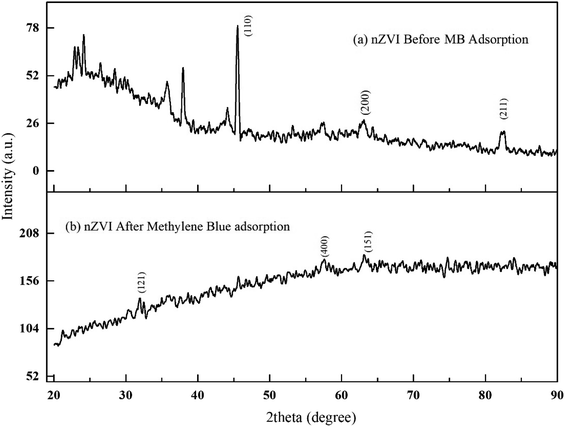 |
| | Fig. 2 XRD patterns of nZVI: (a) before adsorption, (b) after adsorption. | |
Fig. 3(a) shows the functional groups of both parent materials (precursor/ferrous salt and matrices/nanoclay) of the iron impregnated nanoclay. The broad spectrum that is shown in the lower part of the XRD pattern (Fig. 3(a)) indicated the presence of silicate compounds, iron and other impurities. Fig. 3(b) shows the peaks of chlorinated compounds, adsorbent major compositions such as silicate at 2θ 27.05° and other impurities. As shown in Fig. 3(a), the peak of zero state iron particles had disappeared from the 2θ angles of 44.23°, 63.83° and 81.13° as a result of adsorbent structural changes from crystalline to amorphous. As shown in Fig. 3(b), most of the peaks of the XRD patterns had disappeared and its size including the intensity count had changed. In general, the disappearance and size reduction of the peaks of iron impregnated nano clay as well as the change in its structure from crystalline to slightly amorphous proved the presence of chemisorption activities. Under similar conditions to those reported by Tengco et al. (2015), the chemical transformation of an adsorbate may change the chemistry of the adsorbents and cause changes in the XRD patterns and overall behavior in the peaks of the materials.54
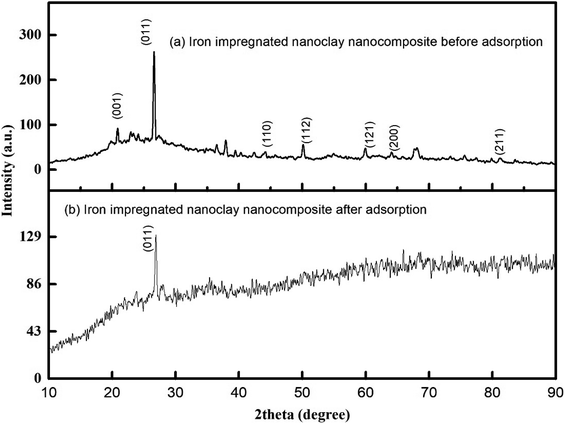 |
| | Fig. 3 XRD patterns of iron impregnated nanoclay: (a) before adsorption, (b) after adsorption. | |
3.1.3 SEM of the nZVI, nano clay and iron impregnated nanoclay. The nZVI adsorbents exhibited a spherical shape (Fig. 4(a)). The SEM image (Fig. 5(a)) does not show the shape of the nanoclay clearly. But, upon referring to the literature,57 the nanoclay and iron impregnated nanoclay had a plate-like (sheet) structural shape. In addition, the average crystallite sizes of nZVI, nanoclay and iron impregnated nanoclay were about 62, 89.1 and 72.4 nm, respectively. The majority of the nZVI particle distribution lay in the range of 50 to 70 nm (Fig. 4(b)). As shown in the Gaussian modeled particle size distribution curve in Fig. 5(b), many particles of the nanoclay were found in the size range 70 to 90 nm; whereas the dominant portion of the iron impregnated nanoclay was found in the size range between 50 and 80 nm (Fig. 6(b)). In the study, the addition of iron into the nanoclay together with the impregnation activity using chemicals and the thermal process has improved the size of the particles to relatively smaller sizes compared to the original nanoclay. Previous study reports showed the effect of calcination and chemical processes on nanoclay size reduction and change in the character of the crystallinity.58 A similar study has reported the fact that nanoparticles show temperature selection for the lowest possible size and crystallinity formation; Nd:Y2O3 composite nanoparticles achieved the smallest size of less than 100 nm at a calcination temperature of 600 °C compared to temperature ranges between 800 and 1100 °C. In this study, the nanoclay and iron impregnated nanoclay were calcined at a temperature of 720 °C for 6 hours to achieve the lowest possible size of particles, as shown in Fig. 4–6.
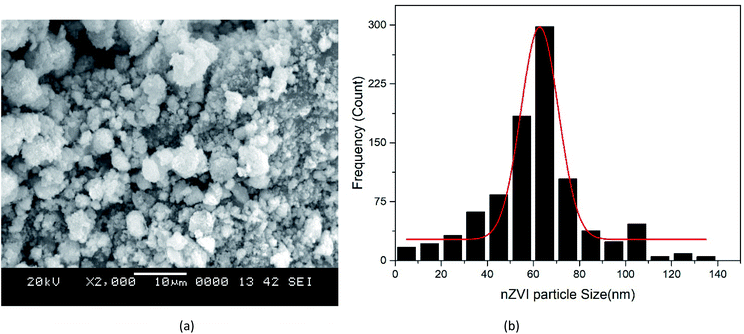 |
| | Fig. 4 nZVI: (a) SEM image, (b) particle size distribution. | |
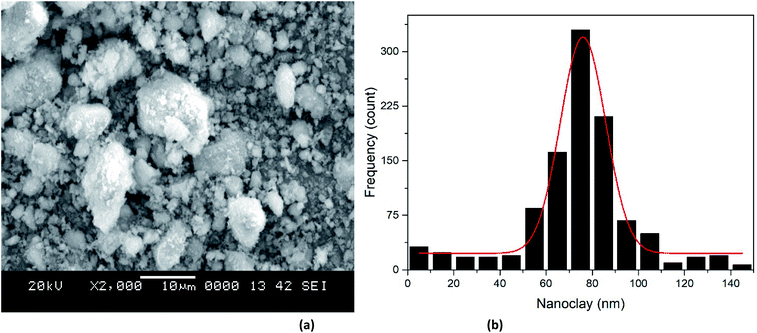 |
| | Fig. 5 Nanoclay: (a) SEM image, (b) particle size distribution. | |
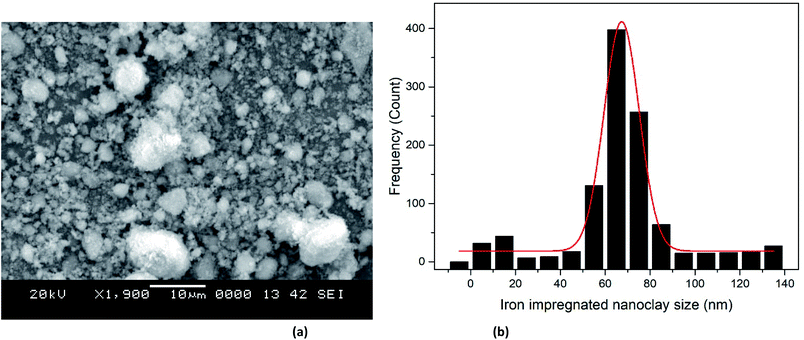 |
| | Fig. 6 Iron impregnated nanoclay: (a) SEM image, (b) particle size distribution. | |
3.1.4 FTIR of the nZVI, nanoclay, and iron impregnated nanoclay. Fig. 7(a) shows the spectrum of freshly prepared nZVI materials. According to previous studies, the band that appears at 460.90 cm−1 reveals the presence of hematite (α Fe2O3) and the band observed at 670 cm−1 is due to the asymmetric stretching of Fe–O.59–61 As referenced by the same author, the band observed at 796.46 cm−1 is due to the bending of hydroxyl groups of goethite. In addition, the broad band appearing at 1060.66 cm−1 is attributed to the presence of γ-FeOOH. Similar peak and band analysis results have been reported in previous studies.37,60,62 Thus, the FTIR results proved that the surface of nZVI was covered by various iron oxides. Fig. 7(b) shows the FTIR band of nZVI after adsorption of MB dye. The band formed at a lower spectrum near 500 cm−1 is ascribed to the bond movement of carbonyl (–OCH3 produced from the degradation of MB). Whereas, secondary amine (–C–NH–) bending was observed at 1290.0 cm−1. Also, the peak that appeared at 1546.8 cm−1 showed the formation of a primary amine (–C–NH2) stretch. In addition, the band formed at 545 cm−1 showed the formation of chlorine generated from methylene blue destruction. The last small band formed at 3404.31 cm−1 was a normal polymeric OH stretch. In general, the bands observed on nZVI confirmed the contribution of both chemisorption and physisorption in MB removal.
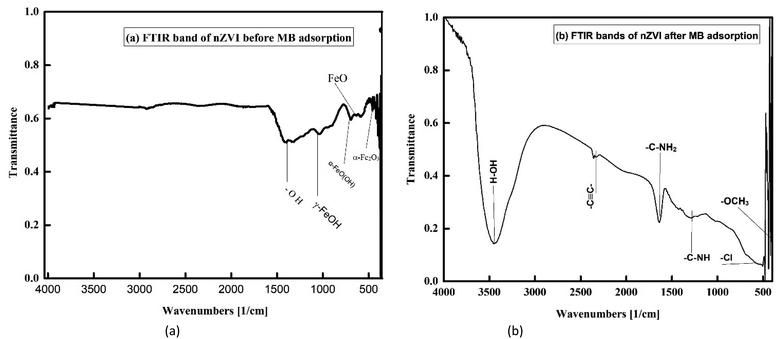 |
| | Fig. 7 FTIR Images of nZVI: (a) before MB adsorption, (b) after MB adsorption. | |
Fig. 8(a) and (b) show the various FTIR bands formed on nanoclay before and after application of the nanomaterial for the experiment. According to Coates (2006), the broad band formed at 1067.76 cm−1 was due to Si–O–Si bond vibration. Whereas the formation of multiple bands between 469 and 800 was the result of Al–OH vibration as well as bending of the Si–H bond.59 Fig. 8(b) shows the nanoclay FTIR band after the MB dye sorption process. Multiple bands formed below 500 cm−1 show the presence of carbonyl groups (–O–CH3). While a small band formed at 1064.18 cm−1 is due to the skeletal –C–C– vibration of adsorbed MB. Primary amine (–NH2–) and secondary amine bending have also been observed at 1636.34 cm−1 and 1290 cm−1. The observed bands for various species of sorbent bond vibrations and bending show the removal of MB.
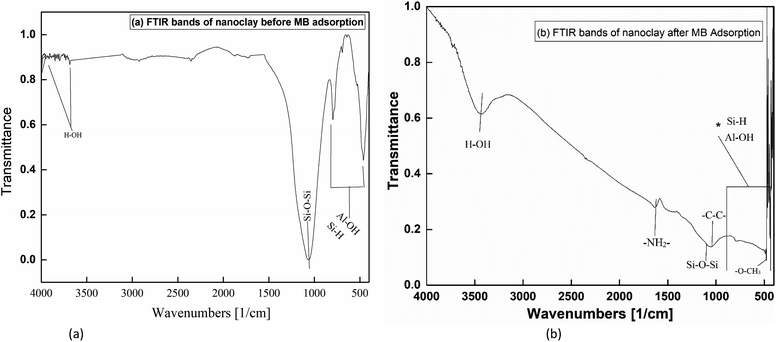 |
| | Fig. 8 FTIR Images of nanoclay: (a) before MB adsorption, (b) after MB adsorption. | |
The FTIR spectrum of iron impregnated nanoclay shows the formation of multiple bands (Fig. 9(a)). In the composite FTIR spectrum, the lowest multiple bands were formed due to the asymmetric stretching of Fe–O and the bending of Al–OH bonds. Like the nanoclay, the vibration of Si–O–Si was observed by a band at 1037.52 cm−1. The other bands observed between 550 and 700 cm−1 were attributed to Si–H bond vibrations. The band appearing at point 1037.52 cm−1 confirmed the presence of γ-FeOOH in the composite. As shown in Fig. 9(b), many bands were formed on the FTIR spectrum of iron impregnated nanoclay after the sorption experiment. Several bands that were formed between 400 and 500 cm−1 showed the presence of various carbonyl groups (–OCH3) and primary amine (–HN–). The Si–O–Si bond vibration was also observed in the band of 1067.76 cm−1. The appearance of a small band at 1635.00 cm−1 indicated the formation of sulfate ions (SO2−/SO2−). A C–C triple bond vibration band was also observed at 2327 and 2355 cm−1. The broad band observed at 3444.15 cm−1 confirmed the water H–OH bond vibrations.
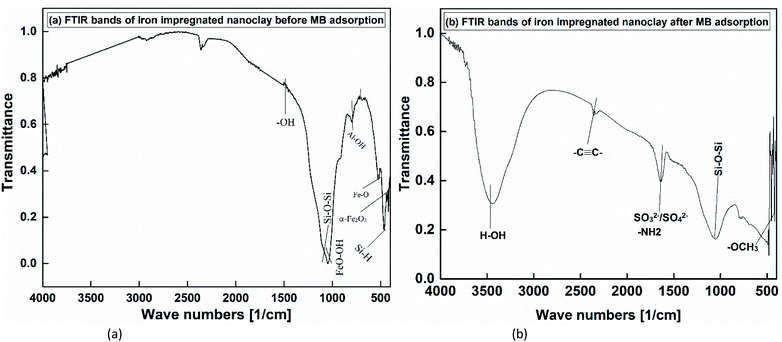 |
| | Fig. 9 FTIR of iron impregnated nanoclay: (a) before MB adsorption, (b) after MB adsorption. | |
3.1.5 BET analysis of the nZVI, nanoclay and iron impregnated nanoclay.
Surface properties. The surface properties and nitrogen adsorption behaviors of the nZVI, nanoclay and iron impregnated nanoclay were determined with a BET analyzer. The average surface area, pore volume and pore diameter of the nanoclay were 43.49 m2 g−1, 0.104 cm3 g−1 and 2.806 nm, respectively (Table 2). The nZVI was characterized by an average surface area of 47.125 m2 g−1, pore volume of 0.119 cm3 g−1, and pore diameter of 3.291 nm. Whereas the average surface area of the iron impregnated nanoclay was about 73.110 m2 g−1, which is greater than the surface area of the nZVI (47.125 m2 g−1) or nanoclay (37.72 m2 g−1). In addition, its pore volume and pore diameter size were found to be 0.15 cm3 g−1 and 3.83 nm, respectively. All the nanoparticles showed a mesoporous particle character with pore sizes found to be between 2 and 50 nm (Table 2).
Table 2 Surface properties of the materials (nZVI, nanoclay and iron impregnated nanoclay)
| Sample |
BET surface areas, m2 g−1 |
Pore volume, cm3 g−1 |
Pore diameter, nm |
| nZVI |
47.125 |
0.119 |
3.291 |
| Nanoclay |
43.49 |
0.104 |
2.806 |
| Iron impregnated nanoclay |
73.110 |
0.15 |
3.83 |
Nitrogen adsorption isotherms. As shown in Fig. 10, the observed flattish isotherm curve formed at lower pressure represented the uneven distribution of monolayer formation due to strong interaction between adsorbates on the iron impregnated nanoclay adsorbent pore spaces. A convex curve adsorption activity trend was observed. The adsorption experimental data of iron impregnated nanoclay was fitted to the Freundlich EXT isotherm equation (R2 ∼ 0.92), Langmuir EXT isotherm (R2 ∼ 0.99) and BET model (R2 ∼ −0.40) (Fig. 10(a)–(c)). The Langmuir EXT isotherm model best explained the gas adsorption character of the iron impregnated nanoclay. The adsorption activity of iron impregnated nanoclay fitted negatively with the BET adsorption isotherm model, which does not simulate the character at all. Fig. 10 shows a type III adsorption isotherm trend that confirms the weak adsorbate–adsorbent interaction. This type III adsorption phenomenon was further supported by the negative C-value of the BET model. A type III isotherm has an extremely low (⋘<1) C-value for BET isotherm model fitting.63 As explained by Condon (2006), in a type III adsorption isotherm model strong interactions are found between adsorbates. The adsorbate forces another adsorbed adsorbate onto the active sites of a given adsorbent. The fit to the Langmuir EXT model confirmed the existence of a monolayer adsorption character in the system. The adsorbate was unevenly distributed on the iron impregnated nanoclay adsorbent surfaces with a relatively high concentration of adsorbate located in the most active area. The increasing adsorption convex curve was facilitated by the greatest interaction of adsorbate with the adsorbed layer.
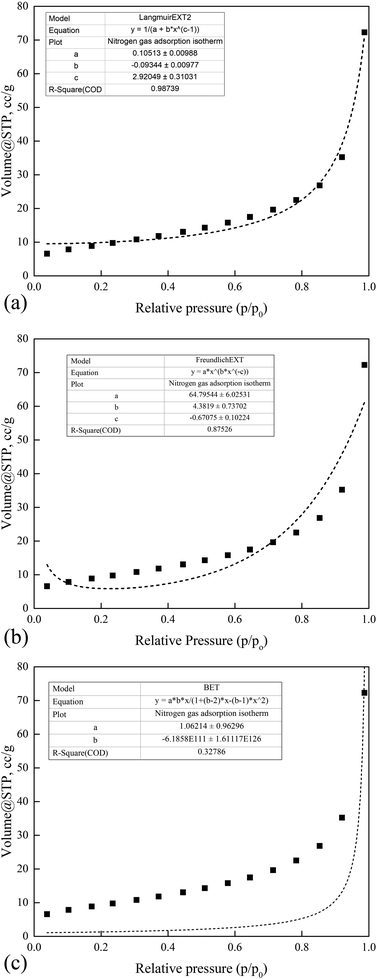 |
| | Fig. 10 Nitrogen adsorption isotherm characteristics of the nano zerovalent iron (nZVI) particle: (a) Langmuir, (b) Freundlich and (c) BET. | |
In addition, the observed adsorption value of nanoclay showed the best curve fit with the Freundlich isotherm model at R2 ∼ 0.92 and p ⋘ 0.05 (Fig. 11). Whereas the Langmuir and BET isotherm models were fitted with the experimental values of nitrogen gas adsorption trends with R2 ∼ 0.80 and −0.40, respectively. The negative correlation coefficient reported for the BET isotherm model fit and the lower correlation coefficient in the case of the Langmuir model confirmed the type III isotherm trend that occurred in the system. The absence of a C-value and the negative R2 for the BET isotherm model indicated the presence of a type III isotherm in the adsorption system in this study.
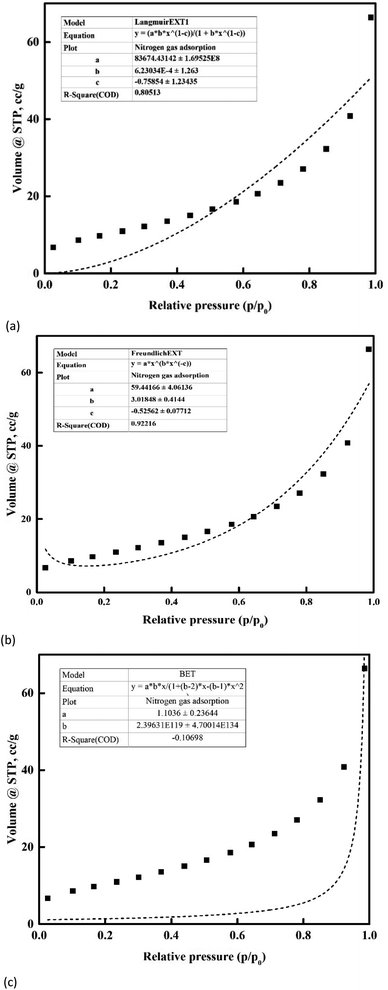 |
| | Fig. 11 Nitrogen adsorption isotherm characteristics of the nanoclay: (a) Langmuir, (b) Freundlich and (c) BET. | |
Furthermore, a Langmuir EXT adsorption isotherm model best described the gas adsorption behavior of nZVI with R2 ∼ 0.98. Whereas a very weak adsorption fit was observed for Freundlich EXT and BET with R2 ∼ 0.88 and 0.32, respectively. As shown in Fig. 12(a)–(c), monolayer adsorption processes had taken place. As illustrated in Fig. 12, the flattish part of the isotherm at the lower part of the adsorption curve shows the lower activity of monolayer formation.
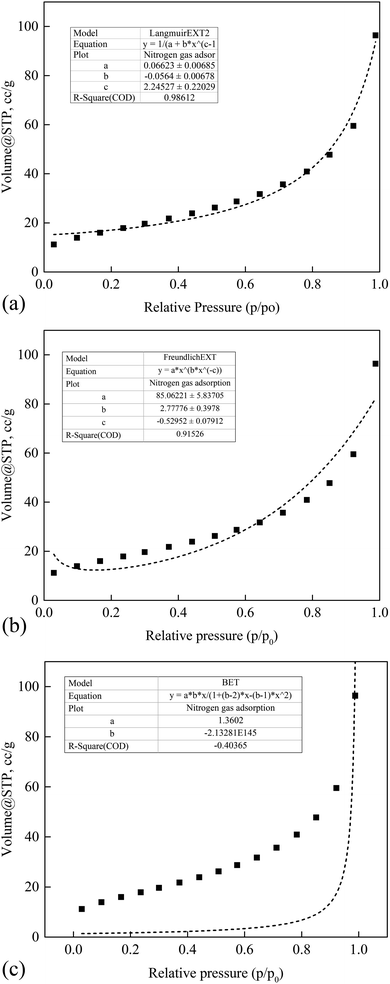 |
| | Fig. 12 Nitrogen adsorption isotherm characteristics of the iron impregnated nanoclay: (a) Langmuir, (b) Freundlich and (c) BET. | |
3.1.6 Zeta potential analyses of nZVI, nano clay and iron impregnated nanoclay. The zeta potential measures the stability and dispersion ability of the colloidal particles in an aqueous solution; possessing an extremely high positive or negative zeta potential causes higher repulsion forces between the nanoparticles and results in the higher dispersibility of particles in the solution.64 This makes the charged nanoparticles available uniformly throughout the solution. In this study, the average zeta potentials of nZVI were found in the range of −75 mV to +12.5 mV and its average result was about −32.1 mV (Fig. 13). The result was consistent with the zeta potential value of −32.0 mV that was reported for nZVI particles.65 Also, this study found the average zeta potential values of nanoclay and iron impregnated nanoclay to be −53.4 mV and −40.7 mV, respectively. Nanoclay showed a zeta potential range of −92.5 mV to −15 mV; whereas a zeta potential range between −70 mV and −5 mV was observed for the iron impregnated nanoclay (Fig. 14 and 15).
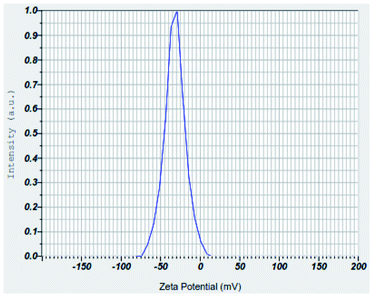 |
| | Fig. 13 Zeta potential of nZVI. | |
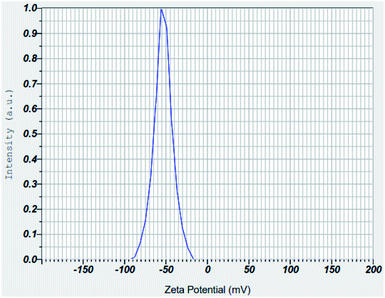 |
| | Fig. 14 Zeta potential of nanoclay. | |
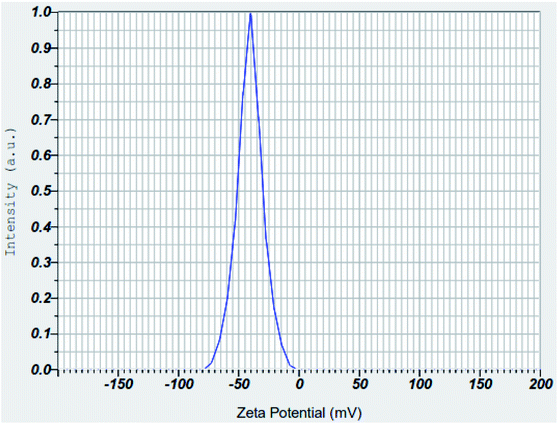 |
| | Fig. 15 Zeta potential of iron impregnated nanoclay. | |
Studies have indicated that nanoparticle average zeta potentials in the range −30 mV to 30 mV have generally been considered as having sufficient repulsive force to attain colloidal stability; whereas a smaller zeta potential value results in aggregation and flocculation due to van der Waals attractive forces.66 So all nanoparticles produced in this study have better stability for application as an adsorbent. Increasing the pH of the solution exhibits an increasing trend of negative zeta potential of the nZVI colloids, with a zeta potential range of −75 mV to +12.5 mV. A zeta potential change trend of the nZVI particles from highly positive (+52.5 mV at pH 5.0) to highly negative (−50 mV at pH 13.0) was reported; the formation of an iron complex with more OH− at high pH increases the negative surface charge of the nZVI colloids.67 A similar chemical phenomenon and trends were observed in the nZVI application of this study. The result of the zeta potentials of nanoclay was consistent with previous studies. For instance, the zeta potential of Turkish nanoclay at a pH ranging from 2.5 to 11.0 was reported to range from −13.1 to −49.5 mV and showed the exchange of complexes on –SiOH and –AlOH sites at higher pH conditions.68 As stipulated in the same literature, kaolinite clay showed the most negative zeta potential ranging from −24 mV to −49.0 mV; whereas the chlorite and illite clay groups showed zeta potentials from 0 to −36.5 mV and 0 to −42.0 mV, respectively. Another study showed a consistent zeta potential of montmorillonite-based clay from −25 to 42.5 mV at a pH range 2.0–11.0.69 Also, another study reported the zeta potentials of a non-modified montmorillonite nanoclay and silver supported nanoclay at pH 6.5 to be −42.5 mV and −33.4 mV, respectively.70
In general, the zeta potential of the nanoclay in this study was found to be in the range reported in previous studies. The nanoparticles in this study have shown higher zeta potential values that tend to have a stably dispersed colloidal matter in solution. Also, the high negative zeta potentials indicated the availability of negatively charged surfactants over the outer surface of the nanoparticles which gave the best suitably selected adsorbent for cationic pollutants such as methylene blue dye.
3.2 Methylene blue removal mechanisms
A chemical reduction, degradation, complexation, and precipitation process has determined the availability of methylene blue (MB) in solution. The reduction of methylene blue involved oxidation of Fe0 (eqn (4)) followed by the chemical reduction of methylene blue.71 The electron emitted from nZVI (Fe0) changed the MB to colorless leuco-methylene blue (eqn (5)). As has been noted by Sun et al. (2015), the recoloring of a test solution occurs with aeration if the removal of dyes proceeds by only a reduction process without chromophore bond cleavage. The decolorization process is reversible under the condition of oxygen gas availability; it is reduced to colorless leuco-methylene blue and oxidized back to its original dye structure when it gets aerated. In this study, the non-recoloring phenomena observed with aeration have confirmed the presence of nitro group bond cleavage.| |
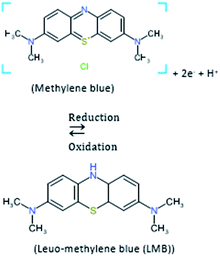 | (5) |
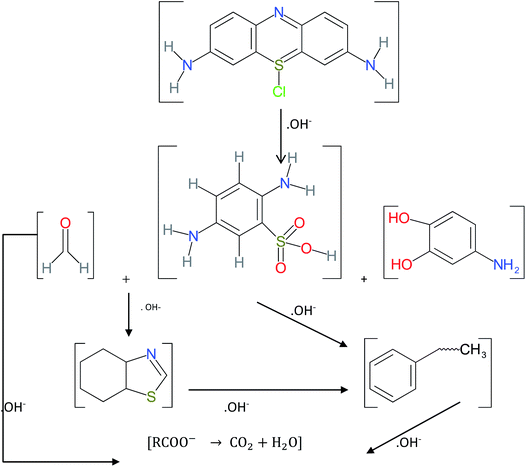
The hydroxyl radical formed from the Fenton reaction in an acidic medium cleaves the chromophore from the methylene blue molecular structure and changes it into various byproducts.72,73 The nZVI or iron found in the composite is oxidized with the products of iron(II) and peroxide (eqn (6)). The peroxide further reacts with iron(II) and produces iron(III), hydroxide ions, and hydroxide radicals (eqn (7)). These hydroxide radicals with their strong oxidizing capability reduce MB through cleavage of the chromophore from its molecular structure and produce various intermediates (eqn (8) and (16)).
| | |
nZVI(Fe°) + O2 + 2H+ → Fe2+ + H2O2
| (6) |
| | |
Fe2+ + H2O2 → Fe3+ + ˙OH + OH−
| (7) |
| | |
MB + ˙OH → CO2(g) + H2O + intermediates
| (8) |
In addition, methylene blue and its intermediate in the solution are adsorbed onto nZVI and its corrosion products, clay and iron impregnated clay surfaces (eqn (9)–(11)). Whereas, as was also noted by Noubactep (2010), the complexation, subsequent flocculation, and precipitation play a great role in methylene blue removal from solution. The precipitates of iron(II) and iron(III) oxides with methylene blue and its intermediate are formed in solution or on the surface of the iron-containing adsorbent.74 As shown in eqn (12)–(15), coprecipitation and flocculation also possibly take place in the solution.
| | |
nZVI + MB or intermediate → nZVI–(MB or intermediates)
| (9) |
| | |
Iron oxide/hydroxide + MB or intermediate → iron oxide/hydroxide–(MB or intermediates)
| (10) |
| | |
Nanoclay + MB or intermediate → nanoclay–(methylene blue or intermediates)
| (11) |
| | |
Iron-impregnated nanoclay + MB → iron impregnated nanoclay–(MB or intermediates)
| (12) |
| | |
Fe2+ + MB or intermediates → Fe(II)(MB or intermediates)
| (13) |
| | |
Fe3+ + MB or intermediates → Fe(III)(MB or intermediates)
| (14) |
| | |
nFex(OH)y(3x−y) + MB or intermediates → (MB or intermediates)[Fex(OH)y(3x−y)]n
| (15) |
| |
 | (16) |
3.3 Adsorption result of MB using nZVI, nano clay, and iron impregnated nanoclay
3.3.1 Effect of pH on MB adsorption. The adsorption characteristics of the nanomaterials were profoundly influenced by pH changes. Typically, the solution pH affected the surface charge of the adsorbent, which is characterized by zero points of charge. A solution with lower pH than the zero points of charge of the adsorbent is characterized by having a positive surfactant and attracts only negatively charged pollutants. Whereas a solution with a pH greater than the zero point of charge of the adsorbent provides an excess negative surfactant and attracts positively charged contaminants. nZVI has shown a ZPC of ∼8.2.56 Depending on the type of clay minerals they contain, various nanoclay adsorbents have shown a ZPC ranging between 3.0 and 6.6, and no point of zero charge was observed for a 2![[thin space (1/6-em)]](https://www.rsc.org/images/entities/char_2009.gif) :
:![[thin space (1/6-em)]](https://www.rsc.org/images/entities/char_2009.gif) 1 layered natural clay.75 The clay in this study was dominated by montmorillonite minerals which has resulted in a lowered ZPC for the nanoclay and iron impregnated nanoclay.
1 layered natural clay.75 The clay in this study was dominated by montmorillonite minerals which has resulted in a lowered ZPC for the nanoclay and iron impregnated nanoclay.Fig. 16 shows the better adsorption performance of clay and iron impregnated nanoclay at extremely low pH compared to nZVI. In addition to the formation of SiOH and –AlOH complexes, the increasing pH of the solution facilitates the formation of iron complexes of mainly Fe(OH)4− and Fe(OH)63− from the nZVI and increases the negative surfactants of the adsorbents.72 This phenomenon increases the negative zeta potentials of the nanoparticles, contributing to adsorption of the cationic pollutants from solution.67,68,76 Similar trends were observed in this study. The increased methylene blue removal from the test solution under higher pH conditions in the case of all nanoparticle applications demonstrated the increased negative charge of the surfactants as a result of higher numbers of OH–, iron, –SiOH, and –AlOH complexes. The concentration of methylene blue in all studied adsorbents decreased and reached equilibrium conditions within two hours of the reaction time and its MB removal efficiency increased with an increase in the pH of the system (Fig. 16).
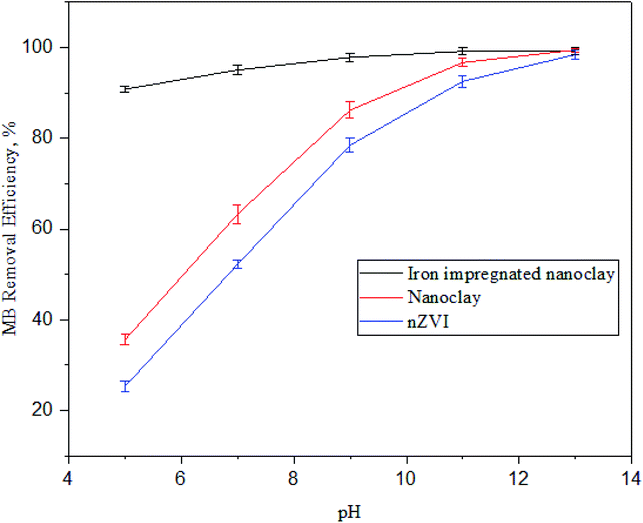 |
| | Fig. 16 Trends of methylene blue dye adsorption at different pH values (n: 3, adsorbent dose: 60 mg, MB concentration: 60 ppm, temperature: 30 °C and contact time: 180 min). | |
As shown in Fig. 16, MB adsorption on nZVI, nanoclay, and iron impregnated nanoclay adsorbents was generally affected by the adsorbent's zeta potential. The lower negative surfactants at lower pH were likely to cause lower adsorption; however, its efficiency increased with the rising pH of the system under all conditions. High negative zeta potentials were reported for clay (−53.4 nV) and iron impregnated nanoclay (−40.7 mV); higher adsorption activity was also observed for iron impregnated nanoclay and nanoclay, respectively. In the study, higher MB removal activity of iron impregnated nanoclay was observed despite its zeta potential being less than that of nanoclay. This phenomenon was further justified by the contribution of additional physisorption of MB on iron, –AlOH, and –SiOH complexes. Iron impregnated nanoclay showed better MB removal efficiency (90.8 ± 0.69%) at lower pH (pH: 5.0) and its optimum MB removal activity (RE: 99.1 ± 0.03%) was reached at pH 7. In addition, the MB removal efficiency of the nanoclay at pH 5.0 (35.6 ± 1.2%) was better than that of nZVI (25.2 ± 1.2%) and reached its optimum MB removal activity with RE: 97.6 ± 0.96% at pH 11.0 for nanoclay and RE: 98.0 ± 0.92% at pH 13.0 for nZVI (Fig. 16). The optimum MB removal activity of iron impregnated nanoclay shows a promising option for the application of iron impregnated nanoclay as an adsorbent for the removal of MB without pH adjustment of real textile wastewater. A similar effect of pH on the surfactant of the adsorbent was reported by Othman et al. (2018). The increased pH enriched the OH− in the solution and increased the negatively charged species on the surfactants of the adsorbent that directly promoted the removal of methylene blue.77 Tong et al. also proved increasing MB removal by adsorption with the rising pH of the solution. The removal of MB using a porous cellulose-derived carbon/montmorillonite nanocomposites and iron modified bentonite showed increasing adsorption efficiency with an increase in the pH of the solution.77,78 In general, increasing pH promotes the deposition of hydroxide ions on the surfactants and increases negative zeta potentials that helps to contribute to the uptake of cationic pollutants (i.e., methylene blue) from the test solution.
3.3.2 Effect of adsorbent dosage on MB adsorption. The amount of adsorbate to be removed from a solution depends on the availability of intrinsic pore spaces in the adsorbents applied. An adsorbent characterized by a higher pore space needs a lower adsorbent dosage to remove the adsorbate from solution. Also, a greater adsorbent dosage provides more adsorption pore spaces. The in-saturation sites of the adsorbent increase with increasing adsorbent dosage.79 As shown in Fig. 17, the optimum dosages of nZVI, nanoclay, and iron impregnated nanoclay to achieve the highest MB removal rate in this study were 140, 120, and 80 mg, respectively, and the maximum MB removal efficiencies achieved by the respective adsorbents were 89.6 ± 1.7, 92.4 ± 1.5 and 99.9 ± 0.03%. The MB adsorption rate for nZVI increased sharply from 10.6 ± 1.0 (20 mg nZVI dosage) to 80.80 ± 1.2 (100 mg nZVI dosage). Then, its efficiency increased gradually to 89.6 ± 1.7% at 140 mg nZVI dosage. Whereas the nanoclay efficiency of MB adsorption increased from 34.5 ± 1.3% (20 mg nanoclay dosage) to 92.40 ± 1.2% (120 mg nanoclay dosage). In addition, the MB removal efficiency of iron impregnated nanoclay showed a better adsorption capacity and a gradual increase in efficiency from 52.8% (20 mg clay-nZVI dosage) until it reached 99.2%. The removal efficiency remained constant after a dose of 80 mg clay-nZVI (Fig. 17).
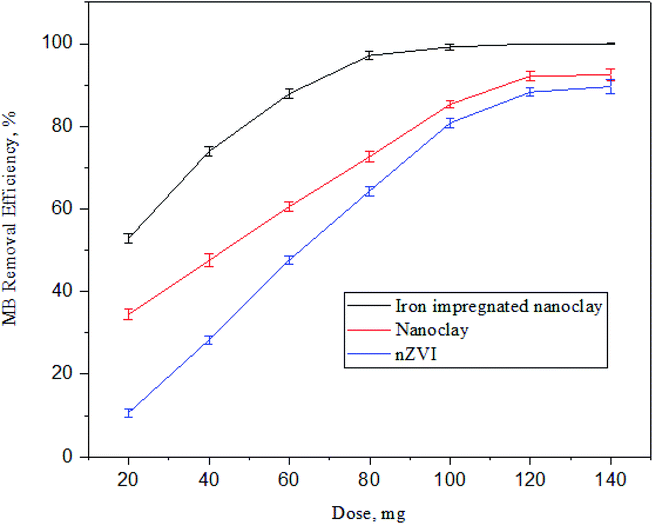 |
| | Fig. 17 Trends of methylene blue dye adsorption at a different adsorbent doses (n: 3, pH: 7.5, MB concentration: 60 ppm, temperature: 30 °C and contact time: 180 min). | |
Previous studies have shown similar results and the output of this study was consistent with them. The application of clay-supported nZVI for 0.5 g L−1 concentrated MB removal using a 1 g adsorbent dose achieved about ∼97%.80 As a result of the higher water absorption, higher surface area, and the smaller crystallites of the montmorillonite-type nanoclay used in this study, a higher removal efficiency was recorded. The addition of clay support materials on nZVI enhances the MB adsorption characteristics of nZVI. The integration of clay with nZVI has improved the MB adsorption efficiency compared to the separate applications of nZVI and clay adsorbents.81 The authors carried out an experiment at pH 5.9 to remove 100 mg L−1 MB using a dose of 0.4 g palygorskite-supported nZVI and obtained a dramatic MB removal trend (i.e. 94 mg L−1 to 20 mg L−1 during the first 5 minutes) with an effective dosage compared with individual adsorbents.81 Greater dosage effectiveness was observed in this study (100 mg clay-nZVI for 60 mg L−1 MB); this is the result of the higher surface area, more negative surfactants, higher water absorption capacity and smaller crystallites in montmorillonite-type clay facilitating the MB removal activities.
The outer surface of nZVI at lower pH (pH < pHpzc ∼ 8.0) is surrounded by hydronium ions and its surfactants change to positively charged and actively attract negatively charged species, such as sulfate, nitrate, and other anions from solution, indicating the only contribution of physisorption for cationic pollutant removal.82 In this study, the experiment was operated at pH 7.5; the only physisorption activity was considered to form MB removal from the solution and demanded greater nZVI dosage compared to the nanoclay and iron impregnated nanoclay. In general, the impregnation of iron into the nanoclay has improved the intrinsic character and surface structure of the nanoclay that indirectly improves the MB removal processes.
3.3.3 Effect of contact time on MB adsorption. The MB removal rate per unit time is denoted by dq/dt: the amount of methylene blue dye that was removed from the solution either by chemisorption or physisorption. The amount of removed or adsorbed MB increases with an increase in contact time until it reaches an equilibrium point.83,84 Initially, the dye concentration decreased quickly with an increase in the corresponding adsorption efficiency, showing strong interaction between the dye and adsorbents.85In this study (Fig. 18), MB dye removal efficiency increased with time in the case of all the adsorbents until it reached the equilibrium point. In the study, adsorbents showed different equilibrium points; a fast equilibrium point was achieved by the iron impregnated nano clay. However, the highest removal efficiency was achieved by the iron-impregnated nanoclay composite compared to nanoclay or nZVI adsorbents. And, its optimized contact time to remove the MB dye from the solution under fixed operational conditions (adsorbent dose: 60 mg, MB concentration: 60 ppm, temperature: 30 °C and pH: 7.5) was 120 min. The nanocomposite showed minimum and maximum MB removal efficiencies at 59.9 ± 1.8% and 99.9 ± 0.9%, respectively. While the nZVI adsorbents achieved relatively small removal efficiency at 5%, (20 min), it increased sharply to 96.3 ± 0.9% at 140 min. In addition, the maximum MB adsorption capacity of the nanoclay was about 97.6 ± 1.5% at 140 min; which was more efficient than nZVI (96.3 ± 0.9%) but showed a lower efficiency than iron impregnated nanoclay (99.9 ± 0.9%).
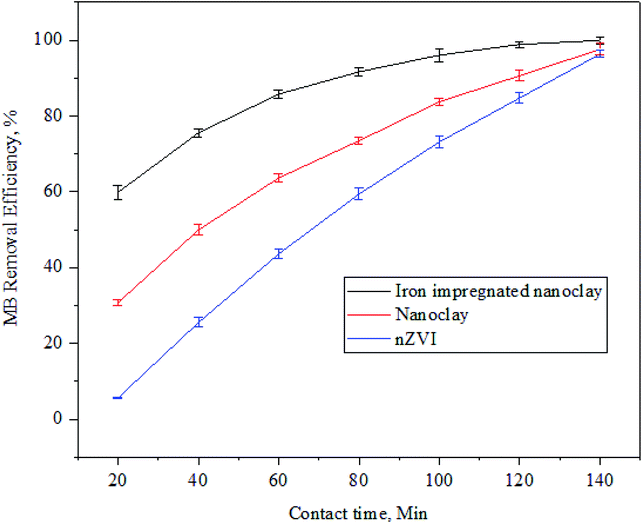 |
| | Fig. 18 Trends in methylene blue dye adsorption with contact time (n: 3, adsorbent dose: 60 mg, MB concentration: 60 ppm, temperature: 30 °C and pH: 7.5). | |
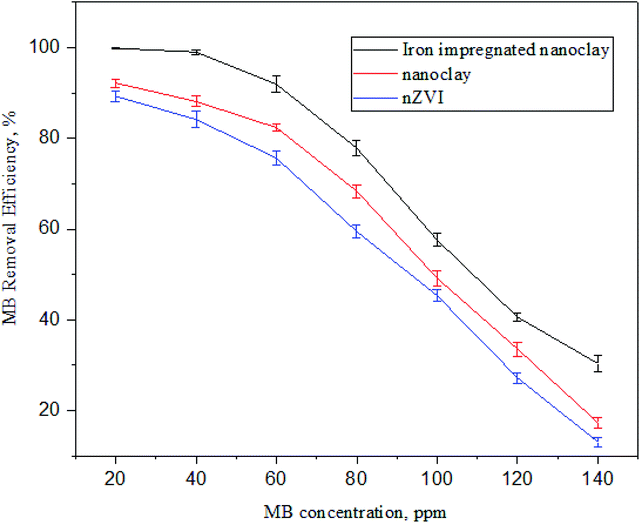
3.3.4 Effect of the initial concentration on MB adsorption. The effect of the initial concentration of MB dye on the adsorption activity of nZVI, nanoclay, and iron impregnated nanoclay is shown in Fig. 19. The dye removal efficiency of the adsorbents decreased with an increase in MB dye concentration. The iron-impregnated nanoclay adsorbent was less affected by increasing the initial concentration of adsorbate compared to nZVI or nanoclay. The MB dye removal efficiency of iron impregnated nanoclay decreased from 99.86 ± 0.00% to 77.80 ± 1.67% at initial concentrations of 20 ppm and 80 ppm, respectively. Whereas nZVI and nanoclay achieved maximum removal efficiencies of 82.19 ± 1.18% and 90.30 ± 1.17%, respectively, at a concentration of 20 ppm. The efficiency was reduced to 48.33 ± 1.15% (nZVI) and 59.47 ± 1.45% (nanoclay) when the initial concentration of MB increased to 80 ppm. The effect of initial adsorbate concentration on adsorption has been well studied and reported for other adsorbents; for instance, the effect of the concentration of MB dye on adsorption by kaolin,80 the effect of dye concentration on the adsorption efficiency of clay-based electrospun nano-fibrous membranes86 and the effect of initial concentration of MB on adsorption by Cuban natural clay (Martın et al., 2018) showed that concentration and adsorption efficiency are inversely related.
 |
| | Fig. 19 Trends in methylene blue dye adsorption at different concentrations (n: 3, adsorbent dose: 60 mg, pH: 7.5, temperature: 30 °C and contact time: 180 min). | |
3.4 Adsorption isotherms, kinetics and thermodynamics
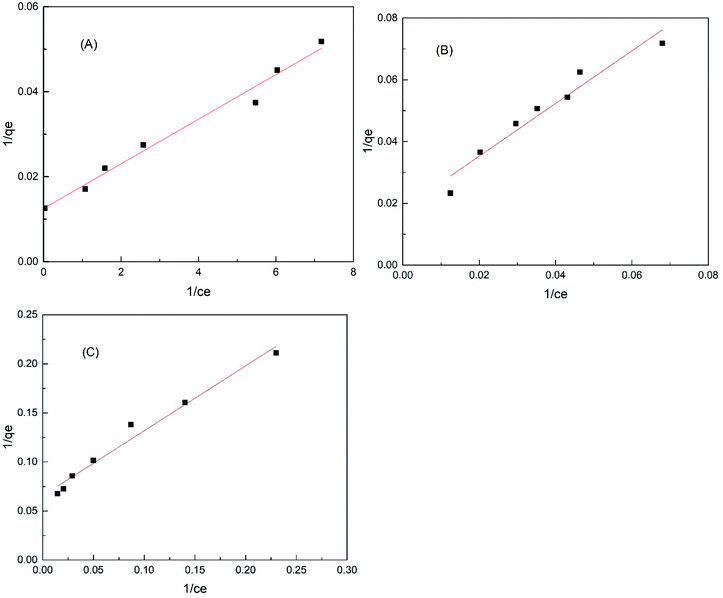
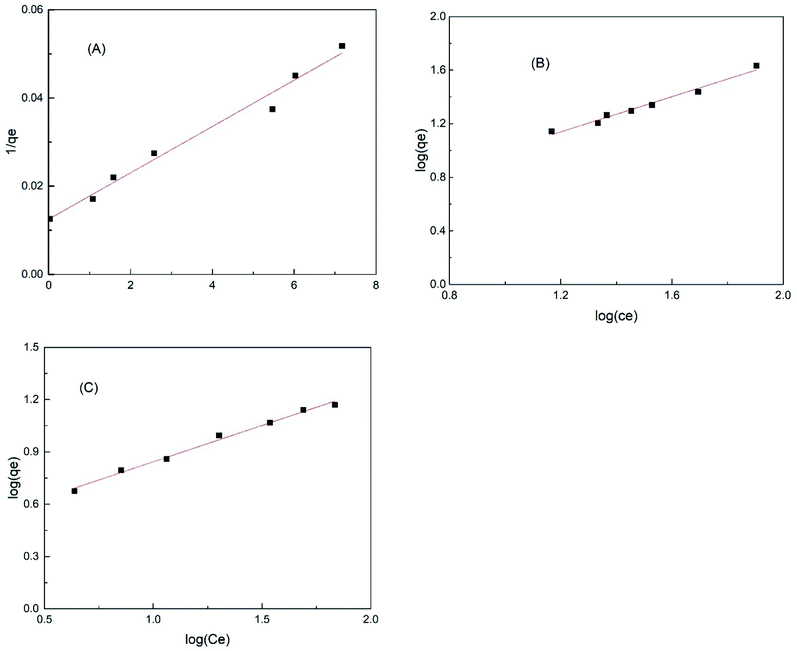
3.4.1 Adsorption isotherm. As shown in Fig. 20 and 21, the adsorption isotherm models were studied to investigate the adsorbent surface properties in detail. The detailed observed data of methylene blue dye adsorption using nZVI, nanoclay and iron impregnated nanoclay were fitted with the Langmuir (eqn (17)) and Freundlich isotherm models (eqn (18)).| |
 | (17) |
| |
 | (18) |
 |
| | Fig. 20 Langmuir adsorption isotherm of (A) iron impregnated nanoclay, (B) nanoclay and (C) nZVI. | |
 |
| | Fig. 21 Freundlich isotherm model of methylene blue adsorption using (A) iron impregnated nanoclay, (B) nanoclay and (C) nZVI adsorbents. | |
Fig. 20(A)–(C) show the Langmuir isotherms of methylene blue dye adsorption on iron impregnated nanoclay and nZVI, respectively. Whereas, Fig. 21(A)–(C) depict the Freundlich adsorption isotherms of iron impregnated nanoclay, nanoclay, and nZVI, respectively. As summarized in Table 3, the nZVI and nanoclay adsorbents showed a better fit to the Freundlich isotherm model with correlation coefficients (R2) ∼ 0.98 and 0.992, respectively. Whereas iron impregnated nanoclay showed characteristics more like a Langmuir adsorption isotherm (correlation coefficient, R2 ∼ 0.98) than a Freundlich isotherm (correlation coefficient, R2 ∼ 0.88). Monolayer adsorption trends have been observed in the case of iron impregnated nanoclay. The isotherm results coincide with those of a previous study on the Freundlich adsorption characteristics of basic dye adsorbed onto fly ash.87
Table 3 Characteristics of the Langmuir and Freundlich isotherms of methylene blue removal using nZVI, nanoclay, and iron impregnated nanoclay
| Isotherm |
Type of nanomaterial |
Intercept |
Slope |
Qmax |
KL |
Kf |
RL |
n |
R2 |
| Langmuir isotherm |
Iron impregnated nanoclay |
0.013 |
0.005 |
79.681 |
0.007 |
|
0.007 |
|
0.983 |
| Nanoclay |
0.018 |
0.852 |
54.855 |
0.021 |
|
0.438 |
|
0.946 |
| nZVI |
0.066 |
0.662 |
15.251 |
0.099 |
|
0.144 |
|
0.977 |
| Freundlich isotherm |
Iron impregnated nanoclay |
1.643 |
0.295 |
|
|
43.999 |
|
3.388 |
0.881 |
| Nanoclay |
0.351 |
0.657 |
|
|
2.242 |
|
1.522 |
0.978 |
| nZVI |
0.426 |
0.417 |
|
|
2.668 |
|
2.399 |
0.992 |
3.4.2 Kinetic activity. The kinetic activities of the nanomaterials on methylene blue adsorption were investigated by fitting the experimental result with pseudo-first-order (eqn (19)) and pseudo-second-order (eqn (20)) kinetic models.| |
ln(qe − qt) = ln![[thin space (1/6-em)]](https://www.rsc.org/images/entities/char_2009.gif) qe − K1t qe − K1t
| (19) |
| |
 | (20) |
where qt is the amount of methylene blue removed at time t per gram of adsorbent (mg g−1), qe is the adsorption capacity at equilibrium (mg g−1), K1 is the pseudo-first-order rate constant (min−1), t is the contact time (min) and K2 is the rate constant of pseudo-second-order kinetics (g mg−1 min−1). As summarized in Table 4, the values of the correlation coefficients for nZVI (R2 ∼ 0.983), nano clay (R2 ∼ 9973), and iron impregnated nanoclay (R2 ∼ 0.9993) were close to one. The calculated qe values of all the nanomaterials matched well with the experimental data values of pseudo-second-order kinetics, showing that adsorption of methylene blue on nZVI, nanoclay, and iron impregnated nanoclay followed pseudo-second-order rate expressions. A study reported by Feddal et al. (2014) showed the pseudo-second-order kinetics behaviour of methylene blue dye adsorption onto montmorillonite clay.88 in addition, other studies have reported the pseudo-second-order kinetics behaviour of methylene blue dye adsorbed onto natural clay material and plagioclase feldspar.89,90
Table 4 Comparison of the pseudo-first-order and pseudo-second-order adsorption constants at 60 mg L−1 methylene blue dye concentration
| Parameter |
Iron impregnated nanoclay |
Nanoclay |
nZVI |
| Pseudo first order |
| K1 (min−1) |
1.90 × 10⁻⁴ |
−0.0026 |
7.46 × 10⁻⁵ |
| qe (cal, mg g−1) |
91.584 |
70.802 |
791.33 |
| R2 |
0.998 |
0.858 |
0.9714 |
![[thin space (1/6-em)]](https://www.rsc.org/images/entities/char_2009.gif) |
| Pseudo second order |
| K2 (g mg−1 min−1) |
0.018 |
0.067 |
−0.00016 |
| qe (cal, mg g−1) |
57.306 |
14.934 |
−6244.10 |
| R2 |
0.999 |
0.997 |
0.9830 |
3.4.3 Thermodynamics parameters of methylene blue adsorption. Thermodynamic parameters, such as Gibbs free energy (ΔG°), heat of enthalpy (ΔH°) and entropy (ΔS°) of the methylene blue removal, were evaluated for each adsorbent based on eqn (21)–(24).| |
 | (21) |
| |
ΔG° = −RT![[thin space (1/6-em)]](https://www.rsc.org/images/entities/char_2009.gif) ln ln![[thin space (1/6-em)]](https://www.rsc.org/images/entities/char_2009.gif) Ke Ke
| (22) |
| |
 | (24) |
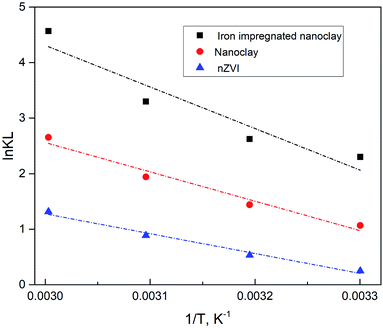
where qe (mg g−1) is the amount of methylene blue adsorbed on the nanomaterial at equilibrium, Ce (mg L−1) is the equilibrium concentration of methylene blue in the solution, R (J mol−1 K−1) is the universal gas constant (8.314), T (K) is the absolute temperature, and Ke is the adsorption equilibrium constant. ΔG° is the Gibbs free energy, ΔS° is entropy and ΔH° is the enthalpy of the system. As shown in Fig. 22 (plot of ln![[thin space (1/6-em)]](https://www.rsc.org/images/entities/char_2009.gif) Ke vs. 1/T), the values of ΔH° and ΔS° were determined from the slopes and intercepts, respectively. ΔG° was also determined from the corresponding ΔH° and ΔS°.
Ke vs. 1/T), the values of ΔH° and ΔS° were determined from the slopes and intercepts, respectively. ΔG° was also determined from the corresponding ΔH° and ΔS°.
 |
| | Fig. 22 Thermodynamic characteristics of methylene blue sorption activity of nZVI, nanoclay and iron impregnated nanoclay. | |
Accordingly, a positive ΔH° value in all adsorbent activity indicates an endothermic sorption reaction, supported by an increase in qe with rising temperature. Also, the negative ΔG° value suggests a spontaneous sorption process with increasing metal sorption at higher temperature. This finding was further supported by previous studies. In addition, the positive value of ΔS° in all nanosorbent activity showed the affinity of the nanosorbents for methylene blue removal. It also provided information on the high level of disorder and spontaneity of the methylene blue adsorption activity.91
In addition, the negative value of its Gibbs free energy, ΔG° (−0.63 to −12.64 kJ mol−1), indicates the dominance of physisorption in all methylene blue dye sorption processes. As a similar report explained, a negative Gibbs free energy less than −20 kJ mol−1 shows physisorption activity.92 In general, a Gibbs free energy between −20 and 0 kJ mol−1 is preferred93 and a similar case was found in this study (Table 5 and Fig. 22).
Table 5 Thermodynamic parameters of methylene blue sorption activity of nZVI, nanoclay and iron impregnated nanoclay
| Adsorbent |
Temperature, K |
KL |
ΔG°, kJ mol−1 |
ΔH°, kJ mol−1 |
ΔS°, kJ mol−1 |
R2 |
| nZVI |
303 |
1.28 |
−0.63 |
29.69 |
0.10 |
0.99 |
| 313 |
1.71 |
−1.39 |
| 323 |
2.43 |
−2.38 |
| 333 |
3.73 |
−3.64 |
| Nanoclay |
303 |
2.91 |
−2.69 |
43.86 |
0.15 |
0.97 |
| 313 |
4.22 |
−3.75 |
| 323 |
6.97 |
−5.21 |
| 333 |
14.21 |
−7.34 |
| Iron impregnated nanoclay |
303 |
9.99 |
−5.79 |
62.15 |
0.22 |
0.91 |
| 313 |
13.77 |
−6.82 |
| 323 |
27.07 |
−8.85 |
| 333 |
96.37 |
−12.64 |
4. Conclusions
The intrinsic characteristics and methylene blue (MB) adsorption capacities of nZVI, nanoclay, and iron impregnated nanoclay were tested. All adsorbents showed attributes of crystallinity with different functional groups. Multiple MB removal mechanisms, such as chemical reduction, chromophore bond cleavage (degradation), complexation supported by precipitation and physisorption, took place; however, it was dominated by a physisorption process. All the sorption processes took place with a small amount of Gibbs free energy and indicated the domination of physisorption processes. The chemisorption process was confirmed by peak disappearance and dislocation as well as the formation of new peaks on the spectral band of the XRD and FTIR spectra. All the nanomaterials produced were crystalline and the spherical and plate-like/sheet structural shapes were investigated for nZVI and nanoclay, respectively. The average surface area, pore volume and pore diameter of the nanoclay were about 43.49 m2 g−1, 0.104 cm3 g−1 and 2.806 nm, respectively. nZVI was characterized by an average surface area of 47.125 m2 g−1, pore volume of 0.119 cm3 g−1, and pore diameter of 3.291 nm. Whereas iron impregnated nanoclay showed an average surface area of 73.110 m2 g−1, pore volume of 15 cm3 g−1 and pore diameter of 3.83 nm. All the nanomaterials were characterized by the Langmuir EXT nitrogen gas adsorption isotherm (R2 ∼ 0.99). In addition, nZVI and nanoclay showed the methylene blue adsorption isotherm was best fitted by the Freundlich isotherm model with correlation coefficients (R2) ∼ 0.98 and 0.992, respectively. Whereas iron impregnated nanoclay was fitted with the Langmuir adsorption isotherm (correlation coefficient, R2 ∼ 0.98). All the nano adsorbent materials showed good zeta potentials with good dispersibility in solution. The optimal methylene blue removal efficiency of iron impregnated nanoclay was achieved at pH 7.0, initial MB concentration 40 ppm, dosage 80 mg, and contact time 120 min. Whereas the highest MB removal efficiency of nZVI was achieved at pH 13.0, initial MB concentration 20 ppm, dosage 140 mg, and contact time 140 min. On the other hand, the optimal MB removal efficiency of the nanoclay was achieved at pH 11.0, initial MB concentration 20 ppm, dosage 120 mg, and contact time 140 min. nZVI and nanoclay showed Freundlich isotherm fit of methylene blue removal with R2 ∼ 0.98 and 0.99, respectively. Whereas iron impregnated nanoclay showed a Langmuir methylene adsorption isotherm. On the other hand, pseudo-second-order kinetics was observed for all nanomaterials with correlation coefficients, nZVI: R2 ∼ 0.983, nanoclay: R2 ∼ 9973, and iron impregnated nanoclay: R2 ∼ 0.9993. The Gibbs free energy is negative for nZVI (−0.63 to −3.04 kJ mol−1), nanoclay (−2.64 to −7.34 kJ mol−1) and iron impregnated nanoclay (−5.79 to −12.64). nZVI, nanoclay and iron impregnated nanoclay showed enthalpy changes of 43.86, 10 and 62.15, respectively. The negative Gibbs free energy shows the spontaneous nature of the adsorption and the size of the Gibbs free energy indicated the major contribution of the physisorption process for methylene blue removal. A positive enthalpy resulted in all sorbent cases, which confirms the endothermic nature of the adsorption. The positive entropy observed in the adsorption process (+0.10 to +0.22 kJ mol−1) showed the materials had the highest level of adsorbent disorder suitable for cationic pollutant adsorption. In general, an increase in MB removal efficiency was observed with an increase in pH, adsorbent dose, and contact time. The iron impregnated nanoclay showed a comparatively better and promising result for future applications. However, its MB adsorption capacity needs to be tested at a pilot scale on actual textile wastewater. In addition, the reusability of the synthesized nanomaterials should be tested by conducting further experimental studies in the future.
Abbreviations
| nZVI | Nano zero valent iron |
| MB | Methylene blue |
| RE | Removal efficiency |
| TDS | Total dissolved solids |
| COD | Chemical oxygen demands |
| BOD | Biochemical oxygen demands |
| FTIR | Fourier transform infra-red |
| XRD | X-ray diffraction |
| XRF | X-ray fluorescence |
| BET | Brunauer–Emmett–Teller |
Author contributions
Mekonnen Maschal Tarekegn and Raj Mohan Balakrishnan authors who have contributed to the laboratory activities, data quality assurance, and manuscript preparation. Andualem Mekonnen Hiruy and Ahmed Hussien Dekebo authors who have contributed to the review of the laboratory protocols, findings, and the manuscript including corrections.
Conflicts of interest
There are no conflicts to declare.
Acknowledgements
We have humbly appreciated the DCS-RTF program, Department of Science and Technology/Federation of the Indian Chamber of Commerce (FICCI) for funding this research. In addition, we would like to acknowledge the Addis Ababa University Centre for Environmental Sciences and National Institute of Technology Karnataka, Surathkal, Mangalore/India for facilitating all the required laboratory facilities.
References
- J. Rockstrom, W. Steffen, K. Noone, A. Persson, F. S. Chapin, E. Lambin, T. M. Lenton, M. Scheffer, C. Folke, H. Schellnhuber, B. Nykvist, C. A. De Wit, L. T. Hughes, S. van der Leeuw, H. Rodhe, S. Sorlin, P. K. Snyder, R. Costanza, U. Svedin, M. Falkenmark, J. F. Karlberg, R. W. Corell, V. J. Fabry, J. Hansen, B. Walker, D. Liverman, K. Richardson and P. Crutzen, Ecol. Soc., 2009, 14(2), 32 CrossRef , http://pdxscholar.library.pdx.edu/iss_pub..
- N. M. Sivaram, P. M. Gopal and D. Barik, Energy from Toxic Org. Waste Heat Power Gener., 2018, pp. 43–54 Search PubMed.
- R. Shishoo, Introduction: trends in the global textile industry, Woodhead Publishing Limited, 2012 Search PubMed.
- KEMI, Chemicals in textiles - Risks to human health and the environment, Report from a government assignment, Swedish Chem. Agency Rep., 2014, pp. 1–142 Search PubMed.
- S. Vajnhandl and J. V. Valh, J. Environ. Manage., 2014, 141, 29–35 CrossRef PubMed.
- Z. Wang, M. Xue, K. Huang and Z. Liu, Adv. Treat. Text. Effl., 2011, pp. 91–116 Search PubMed.
- K. K. Gangwar, Multidisciplinary Academic Journals, 2010, 2, 34–35 Search PubMed.
- H. Patel and R. T. Vashi, Feasibility of Naturally Prepared Adsorbent, 2015 Search PubMed.
- D. A. Yaseen and M. Scholz, Textile dye wastewater characteristics and constituents of synthetic effluents: a critical review, Springer, Berlin Heidelberg, 2019, vol. 16 Search PubMed.
- R. B. Chavan, Indian J. Fibre Text. Res., 2001, 26, 11–21 CAS.
- Z. Rahman and V. P. Singh, Environ. Monit. Assess., 2019, 191(7) DOI:10.1007/s10661-019-7528-7.
- Z. Singh and P. Chadha, J. Occup. Med. Toxicol., 2016, 11, 1–6 CrossRef PubMed.
- S. Wijetunga, X. F. Li and C. Jian, J. Hazard. Mater., 2010, 177, 792–798 CrossRef CAS PubMed.
- I. M. Banat, P. Nigam, D. Singh and R. Marchant, Bioresour. Technol., 1996, 58, 217–227 CrossRef CAS.
- C. R. Holkar, A. J. Jadhav, D. V. Pinjari, N. M. Mahamuni and A. B. Pandit, J. Environ. Manage., 2016, 182, 351–366 CrossRef CAS PubMed.
- X. R. Ferreres, A. R. Font, A. Ibrahim, N. Maximilien, D. Lumbroso, A. Hurford, J. Winpenny, S. Wade, R. T. Sataloff, M. M. Johns, K. M. Kost, T. Motivation, N. Ya'acob, M. Abdullah, M. Ismail, M. Medina, T. L. Talarico, I. A. Casas, T. C. Chung, W. J. Dobrogosz, L. Axelsson, S. E. Lindgren, W. J. Dobrogosz, L. Kerkeni, P. Ruano, L. L. Delgado, S. Picco, L. Villegas, F. Tonelli, M. Merlo, J. Rigau, D. Diaz and M. Masuelli, Canyon Hydro, E. Summary, F. Of, T. H. E. Potential State-of-the-art, Intech, 2013, 32, pp. 137–144 Search PubMed.
- A. Ahmad, S. H. Mohd-Setapar, C. S. Chuong, A. Khatoon, W. A. Wani, R. Kumar and M. Rafatullah, RSC Adv., 2015, 5, 30801–30818 RSC.
- N. A. Oladoja, I. O. Raji, S. E. Olaseni and T. D. Onimisi, Chem. Eng. J., 2011, 171, 941–950 CrossRef CAS.
- B. Shi, G. Li, D. Wang, C. Feng and H. Tang, J. Hazard. Mater., 2007, 143, 567–574 CrossRef CAS PubMed.
- P. Pandit and S. Basu, Ind. Eng. Chem. Res., 2004, 43, 7861–7864 CrossRef CAS.
- N. Hu, K. Zhang, Y. Zhao, Z. Zhang and H. Li, J. Cleaner Prod., 2020, 269, 122121 CrossRef CAS.
- S. Palanisamy, P. Nachimuthu, M. K. Awasthi, B. Ravindran, S. W. Chang, M. Palanichamy and D. D. Nguyen, J. Water Supply: Res. Technol.--AQUA, 2020, 69, 345–354 CrossRef.
- Z. Yang, T. A. Asoh and H. Uyama, Bull. Chem. Soc. Jpn., 2019, 92, 1453–1461 CrossRef CAS.
- C. Thamaraiselvan and M. Noel, Crit. Rev. Environ. Sci. Technol., 2015, 45, 1007–1040 CrossRef CAS.
- N. Uzal, L. Yilmaz and U. Yetis, Sep. Sci. Technol., 2010, 45, 331–338 CrossRef CAS.
- K. Shahzad, T. Najam, M. Sohail, M. Altaf, M. Aswad, S. Shoaib and A. Shah, Inorg. Chem. Commun., 2021, 123, 108357 CrossRef CAS.
- M. Altaf, N. Ahmad, C. Cheng, S. Shoaib and A. Shah, Appl. Clay Sci., 2020, 190, 105564 CrossRef.
- N. A. Khan, S. Shaheen, T. Najam, S. Shoaib, A. Shah, M. S. Javed, M. A. Nazir, A. Shaheen, S. Hussain and M. Ashfaq, Toxin Rev., 2020, 1–13 CAS.
- M. M. Tarekegn, A. M. Hiruy and A. H. Dekebo, RSC Adv., 2021, 11, 18539–18551 RSC.
- Y. Ding, Y. Liu, S. Liu, Z. Li, X. Tan, X. Huang, G. Zeng, Y. Zhou and X. Cai, RSC Adv., 2016, 6, 5223–5232 RSC.
- D. M. Ruthven, Adsorption Kinetics: Theory, Applications and Recent Progress, 2007, pp. 3–28, DOI:10.1142/9789812770264_0001.
- Y. Zhao, Q. Zhang, W. Yuan, H. Hu, Z. Li, Z. Ai and Y. Li, Appl. Clay Sci., 2019, 180, 105187 CrossRef CAS.
- F. Petronella, A. Truppi, C. Ingrosso, T. Placido, M. Striccoli, M. L. Curri, A. Agostiano and R. Comparelli, Catal. Today, 2017, 281, 85–100 CrossRef CAS.
- S. Sedaghat, J. Nanostruct. Chem., 2013, 3, 24 CrossRef.
- M. Anjum, R. Miandad, M. Waqas, F. Gehany and M. A. Barakat, Arabian J. Chem., 2016 DOI:10.1016/j.arabjc.2016.10.004.
- I. Kara, D. Tunc, F. Sayin and S. T. Akar, Appl. Clay Sci., 2018, 161, 184–193 CrossRef CAS.
- H. Zhu, X. Xiao, Z. Guo, X. Han, Y. Liang, Y. Zhang and C. Zhou, Appl. Clay Sci., 2018, 161, 310–316 CrossRef CAS.
- M. B. Aregu, S. L. Asfaw and M. M. Khan, Environ. Syst. Res., 2018, 7(1) DOI:10.1186/s40068-018-0112-2.
- X. Liu, P. Hicher, B. Muresan, N. Saiyouri and P. Y. Hicher, Appl. Clay Sci., 2016, 119, 365–374 CrossRef CAS.
- N. Wang, F. Xiao, J. Zhang, H. Zhou, Y. Qin and D. Pan, Appl. Clay Sci., 2019, 174, 146–151 CrossRef CAS.
- C. Cerrillo, G. Barandika, A. Igartua, O. Areitioaurtena and G. Mendoza, J. Environ. Sci. Health, Part C: Environ. Carcinog. Ecotoxicol. Rev., 2017, 35, 104–126 CrossRef PubMed.
- F. Uddin, Montmorillonite: An introduction to properties and utilization, Current Topics in the Utilization of Clay in Industrial and Medical Applications, IntechOpen, London, 2018, ch. 1, pp. 3–23 Search PubMed.
- Z. Li, P. H. Chang, W. T. Jiang, J. S. Jean and H. Hong, Chem. Eng. J., 2011, 168, 1193–1200 CrossRef CAS.
- O. Abollino, A. Giacomino, M. Malandrino and E. Mentasti, Appl. Clay Sci., 2008, 38, 227–236 CrossRef CAS.
- O. B. Ayodele, J. K. Lim and B. H. Hameed, Appl. Catal., A, 2012, 413–414, 301–309 CrossRef CAS.
- D. Karabelli, S. Ünal, T. Shahwan and A. E. Eroĝlu, Chem. Eng. J., 2011, 168, 979–984 CrossRef CAS.
- M. Kaszuba, J. Corbett, F. M. N. Watson and A. Jones, Philos. Trans. R. Soc., A, 2010, 368, 4439–4451 CrossRef CAS PubMed.
- S. Samimi, N. Maghsoudnia, R. B. Eftekhari and F. Dorkoosh, Lipid-Based Nanoparticles for Drug Delivery Systems, Elsevier Inc., 2018 Search PubMed.
- B. A. Fil, C. Özmetin and M. Korkmaz, Bulg. Chem. Commun., 2014, 46, 258–263 CAS.
- M. Chorom and P. Rengasamy, Eur. J. Soil Sci., 1995, 46, 657–665 CrossRef CAS.
- A. Galarneau, F. Villemot, J. Rodriguez, F. Fajula and B. Coasne, Langmuir, 2014, 30, 13266–13274 CrossRef CAS PubMed.
- S. P. Rigby, P. I. Chigada, E. L. Perkins, M. J. Watt-Smith, J. P. Lowe and K. J. Edler, Adsorption, 2008, 14, 289–307 CrossRef CAS.
- T. A. Engidasew and A. Abay, Momona Ethiop. J. Sci., 2016, 8, 193 CrossRef.
- J. M. M. Tengco, Y. K. Lugo-José, J. R. Monnier and J. R. Regalbuto, Catal. Today, 2015, 246, 9–14 CrossRef CAS.
- A. Liu, J. Liu, J. Han and W. X. Zhang, J. Hazard. Mater., 2017, 322, 129–135 CrossRef CAS PubMed.
- Y. P. Sun, X. Qin Li, J. Cao, W. Xian Zhang and H. P. Wang, Adv. Colloid Interface Sci., 2006, 120, 47–56 CrossRef CAS PubMed.
- L. Bailey, H. N. W. Lekkerkerker and G. C. Maitland, Soft Matter, 2015, 11, 222–236 RSC.
- S. Satapathy, A. Ahlawat, A. Paliwal, R. Singh and M. K. Singh, Opt. Mater. Express, 2014, 2723–2731 CAS.
- J. Coates, Encycl. Anal. Chem., 2006, vol. 1–23 Search PubMed.
- Y. S. Li, J. S. Church and A. L. Woodhead, J. Magn. Magn. Mater., 2012, 324, 1543–1550 CrossRef CAS.
- J. T. Nurmi, P. G. Tratnyek, V. Sarathy, D. R. Baer, J. E. Amonette, C. Wang, J. C. Linehan, D. W. Matson, R. L. Penn, M. D. Driessen, K. Pecher, C. Wang, J. C. Linehan, D. W. Matson, R. L. Penn, M. D. Driessen, N. Spectroscopy, J. T. Nurmi, P. G. Tratnyek, V. Sarathy, D. R. Baer, J. E. Amonette, C. Wang, J. C. Linehan, D. W. Matson, R. L. Penn, M. D. Driessen, K. Pecher, C. Wang, J. C. Linehan, D. W. Matson, R. L. Penn, M. D. Driessen, N. Spectroscopy, J. T. Nurmi, P. G. Tratnyek, V. Sarathy, D. R. Baer, J. E. Amonette, C. Wang, J. C. Linehan, D. W. Matson, R. L. Penn and M. D. Driessen, Environ. Sci. Technol., 2005, 39, 1221–1230 CrossRef CAS PubMed.
- C. S. Ezquerro, G. I. Ric, C. C. Miñana and J. S. Bermejo, Appl. Clay Sci., 2015, 111, 1–9 CrossRef CAS.
- P. Hudec, A. Smiešková and V. Jorík, Stud. Surf. Sci. Catal., 2008, 174, 981–984 CrossRef.
- K. Dillen, J. Vandervoort, G. Van Den Mooter, L. Verheyden and A. Ludwig, Int. J. Pharm., 2004, 275, 171–187 CrossRef CAS PubMed.
- Y. Bagbi, A. Sarswat, S. Tiwari, D. Mohan, A. Pandey and P. R. Solanki, Adv. Mater. Process., 2017, 2, 235–241 CrossRef.
- E. Joseph and G. Singhvi, Multifunctional nanocrystals for cancer therapy: A potential nanocarrier, Elsevier Inc., 2019 Search PubMed.
- Y. Ji, Colloids Surf., A, 2014, 444, 1–8 CrossRef CAS.
- S. A. Hussain, Ş. Demirci and G. Özbayoǧlu, J. Colloid Interface Sci., 1996, 184, 535–541 CrossRef CAS PubMed.
- A. Delgado, F. González-Caballero and J. M. Bruque, J. Colloid Interface Sci., 1986, 113, 203–211 CrossRef CAS.
- N. Wang, F. Xiao, J. Zhang, H. Zhou, Y. Qin and D. Pan, Appl. Clay Sci., 2019, 174, 146–151 CrossRef CAS.
- X. Sun, T. Kurokawa, M. Suzuki, M. Takagi and Y. Kawase, J. Environ. Sci. Health, Part A: Toxic/Hazard. Subst. Environ. Eng., 2015, 50, 1057–1071 CrossRef CAS PubMed.
- X. Teng, J. Li, Z. Wang, Z. Wei, C. Chen, K. Du, C. Zhao, G. Yang and Y. Li, RSC Adv., 2020, 10, 24712–24720 RSC.
- R. A. Crane and T. B. Scott, J. Hazard. Mater., 2012, 211–212, 112–125 CrossRef CAS PubMed.
- C. Noubactep, Environ. Prog. Sustainable Energy, 2010, 29, 286–291 CrossRef CAS.
- W. Hao, S. L. Flynn, D. S. Alessi and K. O. Konhauser, Chem. Geol., 2018, 493, 458–467 CrossRef CAS.
- J. De Vicente, A. V. Delgado, R. C. Plaza, J. D. G. Durán and F. González-Caballero, Langmuir, 2000, 16, 7954–7961 CrossRef CAS.
- N. H. Othman, N. H. Alias, M. Z. Shahruddin, N. F. Abu Bakar, N. R. Nik Him and W. J. Lau, J. Environ. Chem. Eng., 2018, 6, 2803–2811 CrossRef CAS.
- D. S. Tong, C. W. Wu, M. O. Adebajo, G. C. Jin, W. H. Yu, S. F. Ji and C. H. Zhou, Appl. Clay Sci., 2018, 161, 256–264 CrossRef CAS.
- Y. H. Bermúdez, L. Truffault, S. H. Pulcinelli and C. V. Santilli, Appl. Clay Sci., 2018, 152, 158–165 CrossRef.
- L. Mouni, L. Belkhiri, J. Bollinger, A. Bouzaza and A. Assadi, Appl. Clay Sci., 2018, 153, 38–45 CrossRef CAS.
- N. Ezzatahmadi, G. A. Ayoko, G. J. Millar, R. Speight, C. Yan, J. Li, S. Li, J. Zhu and Y. Xi, Chem. Eng. J., 2017, 312, 336–350 CrossRef CAS.
- X. Q. Li, D. W. Elliott and W. X. Zhang, Crit. Rev. Solid State Mater. Sci., 2006, 31, 111–122 CrossRef CAS.
- K. Abbas, H. Znad and M. R. Awual, Chem. Eng. J., 2018, 334, 432–443 CrossRef CAS.
- N. Samadi, R. Hasanzadeh and M. Rasad, J. Appl. Polym. Sci., 2015, 132, 1–13 Search PubMed.
- Y. Zhu, D. Wang, X. Zhang and H. Qin, Fresenius Environ. Bull., 2009, 18, 369–376 CAS.
- S. A. Hosseini, M. Vossoughi, N. M. Mahmoodi and M. Sadrzadeh, Appl. Clay Sci., 2019, 168, 77–86 CrossRef CAS.
- J. X. Lin, S. L. Zhan, M. H. Fang, X. Q. Qian and H. Yang, J. Environ. Manage., 2008, 87, 193–200 CrossRef CAS PubMed.
- I. Feddal, A. Ramdani, S. Taleb, E. M. Gaigneaux, N. Batis and N. Ghaffour, Desalin. Water Treat., 2014, 52, 2654–2661 CrossRef CAS.
- A. Gürses, Ç. Doǧar, M. Yalçin, M. Açikyildiz, R. Bayrak and S. Karaca, J. Hazard. Mater., 2006, 131, 217–228 CrossRef PubMed.
- A. Al-Futaisi, A. Jamrah and R. Al-Hanai, Desalination, 2007, 214, 327–342 CrossRef CAS.
- Z. Meng, M. Wu, Y. Yu, F. Meng, A. Liu, S. Komarneni and Q. Zhang, Appl. Clay Sci., 2018, 161, 1–5 CrossRef CAS.
- M. N. Sahmoune, Environ. Chem. Lett., 2019, 17, 697–704 CrossRef CAS.
- P. D. Húmpola, H. S. Odetti, A. E. Fertitta and J. L. Vicente, J. Chil. Chem. Soc., 2013, 58, 1541–1544 CrossRef.
|
| This journal is © The Royal Society of Chemistry 2021 |
Click here to see how this site uses Cookies. View our privacy policy here.  Open Access Article
 *a,
Raj Mohan Balakrishnanb,
Andualem Mekonnen Hiruya and
Ahmed Hussen Dekeboa
![[thin space (1/6-em)]](https://www.rsc.org/images/entities/char_2009.gif) :
:![[thin space (1/6-em)]](https://www.rsc.org/images/entities/char_2009.gif) 1 (v/v) ethanol/water mixture (24 mL ethanol, 6 mL deionized water) under continuous stirring. A 0.1 M sodium borohydride solution (0.3783 g NaBH4 in 100 mL of deionized water) was prepared and poured into a burette. The borohydride solution from the burette was added drop-wise into iron chloride solution in the flask and nZVI was formed (eqn (1)). Then, it was left for 10 minutes under vigorous stirring. The nanoparticles from the supernatant solution were filtered using two Whatman filter papers (Whatman 42, 125 mm Ø) and simultaneously washed three times with 25 mL of absolute ethanol to remove all the water. The retentate thus obtained was dried at 323 K overnight in an oven and stored in a moisture-free place.
1 (v/v) ethanol/water mixture (24 mL ethanol, 6 mL deionized water) under continuous stirring. A 0.1 M sodium borohydride solution (0.3783 g NaBH4 in 100 mL of deionized water) was prepared and poured into a burette. The borohydride solution from the burette was added drop-wise into iron chloride solution in the flask and nZVI was formed (eqn (1)). Then, it was left for 10 minutes under vigorous stirring. The nanoparticles from the supernatant solution were filtered using two Whatman filter papers (Whatman 42, 125 mm Ø) and simultaneously washed three times with 25 mL of absolute ethanol to remove all the water. The retentate thus obtained was dried at 323 K overnight in an oven and stored in a moisture-free place.![[thin space (1/6-em)]](https://www.rsc.org/images/entities/char_2009.gif) :
:![[thin space (1/6-em)]](https://www.rsc.org/images/entities/char_2009.gif) 1 (v/v) ethanol/water mixture (24.0 mL ethanol, 6.0 mL deionized water) and 1.50 g of the nanoclay was added to this solution. The mixture was left in an ultrasonic shaker for 30 min followed by centrifugation at 6000 rpm to separate the precipitated solids and then transferred to a 250 mL conical flask. Meanwhile, sodium borohydride solution was prepared by dissolving 0.61 g in 100 mL of deionized water and was added drop-wise to the aqueous nanoclay/Fe2+ dispersion under continuous stirring until the solution changed to a black precipitate. Once the NaBH4 solution had been consumed completely, the dispersion was stirred for an additional 30 min. Finally, the Fe0 nanoparticles and Fe-nanoclay particles were separated with a centrifuge and dried overnight at 50 °C.
1 (v/v) ethanol/water mixture (24.0 mL ethanol, 6.0 mL deionized water) and 1.50 g of the nanoclay was added to this solution. The mixture was left in an ultrasonic shaker for 30 min followed by centrifugation at 6000 rpm to separate the precipitated solids and then transferred to a 250 mL conical flask. Meanwhile, sodium borohydride solution was prepared by dissolving 0.61 g in 100 mL of deionized water and was added drop-wise to the aqueous nanoclay/Fe2+ dispersion under continuous stirring until the solution changed to a black precipitate. Once the NaBH4 solution had been consumed completely, the dispersion was stirred for an additional 30 min. Finally, the Fe0 nanoparticles and Fe-nanoclay particles were separated with a centrifuge and dried overnight at 50 °C.


![[thin space (1/6-em)]](https://www.rsc.org/images/entities/char_2009.gif) :
:![[thin space (1/6-em)]](https://www.rsc.org/images/entities/char_2009.gif) 1 ratio of SiO2 to Al2O3 in the nanoclay materials confirmed the predominant composition of montmorillonite minerals.42
1 ratio of SiO2 to Al2O3 in the nanoclay materials confirmed the predominant composition of montmorillonite minerals.42


![[thin space (1/6-em)]](https://www.rsc.org/images/entities/char_2009.gif) :
:![[thin space (1/6-em)]](https://www.rsc.org/images/entities/char_2009.gif) 1 layered natural clay.75 The clay in this study was dominated by montmorillonite minerals which has resulted in a lowered ZPC for the nanoclay and iron impregnated nanoclay.
1 layered natural clay.75 The clay in this study was dominated by montmorillonite minerals which has resulted in a lowered ZPC for the nanoclay and iron impregnated nanoclay.


![[thin space (1/6-em)]](https://www.rsc.org/images/entities/char_2009.gif) qe − K1t
qe − K1t

![[thin space (1/6-em)]](https://www.rsc.org/images/entities/char_2009.gif)

![[thin space (1/6-em)]](https://www.rsc.org/images/entities/char_2009.gif) ln
ln![[thin space (1/6-em)]](https://www.rsc.org/images/entities/char_2009.gif) Ke
Ke

![[thin space (1/6-em)]](https://www.rsc.org/images/entities/char_2009.gif) Ke vs. 1/T), the values of ΔH° and ΔS° were determined from the slopes and intercepts, respectively. ΔG° was also determined from the corresponding ΔH° and ΔS°.
Ke vs. 1/T), the values of ΔH° and ΔS° were determined from the slopes and intercepts, respectively. ΔG° was also determined from the corresponding ΔH° and ΔS°.


