 Open Access Article
Electrospinning preparation and anti-infrared radiation performance of silica/titanium dioxide composite nanofiber membrane
Yilong Song a,
Fang Zhao*a,
Zhizun Lia,
Zhaogang Chenga,
Hongjun Huanga and
Mifen Yangb
aDepartment of Vehicle and Electrical Engineering, Shijiazhuang Campus, Army Engineering University, Shijiazhuang 050003, China. E-mail: zhaofang19821106@163.com
bBasic Department, Shijiazhuang Campus, Army Engineering University, Shijiazhuang 050003, China
First published on 6th July 2021
Abstract
Silica/titanium dioxide (SiO2/TiO2) composite nanofiber membranes with different TiO2 content were prepared with the technology of electrospinning using ethyl orthosilicate, butyl titanate and polyvinyl pyrrolidone as silicon titanium sources and spinning aids. TGA, XRD, SEM and FT-IR were used to analyze the thermal decomposition process, phase composition, microscopic morphology and infrared properties of the products. The study showed that with the increase of the calcination temperature, the TiO2 phase gradually changed from amorphous to anatase structure. Above 900 °C, a sample containing rutile TiO2 with a higher refractive index was obtained. Simultaneously, the continuity of the sample deteriorated, and the mechanical properties deteriorated. The study found that after calcination at 900 °C, the fiber membrane with a TiO2 content of 12% had the lowest cost and the best overall performance, with tensile strength being 3.09 MPa, and thermal conductivity at 500 °C being 0.0899 W m−1 K−1, which is 20% lower than that of pure SiO2 fiber membrane. This research provides a reference for the development of high temperature insulation materials with good flexibility.
Introduction
With the increasingly serious environmental problems worldwide, reducing energy consumption and greenhouse gas emissions, and achieving “carbon neutrality” as soon as possible, has become the consensus of most countries.1 To achieve this goal, people use high-performance insulation materials in various fields. SiO2 nanofiber membrane is considered to be a very promising high-efficiency heat insulation material due to its characteristics of high temperature resistance, corrosion resistance, heat insulation performance at normal temperature, and good flexibility.2 According to Stefan–Boltzmann's law and Planck's law, in high temperature environments, near-infrared radiation is the main method of heat transfer among objects. However, pure SiO2 is almost completely transparent to near-infrared radiation of 1–8 μm wavelength.3,4 Therefore, improving the anti-infrared radiation ability of SiO2 nanofiber membrane is key to extending its application prospects.According to the energy band theory and the Fresnel formula, the anti-infrared radiation performance of a material is mainly related to its refractive index and band gap. Choosing an infrared opacifier with a high refractive index and a specific band gap, and doping a high-reflective coating on the fiber surface or doping a sunscreen phase in the fiber are the main measures to improve the infrared radiation resistance of fiber materials.5 Titanium dioxide (TiO2) is a typical broadband-absorbing semiconductor material with three crystal types, namely rutile, anatase and brookite. With a refractive index of 2.7, rutile TiO2 is an inorganic oxide with higher refractive index.6 Compared with traditional infrared-shading materials such as SiC and carbon black, TiO2 has become an ideal infrared-shading agent for having stabler properties. Yang et al.7 used the layer-by-layer (LBL) assembling technique to assemble nano-TiO2 on the surface of PVDF fiber as insulations, and analyzed the influence of TiO2 loading levels on the radiation-induced thermal conductivity. Results show that when the TiO2 content was 5.7%, the radiation-induced thermal conductivity was reduced by nearly 43%. Utilizing hydrothermal growth, Ma et al.8 cast a layer of TiO2 coating on the surface of ZrO2 fiber thus improving the fiber's mechanical strength and resistance to infrared radiation.
Existing reports have shown that TiO2 helps reduce the infrared transmittance of fiber materials, but it has some shortcomings. On the one hand, the process of preparing the coating on the surface of the nanofiber is complicated and it is hard to ensure uniform coating. On the other, the TiO2 film with high permittivity is easy to form a thermal bridge between the fibers, thereby greatly improving the thermal conductivity of the fibers at room temperature.9 Although the fibers prepared by Ma et al. show reflective abilities for infrared waves, because the TiO2 coating caused the fibers to contact each other and forms a thermal bridge in the sample, the thermal conductivity of the ZrO2 fibers coated with TiO2 is as high as 0.6 W m−1 K−1, which is 2.5 times that of pristine ZrO2 fibers.8 “Opacified Fibrous Insulations” proposed by Grunert et al. provides a theoretical basis for solving the above problems. The research pointed out that randomly distributing some reflective metallic particles or flakes in the fiber insulation material can effectively reduce the radiative heat transfer of the material.10 Based on this theory, David et al.11 incorporated TiO2 particles into textiles and studied the radiative heat transfer characteristics of modified fabrics. Results show that the modified fabric had lower infrared transmittance compared with the fabric without doped particles. However, this method is limited in improving the fiber's ability to resist infrared radiation, because too high a particle content will worsen its dispersibility, and also destroy the continuity of the fiber. However, Zhao et al. found that adding ceramic particles to the spun fiber has limited changes in the infrared characteristics of the fiber. When the content of ceramic particles exceeds 8%, many properties of the fiber will be adversely affected, and its spinnability will become worse and the continuity will decrease.12 Therefore, to develop anti-infrared radiation fiber membranes with excellent comprehensive performance, it is necessary to study many factors such as spinning solution and preparation technology.
In this work, we prepared SiO2/TiO2 composite nanofiber membrane with good morphology and mechanical properties by electrospinning, using tetraethyl orthosilicate (TEOS) and tetrabutyl orthotitanate (TBT) as silicon and titanium sources, and acetylacetone (AcAc) was used as an inhibitor of TBT hydrolysis. The effects of calcination temperature and TiO2 content on the phase composition, microscopic morphology and strength of nanofiber membranes were studied, and the anti-infrared radiation mechanism of nanofiber membranes was analyzed. This research provides a certain experimental basis for the preparation of thermal protection systems suitable for different scenarios.
Experimental
Materials
Polyvinyl pyrrolidone (PVP, Mw = 10![[thin space (1/6-em)]](https://www.rsc.org/images/entities/char_2009.gif) 000) was purchased from Tianjin Damao Chemical Reagent Co., Ltd., China. Tetraethyl orthosilicate (TEOS), oxalic acid (H2C2O4), ethanol absolute and, N,N-dimethylformamide (DMF) and tetrabutyl titanate (TBT) were purchased from Tianjin Yongda Chemical Co., Ltd., China. Acetylacetone (AcAc) was purchased from Aladdin Chemical Reagent Co., Ltd., China. All chemicals were of analytical grade and used as received without further purification.
000) was purchased from Tianjin Damao Chemical Reagent Co., Ltd., China. Tetraethyl orthosilicate (TEOS), oxalic acid (H2C2O4), ethanol absolute and, N,N-dimethylformamide (DMF) and tetrabutyl titanate (TBT) were purchased from Tianjin Yongda Chemical Co., Ltd., China. Acetylacetone (AcAc) was purchased from Aladdin Chemical Reagent Co., Ltd., China. All chemicals were of analytical grade and used as received without further purification.
Sample preparation
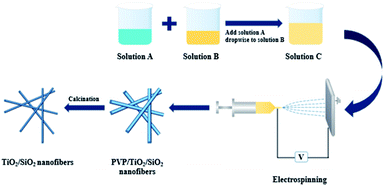
Uniformly mix the TEOS and deionized water in a mass ratio of 1![[thin space (1/6-em)]](https://www.rsc.org/images/entities/char_2009.gif) :
:![[thin space (1/6-em)]](https://www.rsc.org/images/entities/char_2009.gif) 1, and use oxalic acid as a catalyst. Solution A was obtained after 14 hours of magnetic stirring of the above mixture at room temperature. Fully mix 0.04 g, 0.08 g, 0.12 g and 0.16 g of TBT with 0.1 g AcAc and 0.5 g absolute ethanol respectively, and add the mixed solution of PVP and DMF to the above mixture, and then stir the mixture for 6 hours to obtain solution B. Under strong magnetic stirring, solution A was added dropwise to solution B to prepare a spinning precursor solution.
1, and use oxalic acid as a catalyst. Solution A was obtained after 14 hours of magnetic stirring of the above mixture at room temperature. Fully mix 0.04 g, 0.08 g, 0.12 g and 0.16 g of TBT with 0.1 g AcAc and 0.5 g absolute ethanol respectively, and add the mixed solution of PVP and DMF to the above mixture, and then stir the mixture for 6 hours to obtain solution B. Under strong magnetic stirring, solution A was added dropwise to solution B to prepare a spinning precursor solution.
The PVP/SiO2/TiO2 precursor fiber membrane was prepared by a fully automatic electrospinning machine. Electrospinning parameters were as follows: at room temperature, the voltage was 15 kV; the needle was a 21G stainless steel needle, the distance between the needle and the receiving plate was 20 cm, and the precursor fluid flow rate was 0.1 mL h−1.
The above PVP/SiO2/TiO2 precursor fiber membrane was dried and then put in a resistor furnace with smart temperature control, incinerated for 2 hours after the furnace temperature was increased to 600 °C, 800 °C, 900 °C and 1100 °C, respectively, at the rate of 2 °C min−1, and then cooled to room temperature with the furnace (Scheme 1).
Characterization
The synthesis process of the sample was detected by thermal gravimetric analysis (TGA, SDT-Q600, TA, USA). The phase composition of the sample was detected by X-ray diffraction (XRD, XD6, Purkinje, China). The infrared spectrum of the sample was analyzed by Fourier transform infrared spectrometer (380, Nicolet, USA). The microscopic morphology of the sample was observed with a field emission scanning electron microscope (SEM, SU-8010, Hitachi, Japan). The thermal conductivity of the sample was measured with a thermal conductivity meter (TPS 2500S, Hot Disk, Sweden) using the transient planar heat source method. The tensile strength of the sample was analyzed using a tensile testing machine (INSTRON 5982, USA).Results and discussion
Thermal decomposition process
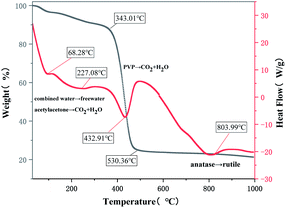
In order to more intuitively demonstrate the mass loss and thermal effect of the sample during the calcination process, a precursor fiber membrane with a TiO2 content of 16 wt% was selected for thermogravimetric analysis. The results are shown in Fig. 2. As can be seen from Fig. 1, the thermal decomposition process of the precursor fiber membrane can be roughly divided into four stages: the first stage is from room temperature to 343.01 °C, the weight loss rate on the TGA curve was about 10.44%, corresponding to the obvious endothermic peaks at 68.28 °C and 227.08 °C on the DSC curve. The change in the first half of the TGA curve (from room temperature to 100 °C) at this stage was induced by the volatilization of free water and residual solvent adsorbed on the surface of the precursor fiber membrane. Changes in the second half (100–343.01 °C) were related to the loss of bound water, the decomposition of acetylacetone and PVP side chain. The second stage was when the temperature was between 343.01–530.36 °C. A large weightlessness step appeared on the TGA curve, with a weight loss rate of 61.99%, which corresponded to a large endothermic peak at 432.91 °C on the DSC curve. This is mainly caused by the carbonization of PVP and the complete decomposition of TEOS hydrolysate. When the temperature exceeded 530.36 °C, the TGA curve tended to be stable, and the weight loss rate basically did not change, indicating the completion of the thermal decomposition process of the precursor fiber membrane. The weight loss rate in the whole process was about 72%. The DSC curve showed an obvious endothermic peak at 803.99 °C, because the crystal structure of TiO2 began to transform from anatase type to the stabler rutile type, which is an energy-absorbing process. Therefore, to prepare pure inorganic substances, the calcination temperature must be set to 530 °C and above. To obtain rutile TiO2, the calcination temperature must be set to 803 °C and above.Phase and morphology analysis
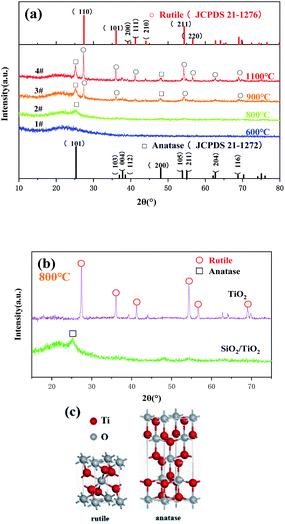
In order to further clarify the phase composition of the samples at different calcination temperatures, XRD analysis was made on the products of the precursor fiber membranes calcined at different temperatures. Sample No. 1–4 are obtained by calcining the precursor fiber membrane (16 wt% TiO2) from room temperature to 600 °C, 800 °C, 900 °C and 1100 °C at a rate of 2 °C min−1. Fig. 2(a) shows the XRD patterns of four samples. As can be seen from it, a wide dispersion peak appeared in the four curves at 2θ = 23°, indicating that SiO2 always exists in an amorphous state as the temperature increases. Diffraction curve of sample No. 1 had no other peaks except the amorphous diffraction peak of SiO2, indicating that TiO2 had not yet been crystallized at this temperature. After calcination at 800 °C, the curve had a low diffraction peak at 2θ = 25.3° attributed to the anatase phase (101) crystal plane, indicating that TiO2 had undergone a crystalline transformation at this temperature, but the degree of crystallinity was low. As temperature rose, after calcination at 900 °C, sample No. 3 showed strong diffraction peaks on (101) and (110) crystal planes. Comparing the PDF cards JCPDS No. 21-1272 and JCPDS No. 21-1276, it is found that they belonged to the anatase-type and the rutile-type TiO2. The degree of crystallization was further improved, and the crystal structure was gradually complete. It shows that the A-to-R crystal phase transition took place near this temperature range, which is consistent with the results of the DSC curve. The XRD curve of the product calcined at 1100 °C showed strong and sharp diffraction peaks on the crystal planes (101), (110), (111), (211) and (220), demonstrating that the crystal lattice of the product is complete and the crystal orientation is high. Seen from the changes of the four curves, as the calcination temperature increased, the SiO2 in the product was always amorphous, and the TiO2 changed from amorphous to anatase structure, and finally to rutile structure. According to Ostwald's step rule, during the growth and phase transition of a crystal, its metastable crystal form always appears first, and then changes to a stabler crystal form.13 According to Pauling rule, the rutile structure has better stability than the anatase structure.14 Therefore, as temperature rose, TiO2 saw the change from amorphous to A and then to R. Fig. 2(b) shows the XRD patterns of precursor B calcined at 800 °C and sample No. 2. It can be clearly seen from the figure that the former is pure rutile TiO2. Comparing it with Fig. 2(a), it can be seen that the crystallization degree of TiO2 in SiO2/TiO2 composite fibers was significantly lower than that of pure TiO2 fibers, indicating that the presence of SiO2 had an inhibitory effect on the crystalline transformation of TiO2. Possibly, in SiO2/TiO2 composite fibers, the volume-dominant SiO2 phase closely surrounds the periphery of the TiO2 lattice, and even cross-links with it, resulting in a lack of sufficient space in the TiO2 lattice to achieve particle rearrangement. It has an inhibitory effect on its phase transition.15Fig. 3(a)–(e) are the SEM images of the precursor fiber membrane and samples No. 1 to No. 4, and Fig. 3(f) is the energy spectrum of sample No. 3. Fig. 4 is a curve of the fiber diameter change of the precursor fiber membrane and its calcined product measured by Image J software. As can be seen from Fig. 3 and 4, the precursor fiber had a good morphology, good continuity, smooth surface and no adhesion. The products before and after calcination showed an irregularly-distributed three-dimensional network structure, and as the heat treatment temperature increased, the fiber diameter of the product decreased before increasing. The reason for this phenomenon can be explained as follows: after the precursor fiber was calcined at 600 °C, the product fiber diameter was greatly reduced due to the decomposition of the polymer template. However, there were still traces of organic components and voids left by the decomposition of the polymer template inside the fiber. After calcination at 800 °C and 900 °C, the remaining trace organic components were further removed, while the inorganic components collapsed, filling the voids inside the fiber and further reducing the diameter. After calcination at 1100 °C, the diameter of the fiber was greatly increased, and the breakage was increased, mainly because the high temperature destroyed the Si–O–Si covalent bond network structure in amorphous SiO2. According to the EDS energy spectrum of sample No. 3, it can be determined that Ti element was present, and its content was 9.12%. This is consistent with the addition amount of each component in the preparation process of SiO2/TiO2 composite fiber. It shows that the electrospinning method can make SiO2 and TiO2 coexist stably in nanofibers.
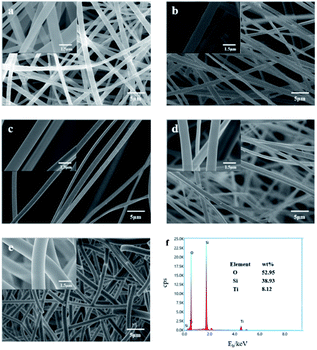 | ||
| Fig. 3 (a–e) SEM images of precursor fiber membrane, sample No. 1, sample No. 2, sample No. 3 and sample No. 4; (f) energy spectrum of sample No. 3. | ||
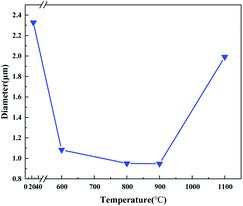 | ||
| Fig. 4 The average diameter change curve of fiber membrane at room temperature and No. 1, No. 2, No. 3, and No. 4 samples. | ||
Infrared analysis
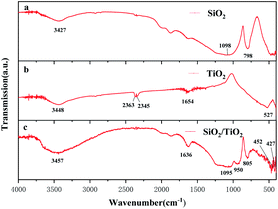
Fig. 5 is the FTIR spectra of precursor A, precursor B and sample No. 3 under the same heat treatment conditions. As shown in the figure, peak at 1636 cm−1 is related to amide group and the one at 3420 cm−1 is related to hydroxyl. They are respectively related to the hydroxy (–OH) in the fiber bound water and free water.16 It can be seen from Fig. 5(a) that the strong and broad absorption peaks in the range of 1000–1250 cm−1 and the absorption peaks near 798 cm−1 were attributed to the antisymmetric and symmetrical stretching vibration peaks of Si–O–Si.17 The product in Fig. 5(b) had a sharp absorption peak at 527 cm−1, which corresponded to the characteristic peak of the Ti–O bond in TiO2. This peak was red-shifted in Fig. 5(c), which can be explained as the presence of SiO2 inhibits the phase transition of TiO2, and there are more anatase TiO2 with metastable structures in SiO2/TiO2 composite fibers.18,19 This is consistent with the XRD analysis structure. Fig. 5(c) shows that the product had a characteristic vibration band of Ti–O bond in rutile TiO2 near 427 cm−1, again confirming that TiO2 had undergone a crystal phase transition at this temperature.18 Compared with Fig. 5(a) and (b), Fig. 5(c) shows that the product had a new obvious absorption peak at 950 cm−1. At present, there is no consensus on the attribution of the absorption peaks. Here we adopt the view of Zhai et al. and consider it to be the stretching vibration absorption peaks of Ti–OH and Ti–O–Si bonds,20,21 indicating the occurrence of the bonding action of SiO2 and TiO2 in SiO2/TiO2 composite fibers.Thermal radiation performance analysis
Under high temperature conditions, thermal radiation is the most important way of heat transfer between objects. Radiant thermal conductivity (kr) reflects the ability of an object to conduct heat through thermal radiation, and can be calculated by the following formula:22
 | (1) |
 | (2) |
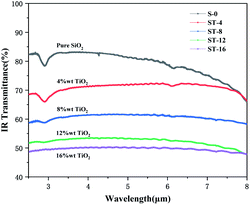
Fig. 6 shows the infrared transmittance curves of fiber membranes with different TiO2 content (0, 4%, 8%, 12% and 16%, respectively) after heat treatment at 900 °C in the range of 2.5–8 μm. It can be seen from the figure that under the same test conditions, as the content of TiO2 increased, the infrared transmittance of the product continued to decrease, indicating that the addition of TiO2 will significantly reduce the infrared transmittance of the fiber membrane. The infrared transmittance difference of the products ST-12 and ST-16 was small, indicating that when the content of TiO2 sunscreen reaches a certain amount, increasing the content of TiO2 produces no obvious effect on improving the radiant thermal conductivity of the nanofiber membrane.
Generally speaking, the infrared radiation incident on the material will be transmitted, reflected and absorbed. The mechanism of reflection of radiation on the surface of the material is very complicated, and it is not yet possible to get a satisfactory explanation from the perspective of quantum. From a macro point of view, the reflectivity R of the composite material can be obtained by the formula below:24
 | (3) |
The process of composite materials absorbing infrared radiation can be explained by the energy band theory. According to this theory, the band structure of semiconductor materials is composed of a valence band full of electrons and an empty conduction band. What is shown, basically, is that the titanium 3d, 4s, and 4p atonic orbitals are interacting with the oxygen 2s and 2p atomic orbitals to form a set of molecular orbitals having the usual bonding, antibonding, and nonbonding term symbols.25 The top of the valence band is the unbonded Opπ orbital, and the bottom of the conduction band is the Tit2g orbital. The energy interval between these two orbitals is called the forbidden band (Eg) of rutile TiO2. When the incident infrared radiation reaches the band gap of rutile TiO2, the electrons will absorb the energy and transit from the valence band to the conduction band, thereby absorbing fixed-frequency electromagnetic radiation.26 In addition, TiO2 particles can also convert the absorbed energy into infrasound waves, further weakening the intensity of infrared radiation in the original direction (Fig. 7).
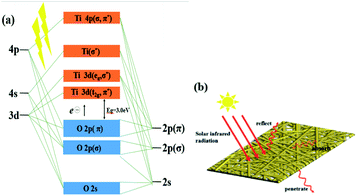 | ||
| Fig. 7 (a) Energy band diagram of rutile TiO2, (b) reflection, transmission and absorption of solar thermal radiation on the fiber membrane. | ||
Heat transfer process analysis
Fig. 8 shows the thermal conductivity curves at different temperatures of SiO2 nanofiber membrane and SiO2/TiO2 composite fiber membrane (ST-12) after heat treatment at 900 °C. It can be seen from the figure that both fiber membranes had lower thermal conductivity at room temperature, being 0.045 W m−1 K−1 and 0.046 W m−1 K−1, respectively, showing better thermal insulation performance than the common thermal insulation fiber felt in the market. As the test temperature going up, the thermal conductivity of the sample increases significantly. At 300 °C and 500 °C, the thermal conductivity of SiO2 nanofiber membranes increased to 0.092 W m−1 K−1 and 0.12 W m−1 K−1. After adding TiO2, the thermal conductivity of the sample at these two temperatures decreased by 16% and 25%, respectively, to 0.078 W m−1 K−1 and 0.089 W m−1 K−1. The properties of the composite fiber membrane and the existing high-temperature insulation materials are compared and the data are summarized in Table 1. It can be seen from the table that in the range of 400–600 °C, ST-12 has a lower thermal conductivity than most metal oxide fibers, and it is also in a reasonable range compared with pure SiO2 fibers.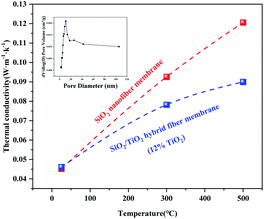 | ||
| Fig. 8 The thermal conductivity change curves of the two fiber membranes at different temperatures and the BJH pore size distribution diagram of the composite fiber membrane. | ||
| Material | Tensile strength (MPa) | Thermal insulation property | Test temperature (°C) | Test method | |
|---|---|---|---|---|---|
| Thermal conductivity (W m−1 K−1) | Temperature difference on cold side (°C) | ||||
| CaZrO3 fibers | 0.413 | 400 | Laser flash method | ||
| SiO2 fibers | 3.2 | 0.12 | 500 | Transient planar heat source method | |
| ST-12 | 3.09 | 0.089 | 500 | Transient planar heat source method | |
| ZrO2 fibers (plated with CeO2–Y2O3 coating) | 0.25 | 500 | Laser flash method | ||
| ZrO2 fibers (plated with TiO2 coating) | 0.6 | 600 | Laser flash method | ||
| Y2O3 fibers | 1.2 | 1124 | 1500 | Temperature difference method | |
According to the BJH pore size distribution diagram, the product ST-12 is a typical mesoporous material, with the pore size mostly distributed between 10–30 nm, that is, much smaller than the mean free path of air.27 Therefore, there was no gas thermal convection inside the fiber membrane, which is of great significance to improving its thermal insulation performance. Since the geometric scale of SiO2 nanofibers is at the same magnitude as the mean free path of a particle of phonon, the scattering of phonons at the fiber boundary will greatly affect the energy transmission efficiency.28 In addition, the nanoporous structure of the fiber membrane destroyed the connection network of solid SiO2, and further reduced the solid-phase heat conduction of the material. When temperature rose, the thermal conductivity of the SiO2 fiber membrane increased rapidly, while the thermal conductivity of ST-12 increased slowly. As the temperature increases, the proportion of radiant heat increases, and the shielding effect of TiO2 on thermal radiation gradually appears, effectively reducing the thermal conductivity of the composite fiber membrane.
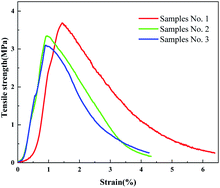
Fig. 9 shows the stress–strain curves of samples No. 1 to No. 3. It can be seen from the figure that as the calcination temperature changed, the initial modulus and tensile strength of the fiber membrane changed. The initial modulus of sample No. 1 was significantly smaller than that of sample No. 2 and sample No. 3, indicating that the fiber has better flexibility at 600 °C. Similarly, with the increase of the calcination temperature, the strength of the fiber membrane was also decreasing, being 3.6 MPa, 3.4 MPa and 3.09 MPa, respectively. This is because there were still a small number of organic components in the sample at 600 °C which would improve the toughness and strength of the fiber membrane. At high temperatures, the TiO2 crystal lattice in the fiber was well developed, and the crystalline part destroyed the molecular chain in the amorphous region, resulting in a decrease in the strength of the fiber membrane. Even so, the strength of sample No. 3 can still meet its basic requirements as a thermal insulation material.
Conclusions
In summary, a flexible SiO2/TiO2 composite fiber membrane with good thermal insulation properties was prepared with the technology of electrospinning. The addition of TiO2 with infrared shielding effect significantly reduced the thermal conductivity of the fiber membrane at high temperatures. And the cross-linking of SiO2 and TiO2 on the molecular scale ensured the good flexibility of the fiber membrane. In addition, after calcination at 900 °C, the composite fiber membrane with a TiO2 content of 12% can achieve better overall performance at the lowest cost. In this scheme, the rutile TiO2 had a higher conversion rate. The tensile strength of the sample was 3.09 MPa, and the thermal conductivity at 500 °C was 0.0899 W m−1 K−1, which is 20% lower than that of pure SiO2 fiber membrane. This kind of flexible thermal insulation material with excellent performance under high temperature conditions is expected to be fully applied in special occasions such as space suits and missile radomes.Author contributions
Yilong Song: writing – original draft, formal analysis, resources and visualization; Fang Zhao: data curation and methodology; Zhizun Li: project administration and supervision; Zhaogang Cheng: funding acquisition; Hongjun Huang: conceptualization; Mifen Yang: writing – review & editing.Conflicts of interest
There are no conflicts to declare.Acknowledgements
This work is supported by the Hebei Natural Science Foundation of China (E2015506011) and Innovation and Development Science Foundation of the PLA Army Engineering University Shijiazhuang Campus (KYSZJQZL1910).Notes and references
- B. Eggertsson Dagur, Lancet Planet. Health, 2021, 5(2), e71 CrossRef CAS.
- Y. S. Si, X. Mao, H. X. Zheng, J. Y. Yu and B. Ding, RSC Adv., 2014, 5(8), 6027–6032 RSC.
- Y. Liu, D. Pan, W. Chen, W. Q. Wang, H. Shen and H. X. Xu, Acta Phys. Sin., 2020, 69(03), 7–24 Search PubMed.
- H. Brendel, G. Seifert and F. Raether, J. Thermophys. Heat Transfer, 2017, 31(2), 463–472 CrossRef CAS.
- X. S. Zhang, B. Wang, N. Wu, C. Y. Wu and Y. D. Wang, J. Inorg. Mater., 2021, 36(03), 245–256 CrossRef.
- H. X. Zhang, X. D. He and F. He, J. Alloys Compd., 2009, 469(1–2), 366–369 CrossRef CAS.
- J. Yang, H. Wu, M. Wang and Y. Liang, Int. J. Heat Mass Transfer, 2018, 117, 729–739 CrossRef CAS.
- D. H. Ma, L. Y. Zhu and B. L. Liu, Ceram. Int., 2020, 46(3), 3400–3405 CrossRef CAS.
- Y. Yu, Y. Zhao, Y. L. Qiao, Y. Feng and W. D. Fei, J. Mater. Sci. Technol., 2021, 84, 10–15 CrossRef.
- W. E. Grunert and F. Notaro, AIAA 4th Thermophysics Conference, 1969, pp. 40–45 Search PubMed.
- D. M. Anderson, J. R. Fessler, M. A. Pooley, S. Seidel and J. F. Brennan, Biomed. Opt. Express, 2017, 8(3), 1698 CrossRef CAS.
- D. Q. Zhao and F. Yang, Infrared Technology, 2002(05), pp. 57–59 Search PubMed.
- G. T. Rengarajan, D. Enke, M. Steinhart and M. Beiner, Phys. Chem. Chem. Phys., 2011, 13(48), 21367–21374 RSC.
- P. Huang, B. Shang, L. J. Li and J. L. Lei, Chin. J. Chem. Phys., 2015, 28(6), 681–687 CrossRef CAS.
- R. D. Shannon, J. Appl. Phys., 1964, 35(11), 3414–3416 CrossRef CAS.
- Q. Chen, J. Dong, W. Shi, W. Dong and X. Yao, Appl. Surf. Sci., 2009, 255(18), 7918–7924 CrossRef CAS.
- W. S. Xiao, W. S. Peng, G. X. Wang, F. Y. Wang and K. N. Weng, Spectrosc. Spectral Anal., 2004, 24(6), 690–693 CAS.
- L. S. Yin, H. Shen and J. X. Zhang, Acta Electron., 2002,(06), 808–810 Search PubMed.
- L. P. Sun, S. Gao, H. Zhao, L. H. Huo and J. G. Zhao, Journal of Light Scattering, 2003,(04), 300–302 Search PubMed.
- J. W. Zhai, L. Y. Zhang and X. Yao, J. Funct. Mater., 1997,(05), 46–47 Search PubMed.
- L. Zhao, D. X. Wang, J. S. Gao and C. M. Xu, Chin. J. Catal., 2005,(01), 15–19 CrossRef.
- J. Kuhn, T. Gleissner, M. C. Arduini-Schuster, S. Korder and J. Fricke, J. Non-Cryst. Solids, 1995, 186, 291–295 CrossRef CAS.
- L. Bai and Y. T. Xin, Electro-Optic Warfare & Radar Passive Countermeasures, 2002(03), pp. 17–18 Search PubMed.
- X. Z. Gan, PhD thesis, Shandong University, 2018.
- W. D. Fischer, Phys. Rev. B: Solid State, 1972, 5(11), 4219–4226 CrossRef.
- F. M. Hossain, A. V. Evt, I. V. Belova, J. Nowotny and G. E. Murch, Comput. Mater. Sci., 2010, 48(4), 854–858 CrossRef CAS.
- X. Lu, M. C. Arduini-Schuster, J. Kuhn, O. Nilsson, J. Fricke and R. W. Pekala, Science, 1992, 255(5047), 971–972 CrossRef CAS.
- W. Y. Chen, PhD thesis, Southeast University, 2017.
- S. Y. Shi, K. K. Yuan, C. H. Xu, X. T. Jin, Y. S. Xie, Z. H. Wang, X. Q. Wang, L. Y. Zhu, G. H. Zhang and D. Xu, Ceram. Int., 2018, S0272884218311283 Search PubMed.
- J. M. Yang, H. J. Wu, M. R. Wang and Y. Y. Liang, Int. J. Heat Mass Transfer, 2018, 117, 729–739 CrossRef CAS.
- Y. S. Xie, L. Wang, B. X. Liu, L. Y. Zhu, S. Y. Shi and X. Q. Wang, Mater. Des., 2018, 160(DEC), 918–925 CrossRef CAS.
| This journal is © The Royal Society of Chemistry 2021 |

