 Open Access Article
Preparation of CuHY catalyst via solid-state ion exchange method and its catalytic performance in isobutane/2-butene alkylation†
Xinyan Sun,
Xiang Zhang,
Tao Zheng,
Haiyan Liu *,
Rui Zhang,
Xianghai Meng,
Chunming Xu and
Zhichang Liu*
State Key Laboratory of Heavy Oil Processing, China University of Petroleum-Beijing, Beijing 102249, P. R. China. E-mail: klc@cup.edu.cn; lzch@cup.edu.cn
First published on 29th June 2021
Abstract
CuHY samples prepared by solid-state ion exchange of HY zeolite with CuCl were used as catalysts in isobutane/2-butene alkylation. The results show that both the addition amount of CuCl and the calcination temperature affect the ion exchange degree. Cu+ can be introduced into Y zeolite by replacing H+ in the HY zeolite after the solid-state ion exchange, causing a decrease of the amount of Brønsted acid sites and an increase of that of Lewis acid sites. When taking CuHY as the catalyst in isobutane/2-butene alkylation, the 3d104s0 valence electron configuration of Cu+ makes it favorable for inhibiting the oligomerization of 2-butene and accelerating the hydride transfer reaction rate by indirectly increasing the local isobutane/olefin ratio around the acid sites of the catalyst. As a result, the selectivity of C8 and trimethylpentanes over CuHY in alkylate are improved compared with those of HY.
1 Introduction
Isobutane/butene alkylation plays a significant role in the petroleum refining industry because the produced alkylate, which has a high octane number and low contents of sulfur, olefin and aromatics, is viewed as an environment-friendly gasoline component.1 The traditional alkylation processes, including concentrated sulfuric acid alkylation and hydrofluoric acid alkylation, have serious environmental pollution problems and safety risks, which limit their further development and wide application.2–4 Our research group developed a novel composite ionic liquid alkylation (CILA) technique and the first industrial unit was successfully started up in 2013, however, the spent ionic liquid needs further treatment.5–7In addition, many research studies focus on the development of novel alkylation processes using various solid acids, such as zeolites, supported heteropolyacids and solid superacids as catalysts,8–13 in which Y zeolite is the most extensively studied one because of its suitable pore structure and relatively strong acidity.14–17 However, the rapid deactivation of zeolites caused by the formation of oligomers constrains their further application.18–20
The acidity of Y zeolite, which is mainly determined by the Si/Al ratio of zeolite, is the key factor that influences its activity, selectivity and stability in isobutane/butene alkylation. De Jong21 and Yoo22 found that Y zeolite with a lower Si/Al ratio, of which the concentration of Brønsted acid sites was higher, had a longer lifetime and higher trimethylpentanes (TMPs) selectivity. Corma et al.15 compared the alkylation performance of USY catalysts with different unit cell sizes, and pointed out that a high unit cell size (low Si/Al ratio) could lead to enhancement of hydride transfer and rapid desorption of carbocations from the Brønsted acid sites, which suppressed side reactions. In addition to the Si/Al ratio, modification of Y zeolite with rare earth metals, especially lanthanum, also influences its acidity. Schüßler et al.23 used H-USY and La-USY as catalysts in alkylation and found that the lifetime extended from 5 h for H-USY to 12 h for La-USY. The authors further indicated that the higher ratio of strong Brønsted acid sites to total Brønsted acid sites of La-USY caused by La3+ improved the hydride transfer and cracking reactions.
In addition to the acidity of the zeolite, as for alkylation, the isobutane/olefin (I/O) ratio in the reaction system is another key factor which significantly affects the activity and stability of catalysts.24 De Jong21 and Taylor25 believed that low I/O ratio resulted in shorter lifetime of catalysts. Corma et al.26 revealed that the oligomerization of butene and the formation of C9+ could be significantly inhibited under higher I/O ratio. Kiricsi et al.27 found that isobutane could suppress the formation of unsaturated carbocations which was the precursors of carbonaceous deposits because of its enhanced hydride ion donor activity. High I/O ratio is usually adopted to inhibit the oligomerization of olefins, especially when fixed bed reactor is used.16,17,28 With higher I/O ratio, the olefin concentration around the catalytic center is lower, inhibiting the further reaction of alkyl carbocations with other olefins which forms undesired heavier products.29–31
There are many advantages of increasing the I/O ratio, but this is mainly achieved by enhancing the I/O ratio in feed and the recycle of isobutane is inevitable, which largely increases operating cost. Additionally, the local I/O ratio around the acid sites is significantly lower than that of the feed at the reactor inlet due to the stronger adsorption capacity of zeolite for olefins than paraffins.32–34 Therefore, increasing the local I/O ratio around the acid sites is the key to suppress olefin oligomerization and extend the life of the catalysts.
Due to the unique valence electron configuration of Cu+ of 3d104s0, Cu+ modified materials are often used as π-complexation sorbents for the separation of olefin/paraffin.35,36 Luna-Triguero et al.37 found that Cu-BTC metal–organic framework was promising in separating isobutane/isobutene mixtures because of the formation of π-complexation between Cu+ and olefins. Qin et al.38 prepared a Cu(I)Y zeolite using liquid phase ion exchange method followed by reduction with methanol at low temperature, and the obtained Cu(I)Y favored the separation of propylene/propane because of the π-complexation of Cu(I) with propylene.
In addition to the application in the field of adsorption separation, it is also proved that Cu+ can be used in isobutane alkylation process. In the development of the CILA process, our group found that after introducing CuCl into the conventional chloroaluminate ionic liquid, the resulted AlCuCl5− could coordinate with butene and tert-butyl carbocation, which promoted the formation of TMPs.6 Zhang et al.39 modified LaX zeolite via liquid phase ion exchange with Cu2+ followed by reduction and found that the resulted CuLaX had longer lifetime and higher selectivity of TMPs. The authors believed that Cu species in the state of Cu+ could compete with acid sites to adsorb butene and increase the local I/O ratio in alkylation reaction. However, it was worthy noting that, Cu(II) was also present in the produced CuLaX expect for Cu(I) due to the difficulty in controlling the reduction process performed after the liquid phase ion exchange. This problem can be avoided when solid-state ion exchange (SSIE) is performed. It can be realized by calcinating the mixture of cuprous salt (such as CuCl) and zeolite under inert atmosphere, keeping the Cu species in the monovalent state.
However, there are few research studies on the application of HY zeolite modified by Cu in alkylation prepared via SSIE method, and the influence of preparation conditions on the physicochemical properties of the product and its alkylation performance is unclear. In this research, Cu modified HY catalysts were prepared by SSIE method. The effects of the addition amount of CuCl and the calcination temperature on the physicochemical properties of the resulted CuHY zeolites and their catalytic performance in isobutane/2-butene alkylation were studied.
2 Experimental
2.1 Materials
NaY zeolite was provided by Nankai University Catalyst Co., Ltd. (Tianjin, China). Cuprous chloride (CuCl, 97 wt%) and ammonium chloride (NH4Cl, 99.5 wt%) were obtained from Shanghai Aladdin Biochemical Technology Co., Ltd. (Shanghai, China). Isobutane was provided by Tianjin Dongchuang Rixing Technology Co., Ltd. (Tianjin, China). 2-Butene was obtained from PetroChina Lanzhou Petrochemical Co., Ltd. (Lanzhou, China).2.2 Catalyst preparation
Firstly, NaY zeolite was ion exchanged with NH4Cl solution (1 mol L−1) at 90 °C for 4 h with a solution to zeolite ratio of 10 mL g−1, then it was filtered and washed with deionized water. After the sample was dried and calcinated, these steps were repeated three times to obtain the HY sample.A series of CuHY zeolites with various molar Cu/Al ratios were prepared by SSIE method.40 Typically, 0.1 g CuCl and 5 g HY zeolite were ground in a pestle mortar for uniform mixing, then the mixture was heated in flowing nitrogen at a heating rate of 10 °C min−1 up to 450 °C and held for 2 h in a tube furnace. When the temperature dropped, CuHY catalysts were obtained and named as CuHY-x%-y, where x% represents the mass percentage of CuCl added to HY zeolite with the value of 1%, 2% and 3% and y represents the treating temperature with the value of 400 °C, 450 °C and 500 °C. For comparison, the mechanically mixed sample with 2 wt% CuCl without calcination was prepared and defined as HY + 2% CuCl.
The dealuminated sample was obtained by hydrothermal treatment of HY zeolite in 100% steam at 450 °C for 50 min, and named as HY–S.
2.3 Physicochemical characterization
The thermogravimetry-mass spectrum (TG-MS) analysis was performed on a STA 8000 thermogravimetric analyzer and Clarus SQ 8 S spectrometer produced by PerkinElmer. Evenly mixed sample was placed into the thermogravimetric analyzer and heated to 800 °C at a rate of 10 °C min−1 under flowing nitrogen. X-ray fluorescence (XRF) was performed on a Bruker S4 Explorer analyzer to obtain the chemical composition of the samples. N2 adsorption–desorption experiments was performed at −196 °C on a Micromeritics ASAP 2420 instrument. Specific surface areas of the samples were calculated via the Brunauer–Emmett–Teller (BET) method, while the external surface areas and micropore volumes were estimated via t-plot method. X-ray diffraction (XRD) pattern was obtained by a Bruker AXS D8 Advance X-ray diffractometer with Cu Kα radiation. Images of the samples were observed by field-emission scanning electron microscopy (FESEM) on a FEI Quanta 200F machine.The type and amount of acid sites were obtained by pyridine-adsorbed infrared (Py-IR) spectra recorded on a Nicolet 5700 spectrometer. Before measurement, the sample was pretreated under vacuum (10−3 Pa) at 400 °C for 1 h, and the background spectrum was taken after the sample was cooled down to 30 °C. Subsequently, pyridine was introduced into the system. Then the system was kept at 200 °C and 350 °C respectively for 0.5 h under vacuum, and the spectra were recorded after the sample was cooled down again to 30 °C. The bands at 1540 cm−1 and 1450 cm−1 are attributed to Brønsted acid sites and Lewis acid sites, respectively.41 X-ray photoelectron spectroscopy (XPS) was analyzed on a Thermo Scientific K-Alpha instrument. 29Si magic angle spinning nuclear magnetic resonance (MAS NMR) spectroscopy characterization was performed on a JNM-ECZ600R spectrometer. Inductively coupled plasma optical emission spectrometry (ICP-OES) analysis was performed on a PerkinElmer Optima 7000 DV analyzer to obtain the contents of Al and Cu elements in the catalyst before and after alkylation.
2.4 Catalytic tests
The alkylation performance was tested in a tubular fixed bed reactor (an inner diameter of 8 mm and a length of 600 mm). Prior to the reaction, 1 g of catalyst was loaded into the reactor and activated in situ at 170 °C in flowing nitrogen. After the temperature dropped to 80 °C, the reactor was filled with nitrogen to maintain a pressure of 2.0 MPa. Then the isobutane/2-butene mixture (I/O molar ratio of 150) was fed, and the mass space velocity of 2-butene was 0.1 h−1. The product was collected with a closed sampling canister and then injected into an Agilent 7890B gas chromatograph equipped with an FID detector by the pressure-lock syringe.3 Results and discussion
3.1 Thermal analysis
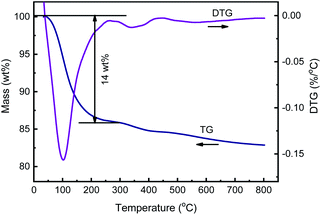
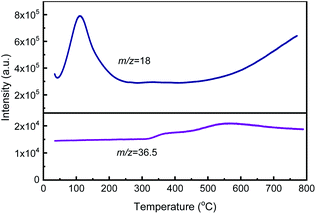
The SSIE of HY zeolite with CuCl was carried out in a tube furnace in flowing N2 with the offgas passing through a flask containing silver nitrate aqueous solution. During the SSIE process, white AgCl precipitation in the offgas collecting flask was observed, suggesting the formation of HCl, as mentioned in several ref. 42–44. As the calcination is the key step of SSIE process, TG-MS method was used to monitor the mass loss during the calcination process and detect the gas composition generated.Fig. 1 and 2 display the TG–DTG curves and MS signals at m/z = 18 and 36.5 during the heating process of HY + 2% CuCl, respectively. As shown in Fig. 1, during the calcination, a strong dehydration peak at around 110 °C appears in the DTG curve, corresponding to a mass loss of about 14 wt% in the TG curve. Additionally, there are two other weaker mass loss peaks at 310–430 °C and 430–700 °C in the DTG curve, respectively, which may be caused by the interaction between CuCl and HY. As can be seen from the MS result (Fig. 2), there is a strong signal of m/z = 18 at around 110 °C, caused by the desorption of H2O and corresponding with the mass loss of 14 wt% in the TG curve in Fig. 1. Whereas two weaker peaks at about 310–430 °C and 430–700 °C on the mass spectrum of m/z = 36.5 correspond to the release of HCl, indicating the generation of HCl due to the reaction of CuCl and H+ in HY zeolite during the calcination process.
It is worthy noting that the presence of the two weaker peaks in both DTG curve and MS characterization results indicates that the reaction of CuCl and HY zeolite during the calcination undergoes two stages: the first occurs at 310–430 °C, before the melting point of CuCl, in which CuCl in solid state could not react sufficiently with HY and the ion exchange degree is relatively low; and the second occurs at about 430–700 °C, just beyond the melting point of CuCl of 426 °C, in which CuCl melts and disperses more evenly and can react more rapidly and sufficiently with HY zeolite and the ion exchange degree is high.
On the other hand, from Fig. S1,† during the calcination, the phase of Y zeolite in HY + 2% CuCl sample remains while its relative crystallinity decreases. When being heated to 400 °C and 500 °C, the sample remained relatively high crystallinities (91.4% and 87.9%, respectively); while as the temperature was enhanced to 800 °C, the crystallinity of Y zeolite decreased dramatically to 63.9%. This is because Y zeolite as a kind of low-silica zeolite is easy to be dealuminated at high temperature.45 Therefore, the calcination temperature during SSIE process should be higher than the melting point of CuCl to achieve a sufficient ion exchange while lower than the temperature at which the framework structure of Y zeolite can be dramatically destroyed.
3.2 Physicochemical properties of catalysts
The elemental compositions of the samples are presented in Table 1. The amount of Na+ in HY is just 0.08 wt%, with the ion exchange degree of 99.1%, and the residual Na+ located in the hexagonal prism or sodalite cages is usually considered to hardly influence the reactions because the hydrocarbons can't access to both of the locations.46,47 As the addition amount of CuCl increases from 1 wt% to 3 wt%, the molar Cu/Al ratio of CuHY increases from 0.026 to 0.085, indicating more Cu was introduced into Y zeolite with the increase of the addition amount of CuCl. The molar Cu/Al ratio of HY + 2% CuCl is 0.052, close to that of CuHY-2%-450 which is with the same addition amount of CuCl.| Samples | Elemental composition | SBETa (m2 g−1) | Smicrob (m2 g−1) | Vtotalc (cm3 g−1) | Vmicrod (cm3 g−1) | |||
|---|---|---|---|---|---|---|---|---|
| Na (wt%) | Al (wt%) | Cu (wt%) | Cu/Al (molar ratio) | |||||
| a BET surface area.b Microporous surface area.c Total pore volume.d Microporous volume. | ||||||||
| HY | 0.08 | 10.86 | 0 | 0 | 664 | 511 | 0.48 | 0.26 |
| HY + 2% CuCl | 0.07 | 10.76 | 1.32 | 0.052 | 520 | 384 | 0.40 | 0.19 |
| CuHY-1%-450 | 0.07 | 10.91 | 0.67 | 0.026 | 559 | 421 | 0.45 | 0.22 |
| CuHY-2%-450 | 0.08 | 10.81 | 1.44 | 0.057 | 548 | 406 | 0.44 | 0.21 |
| CuHY-3%-450 | 0.09 | 10.72 | 2.14 | 0.085 | 558 | 416 | 0.44 | 0.22 |
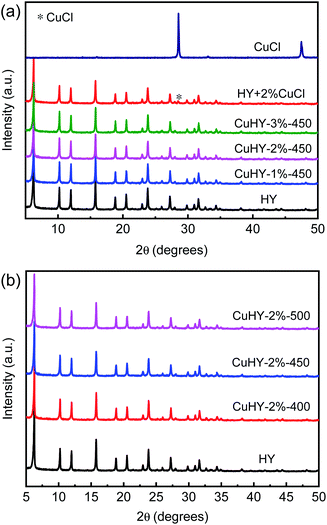
As can be seen from Fig. 3, compared with that of HY, the XRD patterns of HY + 2% CuCl and CuHY samples show all the characteristic peaks ascribed to the phase of Y zeolite while with slight decrease of intensity, suggesting that after the mechanical mixing and the following calcination process, the crystal phase of Y zeolite still remains. The decline of the relative crystallinity of the CuHY samples indicates the slight destroying of the crystal structure of Y zeolite during the SSIE process.
It is worthy to note that compared with those of CuHY samples, the characteristic peak at 2θ = 28.5° ascribed to CuCl can be observed in the XRD pattern of HY + 2% CuCl. This indicates that in the mechanically mixed sample, CuCl disperses unevenly without the calcination process. The absence of characteristic peaks of CuCl or other Cu species in the XRD patterns of the samples obtained via SSIE method indicates that CuCl could disperse uniformly and react with HY after the mixture of CuCl and HY being calcinated.
As shown in Table 1, compared with HY of which the BET surface area and the total pore volume are 664 m2 g−1 and 0.48 cm3 g−1, respectively, all of the three CuHY-x%-450 samples have a relatively lower BET surface area (ca. 550 m2 g−1) and a smaller total pore volume (ca. 0.44 cm3 g−1), and their microporous surface area and microporous volume also decrease slightly. This further illustrates the slight damage of the structure of HY zeolite during the SSIE process. The BET surface area and the total pore volume of HY + 2% CuCl are 520 m2 g−1 and 0.40 cm3 g−1, respectively, which are lower than those of HY and CuHY-x%-450. This may be due to the uneven dispersion of CuCl in the mechanically mixed sample which could cover the surface and block the pores of HY zeolite.
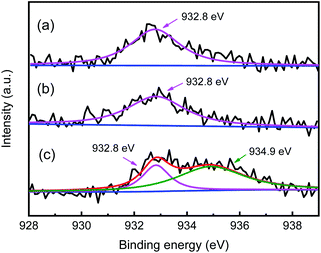
For zeolite catalyst, the stronger adsorption capacity for olefins than paraffins causes the lower local I/O ratio around the Brønsted acid sites than that of the feed at the reactor inlet, which is unfavorable for the alkylation reaction. Cu+ can absorb olefins via π-complexation, which can lower the possibility for olefins to be absorbed on Brønsted acid site.35,39 Therefore, the valence state of Cu is important for the alkylation selectivity. The valence state of Cu in Y zeolite can be effectively differentiated by XPS according to the different binding energies.48,49 In the Cu 2p3/2 XPS spectra of HY + 2% CuCl and CuHY-2%-450 calcinated in N2 (Fig. 4a and b), only one peak located at ca. 932.8 eV appears, which is attributed to Cu+. This indicates that the Cu species in sample undergoing SSIE in flowing N2 can be protected not to be oxidized and keep in the monovalent state. For comparison, the XPS spectrum of the sample calcinated in air is depicted in Fig. 4c, in addition to the peak located at ca. 932.8 eV attributed to Cu+, there is another larger peak at ca. 934.9 eV which is corresponding to Cu2+. This means that both Cu+ and Cu2+ existed in CuHY calcinated in air. The above results show that the calcination atmosphere during the SSIE process influences the valence state of Cu in the product. N2 can play a good protective role during the calcination process, so that the Cu species can keep in the monovalent state.
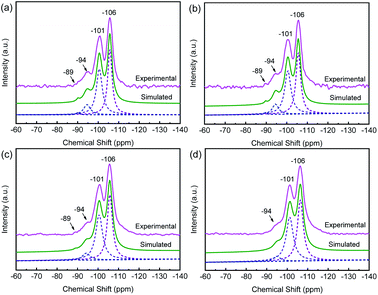
29Si MAS NMR characterization is performed to obtain the framework Si/Al ratio and the local environment of silicon in the sample which determine the acidic property. In the 29Si MAS NMR spectrum of HY (Fig. 5a), there are four peaks with chemical shifts near −106 ppm, −101 ppm, −94 ppm and −89 ppm, which attribute to Si(0Al), Si(1Al), Si(2Al), and Si(3Al), respectively. Its framework molar Si/Al ratio is 5.6, estimated from the spectrum simulation.50 There are no obvious changes in the chemical shifts of these samples. However, for the CuHY samples (Fig. 5b–d), when the calcination temperature increases, the intensity of peak attributed to Si(3Al) and Si(2Al) gradually decreases and that of Si(1Al) and Si(0Al) is gradually enhanced, and the peak attributed to Si(3Al) in CuHY-2%-500 almost disappears, which results in the increase of the framework molar Si/Al ratio of CuHY from 5.8 at 400 °C, to 6.1 at 450 °C and 6.7 at 500 °C. This reveals that calcination in SSIE process can lead to varying degrees of dealumination of the Y zeolite framework, which is also another reason for the decline of the amount of Brønsted acid sites and the increase of that of Lewis acid sites in addition to the introduction of Cu+ as charge compensating cation at the consumption of H+ which will be mentioned in Py-IR result.
Zeolite contains both Brønsted and Lewis acid sites and the amount and strength of different acid sites directly affect the alkylation performance. As is known, hydride transfer occurs on the strong Brønsted acid sites,51,52 while Lewis acid sites favor oligomerization reaction, which are unfavorable to the alkylation reaction.53 Furthermore, the accessibility of acid sites in zeolite also affects its alkylation performance. The six-membered ring openings (0.23 nm) of the hexagonal prism or sodalite cage of Y zeolite are too small for hydrocarbons to access. Only the supercages of Y zeolite with twelve-membered ring openings (0.74 nm) are the reaction sites of alkylation reaction. The acidity properties of HY and CuHY samples obtained from infrared spectroscopy with pyridine (0.5 nm) as the probe molecule are presented in Table 2 and the Py-IR spectra of the samples are shown in Fig. S2.†
| Samples | 200 °C (μmol g−1) | 350 °C (μmol g−1) | ||
|---|---|---|---|---|
| Brønsted | Lewis | Brønsted | Lewis | |
| HY | 442.3 | 170.5 | 247.3 | 129.7 |
| CuHY-1%-450 | 418.5 | 201.6 | 213.1 | 145.3 |
| CuHY-3%-450 | 352.3 | 258.4 | 184.9 | 157.6 |
| CuHY-2%-400 | 395.7 | 229.3 | 195.9 | 155.4 |
| CuHY-2%-450 | 385.6 | 232.8 | 194.7 | 156.2 |
| CuHY-2%-500 | 365.3 | 248.5 | 192.9 | 159.6 |
| HY–S | 406.8 | 191.4 | 223.7 | 134.7 |
Compared with HY with the amounts of total Brønsted and Lewis acid sites of 442.3 and 170.5 μmol g−1, respectively, CuHY samples have lower amount of Brønsted acid sites and higher amount of Lewis acid sites. With the increase of the addition amount of CuCl from 1 wt% to 3 wt%, the amounts of the total and strong Brønsted acid sites decrease from 418.5 and 213.1 μmol g−1 to 352.3 and 184.9 μmol g−1, respectively, and those of the total and strong Lewis acid sites increase from 201.6 and 145.3 μmol g−1 to 258.4 and 157.6 μmol g−1, respectively. Additionally, the calcination temperature also affects the amounts of Brønsted and Lewis acid sites. As the calcination temperature increases, the amounts of the total and strong Brønsted acid sites decrease and those of the total and strong Lewis acid sites increase.
The decreasing amount of Brønsted acid sites of CuHY sample indicates the loss of H+ cations, which is due to the release of HCl during the SSIE process, as has been verified by the TG-MS results (Fig. 1 and 2). With the increase of the addition amount of CuCl and the calcination temperature from 400 °C to 500 °C which is higher than the melting point of CuCl, the ion exchange degree is improved and the reaction of H+ cations with CuCl accelerates, resulting in the further consumption of H+ cations and the decrease of the amount of Brønsted acid sites. After the SSIE process, Cu+ introduced as charge compensating cation is a kind of Lewis acid sites.48 As the addition amount of CuCl and the calcination temperature increase, more Cu+ cations are introduced as charge compensation cations into HY zeolite, causing the increasing amount of Lewis acid sites. It is worthy to note that, when the calcination temperature is higher, combined with the increasing ion exchange degree of Cu+, the dealumination of the HY zeolite framework as the 29Si MAS NMR characterization result shown, leads to the more obvious increase of the amount of Lewis acid sites and decline of that of Brønsted acid sites in the resulted CuHY.
In addition, the acidity of the dealuminated HY-S was also analysed. Compared with HY zeolite, both the amounts of the total and strong Brønsted acid sites of the obtained HY–S sample decrease and those of Lewis acid sites increase, which indicating the dealumination of the zeolite framework during the hydrothermal treatment process. And, it can be seen that the acid amounts of HY–S are close to those of CuHY-1%-450.
In conclusion, during the SSIE process, the reaction between CuCl and HY zeolite occurs with the release of HCl gas, leaving the exchanged Cu+ as the charge compensation cation in Y zeolite. Meanwhile, flowing N2 is essential to keep the Cu species in the form of Cu+ which can adsorb olefins via π-complexation. However, the SSIE process results in the decline of the amount of Brønsted acid sites and increase of that of Lewis acid sites, which could be aggravated at higher calcination temperature due to dealumination of the HY zeolite.
3.3 Catalytic performance
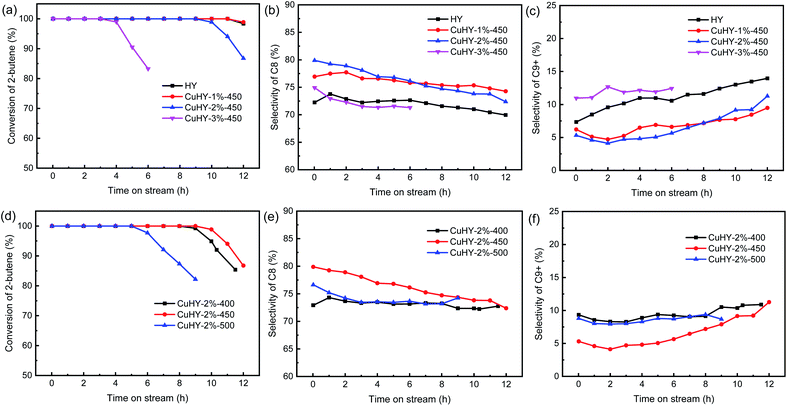
In isobutane/2-butene alkylation (as shown in Scheme S1†),10,54 firstly, 2-butene (2-C4![[double bond, length as m-dash]](https://www.rsc.org/images/entities/char_e001.gif) ) is protonated on the Brønsted acid site of zeolite to form sec-butyl carbocation (sec-C4+), then it reacts through two different paths: (1) undergoes hydride transfer reaction with isobutane (i-C4) or isomerization reaction to generate tert-butyl carbocation (t-C4+) which reacts with another 2-butene to form trimethylpentyl carbocation (TMP+); (2) directly reacts with another 2-butene to form dimethylhexyl carbocation (DMH+). The produced TMP+ and DMH+ undergo hydride transfer with isobutane molecules on the Brønsted acid sites of zeolite, and TMPs with higher octane number and dimethylhexanes (DMHs) with lower octane number, which are the two main components in isooctane (C8), are obtained. The ratio of TMPs to DMHs (TMPs/DMHs ratio) is often used to evaluate the quality of alkylate.55 Since the addition of 2-butene is faster than hydride transfer, the possibility of oligomerization of 2-butene and multiple alkylation is high, causing the formation of heavy byproducts (C9+) and the final deactivation of the catalyst.19,20 Cracking reaction leads to the formation of light byproducts (C5–C7). The alkylate distribution is affected by the relative rate of these individual steps. The lifetime of catalyst is defined as the time period from the initiation of reaction to the time at which the conversion of 2-butene decreased to 99.9%.
) is protonated on the Brønsted acid site of zeolite to form sec-butyl carbocation (sec-C4+), then it reacts through two different paths: (1) undergoes hydride transfer reaction with isobutane (i-C4) or isomerization reaction to generate tert-butyl carbocation (t-C4+) which reacts with another 2-butene to form trimethylpentyl carbocation (TMP+); (2) directly reacts with another 2-butene to form dimethylhexyl carbocation (DMH+). The produced TMP+ and DMH+ undergo hydride transfer with isobutane molecules on the Brønsted acid sites of zeolite, and TMPs with higher octane number and dimethylhexanes (DMHs) with lower octane number, which are the two main components in isooctane (C8), are obtained. The ratio of TMPs to DMHs (TMPs/DMHs ratio) is often used to evaluate the quality of alkylate.55 Since the addition of 2-butene is faster than hydride transfer, the possibility of oligomerization of 2-butene and multiple alkylation is high, causing the formation of heavy byproducts (C9+) and the final deactivation of the catalyst.19,20 Cracking reaction leads to the formation of light byproducts (C5–C7). The alkylate distribution is affected by the relative rate of these individual steps. The lifetime of catalyst is defined as the time period from the initiation of reaction to the time at which the conversion of 2-butene decreased to 99.9%.
As mentioned in Section 3.2, after the SSIE process, due to the ion-exchange of H+ by Cu+, the amount of strong Brønsted acid sites, which facilitate the hydride transfer reaction, decreases, and that of Lewis acid sites, which favor the oligomerization reaction, increases. According to the above results, it seems to be inferred that when CuHY zeolite is used in isobutane/2-butene alkylation, the processing capacity of catalyst per gram will be reduced and the oligomerization and multiple alkylation reactions will be accelerated. However, the results presented in Fig. 6a show that all the catalysts give the initial 2-butene conversion of 100% and the lifetime of CuHY-1%-450 is almost equal to that of HY (11 h). We consider that the competitive adsorption of olefins by Cu+ via π-complexation have reduced the concentration of 2-butene near the Brønsted acid sites,39 which can indirectly increase the local I/O ratio and inhibit the oligomerization of 2-butene and multiple alkylation reactions. In addition, the ion exchange degree of Cu+ in CuHY samples, which depends on the addition amount of CuCl and the calcination temperature in SSIE process, determines which is the dominant one in the above-mentioned two effects (aggravation or inhibition of oligomerization and multiple alkylation caused by the change of acidity or π-complexation of Cu+, respectively) that influence the alkylation performance of CuHY samples. When the addition amount of CuCl is as low as 1 wt%, the two effects on the lifetime are equivalent. However, when the addition amount of CuCl increases to 2 wt% or 3 wt%, the increase effect of the local I/O ratio caused by Cu+ is overwhelmed by the loss of Brønsted acid sites and the increase of Lewis acid sites. As a result, the lifetime of CuHY-2%-450 and CuHY-3%-450 shorten to 9 h and 3 h, respectively (Fig. 6a).
The selectivity of C8 over CuHY-1%-450 and CuHY-2%-450 are larger than that over HY with time on stream (Fig. 6b). The initial values over CuHY-1%-450 and CuHY-2%-450 increase by 4.7% and 7.7%, respectively, compared with that over HY (72.2%). However, as the addition amount of CuCl increases to 3 wt%, the selectivity of C8 decreases dramatically and becomes lower than that over HY after the first hour. The selectivity of C9+ changes in the opposite trend with the increasing addition amount of CuCl (Fig. 6c). This indicates that the increase effect of the local I/O ratio dominates when the addition amount of CuCl is relatively low (1–2 wt%), while as the addition amount of CuCl increases to 3 wt%, the great loss of Brønsted acid sites and the increase of Lewis acid sites under high ion exchange degree of Cu+ results in the dramatic drop of the selectivity of C8 over CuHY-3%-450.
Comparing the change of lifetime and the selectivity of C8 over CuHY with the addition amount of CuCl, it is found that lifetime is more sensitive to the loss of Brønsted acid sites which reduces the processing capacity of catalyst.
The lifetimes of the CuHY samples treated at different calcination temperatures are in the order CuHY-2%-450 (9 h) > CuHY-2%-400 (8 h) > CuHY-2%-500 (5 h) (Fig. 6d). When the calcination temperature is enhanced from 400 °C to 500 °C, the selectivity of C8 goes up firstly and then drops down, achieving the maximum value at 450 °C (Fig. 6e) and that of C9+ changes in the opposite trend (Fig. 6f). The longer lifetime of CuHY-2%-450 than that of CuHY-2%-400 is probably ascribed to the increase of the local I/O ratio caused by the improvement of the ion exchange degree of Cu+, which also leads to the increase of the selectivity of C8 and the decrease of the selectivity of C9+ when the calcination temperature is enhanced from 400 °C to 450 °C. However, when the calcination temperature further increases to 500 °C, the excess ion exchange of H+ by Cu+ and framework dealumination of Y zeolite at high temperature (as the 29Si MAS NMR result shown) leads to excess loss of Brønsted acid sites and increase of Lewis acid sites. This reduces the processing capacity of the catalyst per gram and aggravates oligomerization and multiple alkylation, hence results in the dramatically shorter lifetime of CuHY-2%-500 and lower selectivity of C8 compared with CuHY-2%-450.
As shown in Fig. 7a, the TMPs/DMHs ratio increases with the increasing addition amount of CuCl, and the initial value increases from 4.49 to 5.99 as the addition amount of CuCl increases from 1 wt% to 3 wt%, larger than that of HY (3.51). The TMPs/DMHs ratio also increases with the increasing calcination temperature (Fig. 7c). As mentioned above, the sec-butyl carbocation formed via protonation of 2-butene may convert to the more stable tert-butyl carbocation by hydride transfer with isobutane or isomerization reaction, and then these two types of butyl carbocations react with 2-butene to form DMH+ and TMP+, respectively. The increase of the local I/O ratio caused by introduction of Cu+ increases the isobutane concentration around the sec-butyl carbocation. This makes the sec-butyl carbocation more likely to undergo hydride transfer reaction with an isobutane molecule to produce TMP+ rather than to react with another 2-butene molecule to produce DMH+, hence gives rise to the increase of the TMPs/DMHs ratio. With the increasing addition amount of CuCl and calcination temperature, more Cu+ cations are introduced as charge compensating cations, leading to higher TMPs/DMHs ratio.
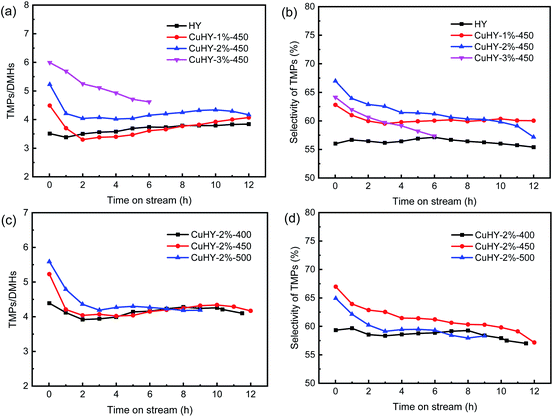 | ||
| Fig. 7 Alkylation performance of the catalysts. TMPs/DMHs ratio (a) and selectivity of TMPs (b) over HY and CuHY-x%-450; TMPs/DMHs ratio (c) and selectivity of TMPs (d) over CuHY-2%-y. | ||
The selectivity of TMPs is related to both the TMPs/DMHs ratio and the selectivity of C8. As shown in Fig. 7b and d, the selectivity of TMPs changes in a similar trend to that of C8 with the increasing addition amount of CuCl and calcination temperature. Although the TMPs/DMHs ratio over CuHY-3%-450 is high, its lower selectivity of C8 leads to the lower selectivity of TMPs compared with that over CuHY-2%-450, which is also the case for those over CuHY samples treated at 450 °C and 500 °C.
According to the above analyses, the CuHY sample with 1–2 wt% CuCl calcinated at 450 °C presents a higher selectivity of C8 and TMPs and a relatively longer lifetime, which could be attributed to the suitable ion exchange degree of Cu+.
In order to confirm if there is a loss of Cu in the catalyst after alkylation, the contents of Al and Cu elements in the CuHY-2%-450 before and after alkylation estimated by ICP-OES are shown in Table S1.† The molar Cu/Al ratios of the fresh and spent CuHY-2%-450 are nearly the same, with the value of 0.056 and 0.055, respectively, suggesting there is almost no loss of Cu in the catalyst after alkylation.
To exhibit the advantage of the SSIE products, the alkylation performance of the mechanical mixing sample (HY + 2% CuCl) is also investigated (Fig. 8). Similar with CuHY-2%-450, the lifetime of HY + 2% CuCl is also slight shorter than that of HY (Fig. 8a). Different from CuHY-2%-450, in HY + 2% CuCl, H+ can not be exchanged by Cu+ without calcination process. The faster deactivation of HY + 2% CuCl, compared with HY, is probably ascribed to the decline of the accessibility of active sites resulting from the pore blocking and coverage of part of the catalyst surface by the unevenly dispersed CuCl in the sample. And the uneven dispersion of CuCl also weakens the π-complexation effect of Cu+, resulting in the slight increase of the selectivity of C8 and TMPs compared with the calcinated sample CuHY-2%-450 (Fig. 8b and c).
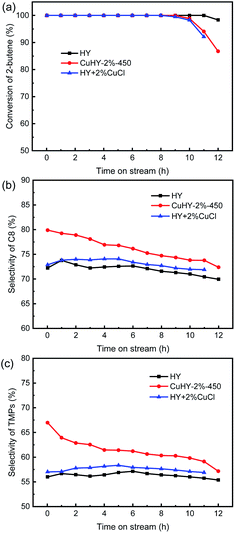 | ||
| Fig. 8 Alkylation performance of HY, CuHY-2%-450 and HY + 2% CuCl. Conversion of 2-butene (a), selectivity of C8 (b), selectivity of TMPs (c). | ||
In order to further demonstrate the advantage of Cu+, the alkylation performance the dealuminated sample HY–S with similar acid amounts of CuHY-1%-450 was also investigated. It seems that HY–S and CuHY-1%-450 may exhibit similar alkylation performance due to their similar acid amounts. However, the catalytic test shows different results (Fig. S3†). Although the acid amounts of HY–S and CuHY-1%-450 are similar, the lifetime of HY–S is 9 h, lower than HY (11 h) and CuHY-1%-450 (11 h) and the selectivity of C8 and TMPs over HY–S are obviously lower than those over CuHY-1%-450. Compared with the dealuminated sample HY–S, the longer lifetime and higher selectivity of C8 and TMPs over CuHY-1%-450 demonstrate the advantage of Cu+ due to its adsorption of 2-butene via π-complexation.
4 Conclusions
Cu+ was introduced into HY zeolite via SSIE method under the protection of N2. The reaction between CuCl and HY zeolite occurs along with the release of HCl gas, leaving the exchanged Cu+ as the charge compensation cation in Y zeolite. As the calcination temperature increases, solid CuCl transforms into molten state, accelerating the reaction rate. Both the addition amount of CuCl and the calcination temperature affect the ion exchange degree of Cu+ in the CuHY sample and further influence its catalytic performance in isobutane/2-butene alkylation. The introduction of Cu+ results in two opposite effects. On the one hand, Cu+ can compete with the Brønsted acid sites to adsorb 2-butene via π-complexation, which indirectly enhances the local I/O ratio around the Brønsted acid sites. Consequently, the oligomerization reaction of butene is inhibited and the hydride transfer reaction is accelerated, causing the enhancement of the selectivity of C8 and TMPs. On the other hand, with the introduction of Cu+, the amount of Brønsted acid sites in HY zeolite decreases and that of Lewis acid sites increases, which is further aggravated with the framework dealumination of Y zeolite at high calcination temperature. Considering both the two effects, CuHY catalyst treated at 450 °C with a lower addition amount of CuCl (1–2 wt%) shows enhanced selectivity of C8 and TMPs in alkylate with a relatively longer lifetime.Conflicts of interest
There are no conflicts of interest to declare.Acknowledgements
This work was financially supported by the National Natural Science Foundation of China (grants 22021004, 21890763).Notes and references
- H. Díaz Velázquez, N. Likhanova, N. Aljammal, F. Verpoort and R. Martínez-Palou, Energy Fuels, 2020, 34, 15525–15556 CrossRef.
- H. Zhang, H. Tang, J. Xu, Y. Li, Z. Yang, R. Liu, S. Zhang and Y. Wang, Fuel, 2018, 231, 224–233 CrossRef CAS.
- A. Feller, I. Zuazo, A. Guzman, J. O. Barth and J. A. Lercher, J. Catal., 2003, 216, 313–323 CrossRef CAS.
- L. F. Albright, Ind. Eng. Chem. Res., 2009, 48, 1409–1413 CrossRef CAS.
- Z. Liu, C. Xu and C. Huang, Invention Patent, US20040133056, 2004 Search PubMed.
- Z. Liu, Y. Zhang, C. Huang, J. Gao and C. Xu, Chin. J. Catal., 2004, 25, 693–696 CAS.
- Z. Liu, X. Meng, R. Zhang, C. Xu, H. Dong and Y. Hu, AlChE J., 2014, 60, 2244–2253 CrossRef CAS.
- T. Blasco, A. Corma, A. Martínez and P. Martínez-Escolano, J. Catal., 1998, 177, 306–313 CrossRef CAS.
- A. L. M. Salinas, D. Kong, Y. B. Tâarit and N. Essayem, Ind. Eng. Chem. Res., 2004, 43, 6355–6362 CrossRef CAS.
- A. Feller, A. Guzman, I. Zuazo and J. A. Lercher, J. Catal., 2004, 224, 80–93 CrossRef CAS.
- E. A. Vlasov, S. V. Myakin, M. M. Sychov, A. Aho, A. Y. Postnov, N. V. Mal’tseva, A. O. Dolgashev, S. O. Omarov and D. Y. Murzin, Catal. Lett., 2015, 145, 1651–1659 CrossRef CAS.
- B. O. D. Costa and C. A. Querini, Appl. Catal., A, 2010, 385, 144–152 CrossRef.
- A. L. M. Salinas, G. Sapaly, Y. B. Taarit, J. C. Vedrine and N. Essayem, Appl. Catal., A, 2008, 336, 61–71 CrossRef.
- A. Corma, A. Martinez and C. Martinez, Appl. Catal., A, 1996, 134, 169–182 CrossRef CAS.
- A. Corma, A. Martínez and C. Martínez, J. Catal., 1994, 146, 185–192 CrossRef CAS.
- S. Zhou, C. Zhang, Y. Li, B. Shao, Y. Luo and X. Shu, RSC Adv., 2020, 10, 29068–29076 RSC.
- S. Zhou, C. Zhang, Y. Li, Y. Luo and X. Shu, Ind. Eng. Chem. Res., 2020, 59, 5576–5582 CrossRef CAS.
- C. Sievers, I. Zuazo, A. Guzman, R. Olindo, H. Syska and J. A. Lercher, J. Catal., 2007, 246, 315–324 CrossRef CAS.
- A. Feller, J.-O. Barth, A. Guzman, I. Zuazo and J. A. Lercher, J. Catal., 2003, 220, 192–206 CrossRef CAS.
- T. Hamzehlouyan, M. Kazemeini and F. Khorasheh, Chem. Eng. Sci., 2010, 65, 645–650 CrossRef CAS.
- K. De Jong, C. Mesters, D. Peferoen, P. Van Brugge and C. De Groot, Chem. Eng. Sci., 1996, 51, 2053–2060 CrossRef CAS.
- K. Yoo, E. C. Burckle and P. G. Smirniotis, J. Catal., 2002, 211, 6–18 CrossRef CAS.
- F. Schüßler, S. Schallmoser, H. Shi, G. L. Haller, E. Ember and J. A. Lercher, ACS Catal., 2014, 4, 1743–1752 CrossRef.
- G. S. Nivarthy, Y. He, K. Seshan and J. A. Lercher, J. Catal., 1998, 176, 192–203 CrossRef CAS.
- R. J. Taylor and D. E. Sherwood, Appl. Catal., A, 1997, 155, 195–215 CrossRef CAS.
- A. Corma, V. Gómez and A. Martínez, Appl. Catal., A, 1994, 119, 83–96 CrossRef CAS.
- I. Kiricsi, C. Flego and G. Bellussi, Appl. Catal., A, 1995, 126, 401–410 CrossRef CAS.
- Z. Chen, F. Gao, K. Ren, Q. Wu, Y. Luo, H. Zhou, M. Zhang and Q. Xu, RSC Adv., 2018, 8, 3392–3398 RSC.
- A. Corma and A. Martínez, Catal. Rev.: Sci. Eng., 1993, 35, 483–570 CrossRef CAS.
- A. Feller and J. A. Lercher, Adv. Catal., 2004, 48, 229–295 CAS.
- T. Rørvik, H. Mostad, O. H. Ellestad and M. Stöcker, Appl. Catal., A, 1996, 137, 235–253 CrossRef.
- S. Ramachandran, T. G. Lenz, W. M. Skiff and A. K. Rappé, J. Phys. Chem., 1996, 100, 5898–5907 CrossRef CAS.
- A. Corma, M. Faraldos, A. Martínez and A. Mifsud, J. Catal., 1990, 122, 230–239 CrossRef CAS.
- W. Shen, Y. Gu, H. Xu, D. Dubé and S. Kaliaguine, Appl. Catal., A, 2010, 377, 1–8 CrossRef CAS.
- A. Takahashi, R. T. Yang, C. L. Munson and D. Chinn, Langmuir, 2001, 17, 8405–8413 CrossRef CAS.
- N. A. Khan and S. H. Jhung, J. Hazard. Mater., 2017, 325, 198–213 CrossRef CAS PubMed.
- A. Luna-Triguero, J. M. Vicent-Luna, P. Gómez-Álvarez and S. Calero, J. Phys. Chem. C, 2017, 121, 3126–3132 CrossRef CAS.
- J. Qin, Z. Wang, X. Liu, Y. Li and L. Sun, J. Mater. Chem. A, 2015, 3, 12247–12251 RSC.
- H. Zhang, J. Xu, H. Tang, Z. Yang, R. Liu and S. Zhang, Ind. Eng. Chem. Res., 2019, 58, 9690–9700 CrossRef CAS.
- K. Lázár, G. Pál-Borbély, H. K. Beyer and H. G. Karge, J. Chem. Soc., Faraday Trans., 1994, 90, 1329–1334 RSC.
- C. A. Emeis, J. Catal., 1993, 141, 347–354 CrossRef CAS.
- Z. Li, R. Wang, H. Zheng and K. Xie, Fuel, 2010, 89, 1339–1343 CrossRef CAS.
- Z. Li, K. Xie and R. C. T. Slade, Appl. Catal., A, 2001, 209, 107–115 CrossRef CAS.
- H. G. Karge, B. Wichterlová and H. K. Beyer, J. Chem. Soc., Faraday Trans., 1992, 88, 1345–1351 RSC.
- J. H. Lunsford, W. P. Rothwell and W. Shen, J. Am. Chem. Soc., 1985, 107, 1540–1547 CrossRef CAS.
- H. Klein, H. Fuess and M. Hunger, J. Chem. Soc., Faraday Trans., 1995, 91, 1813–1824 RSC.
- F. Schüßler, E. A. Pidko, R. Kolvenbach, C. Sievers, E. J. M. Hensen, R. A. van Santen and J. A. Lercher, J. Phys. Chem. C, 2011, 115, 21763–21776 CrossRef.
- Y. Zu, Z. Guo, J. Zheng, Y. Hui, S. Wang, Y. Qin, L. Zhang, H. Liu, X. Gao and L. Song, Chem. Eng. J., 2020, 380, 122319 CrossRef CAS.
- H. Xie, D. Yi, L. Shi and X. Meng, Chem. Eng. J., 2017, 313, 663–670 CrossRef CAS.
- C. A. Fyfe, Y. Feng, H. Grondey, G. T. Kokotailo and H. Gies, Chem. Rev., 1991, 91, 1525–1543 CrossRef CAS.
- M. Boronat, P. M. Viruela and A. Corma, J. Am. Chem. Soc., 2004, 126, 3300–3309 CrossRef CAS.
- A. Corma, A. Martinez and C. Martinez, Catal. Lett., 1994, 28, 187–201 CrossRef CAS.
- G. S. Nivarthy, K. Seshan and J. A. Lercher, Microporous Mesoporous Mater., 1998, 22, 379–388 CrossRef CAS.
- C. Liu, R. A. van Santen, A. Poursaeidesfahani, T. J. H. Vlugt, E. A. Pidko and E. J. M. Hensen, ACS Catal., 2017, 7, 8613–8627 CrossRef CAS PubMed.
- C. Sievers, J. S. Liebert, M. M. Stratmann, R. Olindo and J. A. Lercher, Appl. Catal., A, 2008, 336, 89–100 CrossRef CAS.
Footnote |
| † Electronic supplementary information (ESI) available. See DOI: 10.1039/d1ra03892c |
| This journal is © The Royal Society of Chemistry 2021 |

