 Open Access Article
Creative Commons Attribution 3.0 Unported Licence
Carbon nitride used as a reactive template to prepare mesoporous molybdenum sulfide and nitride†
Daria Ryaboshapka and
Pavel Afanasiev *
*
Univ. Lyon, Univ. Claude Bernard Lyon 1, CNRS, UMR5256, IRCELYON, F-69626, Villeurbanne, France. E-mail: pavel.afanasiev@ircelyon.univ-lyon1.fr
First published on 18th June 2021
Abstract
Carbon nitride C3N4 has been used as a sacrificial template to prepare inorganic materials with hierarchical pore structure. C3N4 impregnated with ammonium heptamolybdate was treated in reactive gas mixtures (H2S/H2 or NH3/H2). This approach allowed mesoporous molybdenum sulfide and molybdenum nitride materials to be obtained that replicate the morphology of the C3N4 template. Advantageous catalytic properties have been demonstrated in the thiophene hydrodesulfurization (HDS) and electrochemical hydrogen evolution reaction (HER). The highest rates in both reactions were observed for partially sulfidized Mo2N solid.
Introduction
Molybdenum is widely used in industrial catalytic processes such as hydrorefining,1–3 and currently studied as a promising alternative for highly expensive platinum group metals in processes for producing sustainable energy and reducing environmental pollution.4–6 Many recent works describe application of molybdenum sulphides or selenides, nitrides, carbides and phosphides (both supported and unsupported) in the reactions of hydrogen evolution,7–9 oxygen reduction,10,11 or carbon dioxide reduction.12 For both electrochemical and catalytic reactions porous materials with hierarchical systems of interconnected macropores and mesopores are preferable because such structure facilitates diffusion of the reactants. In order to synthesize mesoporous Mo sulfides and nitrides versatile techniques have been proposed such as topotactic transformations of oxides13,14 or of hybrid materials.15 One of the most popular techniques to control the textural properties is template-based synthesis strategy. To prepare molybdenum sulfide and nitride, templating with silica,16,17 polymers and MOFs18,19 or biotemplating20,21 have been applied. In the majority of templating methods the removal of template must be carried out at the final step, usually by etching. To avoid etching step the use of sacrificial templates is preferable. Carbon nitride has been first used as a sacrificial and reactive template by Antonietti and coll.22,23 Upon heating of mesoporous C3N4 impregnated with metal oxide species chemical reaction occurs that converts oxides to the corresponding nitrides (Al–Ga–N) and (Ti–V–N). Carbon nitride was also applied as a template to obtain N-doped carbon layers with increased porosity by means of thermal treatment at 900 °C.24,25 When a process using C3N4 as a template is carried out in the inert atmosphere, the temperatures as high as 800–900 °C are required to fully transform metal oxide species to nitrides. While suitable to prepare nanoparticles of refractory nitrides, such temperatures are prohibitive for obtaining highly divided materials, because of advanced sintering.In this work we demonstrate that in the reductive atmosphere carbon nitride can play a role of sacrificial reactive template at much lower temperatures. Moreover, the presence of a transition metal could further decrease the decomposition temperature of C3N4. This allows obtaining highly divided mesoporous materials, as demonstrated for the case study of MoS2 and Mo2N materials with hierarchical porosity and advantageous catalytic properties in HDS and HER reactions.
Experimental
Materials preparation
To prepare carbon nitride (C3N4), typically 30 g of urea was placed in a Pyrex tube, covered with a Pyrex cap and heated in static air for 2 h at 550 °C, with heating rate 10 °C min−1. Ammonium heptamolybdate (AHM) was supported onto carbon nitride by incipient wetness impregnation from aqueous solution (10% wt. AHM/C3N4). To carry out the treatments in reductive atmosphere, weighted amount of 10% wt. AHM/C3N4 (ca. 0.8 g) was placed in a Pyrex reactor and treated in a reactive gas mixture (NH3/H2 or H2S/H2) for 2 h at 550 °C with heating rate 5 °C min−1. The obtained samples are designated as Mo2N–CN and MoS2–CN, respectively. The solid obtained after heating of AHM/C3N4 in pure nitrogen flow was also characterized as a reference.Characterizations
Textural properties of the C3N4 template and Mo-containing samples were studied by N2 adsorption–desorption volumetry at −196 °C on a Micrometrics ASAP 2010 device. Pore distributions have been calculated using BJH equation. The samples were outgassed before the measurements at 400 °C for 2 h. Phase composition was studied by X-ray diffraction (XRD) on a Bruker D8 Advance A25 diffractometer with CuKα emission. The phases were identified by comparison with JCPDS standards database. Phase composition was quantified using Rietveld refinement as implemented in the Philips XPert software. CHONS analysis was performed on a Thermo Fisher Flash 2000 device. Transmission Electron Microscopy (TEM) images were obtained on a JEOL 2010 instrument at 200 KV. TEM images were analyzed using Digital Micrograph Gatan program package. Temperature-programmed reduction (TPR) was carried out in a quartz reactor. The samples (ca. 0.01 g) were linearly heated under a hydrogen flow (50 ml min−1) from room temperature to 1050 °C (heating rate 5 °C min−1). The gases evolved upon reduction were detected by means of Thermo Fischer quadrupole mass-spectrometer. Thermogravimetric analysis (TGA) was carried out on a SETARAM device. A weighted amount of sample powder (5–10 mg) was placed in an alumina crucible and heated in nitrogen flow from room temperature to 800 °C at a 10 °C min−1 rate (NB: cyan and HCN released upon TPR and TGA experiments are toxic and should be neutralized at the reactor outlet).Catalytic tests
The catalysts were tested in thiophene HDS right after their preparation: 40 mg of the sample was placed in a quartz reactor in continuous flow of H2 (50 ml min−1) passed through a bubbler with thiophene. HDS was studied at 320, 330, 340 °C, respectively. The products were analyzed by gas chromatography on an Agilent 7820A device.Electrochemical hydrogen evolution reaction (HER) was performed in a three electrode electrochemical cell in Ar-saturated 0.5 M H2SO4 electrolyte at room temperature. Glassy carbon rotating electrode was used as a working electrode, saturated calomel electrode as a reference electrode and graphite rod as a counter electrode. 10 mg of catalyst was suspended in 400 μl of Nafion (0.5%) and 800 μl of EtOH and treated by ultrasound. 10 μl of the obtained catalytic ink was spread on the working electrode and dried. Activity of the catalysts in HER was measured in the potential range from −800 mV to 100 mV. LSV curves were obtained at 5 mW s−1 rate. Tafel slopes were calculated via Tafel equation. Electrochemically active surface area (ECSA) was calculated from the non-faradaic parts of CV curves at sweep rates from 50 to 300 mV s−1.
Results and discussion
Reactivity of C3N4 vs. the nature of gas atmosphere and the presence of molybdenum
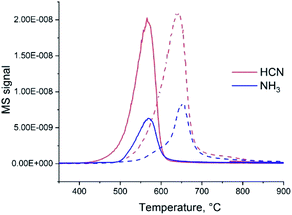
If heated under nitrogen flow, bare carbon nitride starts to decompose approximately at 600 °C and the decomposition completes at 780 °C (Fig. S1†). The mass loss is nearly 100% (the solid completely disappears from the crucible). These results are in good agreement with previous reports of the TGA of C3N4 carried out in nitrogen.26 As shown by mass spectrometry,27 gaseous CN and C2N2 species and N2 are formed during the decomposition of C3N4. Addition of ammonium heptamolybdate (AHM) by impregnation results in the decrease of C3N4 decomposition temperature by nearly 100 °C (Fig. S1†). This suggests a chemical reaction between AHM and C3N4 and probably a catalytic effect of formed Mo species on the decomposition. The mass loss is 92%; a solid residual was observed in the crucibles. Changing the gas flow from N2 to H2 leads to a further decrease of the onset temperature of decomposition (Fig. 1). For bare C3N4 it shifts to 500 °C and for the AHM/C3N4 sample it becomes approximately 450 °C. At the same time the nature of the released gases is modified: formation of NH3 and HCN occurs in hydrogen flow instead of cyan release previously observed in the inert atmosphere.Therefore, both addition of Mo species and applying hydrogen flow lead to a decrease of the C3N4 elimination temperature. Moreover, simultaneous application of H2 and addition of AHM provides a synergistic effect. Similar reaction onset temperature of 450 °C is observed for AHM/C3N4 sample in pure H2 (Fig. 1) and in the NH3/H2 mixture (Fig. S2†).
Properties of the solid products
We further collected the solid products of AHM/C3N4 reactions in different atmospheres (N2, NH3/H2 and H2S/H2) and analyzed their properties. The XRD patterns are shown in Fig. 2 and S3.† In the N2 atmosphere highly divided γ-Mo2N is formed at 650 °C (Fig. S3†), but it is polluted with MoO2 oxide (13% vol. according to Rietveld analysis). However, observing Mo2N as a major phase proves that C3N4 plays the role of nitrogen source and therefore acts as a reactive template. Using NH3/H2 and H2S/H2 flows allows obtaining at 550 °C almost pure phases of cubic γ-Mo2N and hexagonal 2H–MoS2 (Fig. 2), respectively (and small impurity of MoO2, 2–4% vol).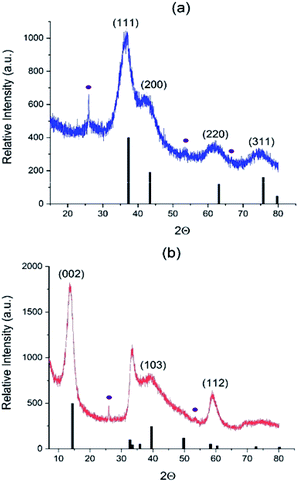 | ||
| Fig. 2 Diffractograms of (a) Mo2N–CN (b) MoS2–CN. Black bars correspond to (a) Mo2N phase (00-025-1366) and (b) 2H–MoS2 phase (03-065-0160); violet circles correspond to MoO2 impurity (01-078-1070). | ||
In agreement with XRD, chemical analysis shows the S and N content values close to the theory values for the Mo sulfide and nitride, respectively (Table 1). Carbon is almost completely removed from the MoS2–CN sample, but is still present in the Mo2N–CN (probably as amorphous matter not detected by XRD). Small amount of oxygen in both samples is probably due to partial surface oxidation and due to a contribution from minor MoO2 impurity.
| Element, wt% sample | N | C | H | S | O |
|---|---|---|---|---|---|
| C3N4 | 62.1 | 35.3 | 1.55 | 0 | 0.91 |
| Mo2N–CN | 6.6 | 8.4 | 0.72 | 0 | 2.09 |
| MoS2–CN | 1.7 | 0.43 | 0.25 | 29.0 | 3.9 |
Therefore, the use of the reactive gas mixtures (NH3/H2 or H2S/H2) allowed us to obtain at 550 °C the materials containing molybdenum nitride or sulfide as major components. We further studied the morphology and the catalytic properties of these materials.
The C3N4 template has the specific surface area (SBET) 157 m2 g−1 and pore volume 0.87 cm3 g−1 (Table 2). The isotherm shape corresponds to type II (IUPAC classification) which is characteristic of the macroporous materials (Fig. 3a). Pore size distribution is broad and has a polymodal shape (Fig. 3b), the pores with diameters between 30 and 50 nm being the most abundant ones. The amount of micropores is rather low; the narrow peak at pore radius ca. 2 nm is an artifact caused by cavitation-induced evaporation (Fig. 3b).
| Sample | SBET, m2 g−1 | Pore volume, BJH, cm3 g−1 |
|---|---|---|
| Bare C3N4 | 157 | 0.87 |
| Mo2N–CN | 96 | 0.32 |
| MoS2–CN | 64 | 0.31 |
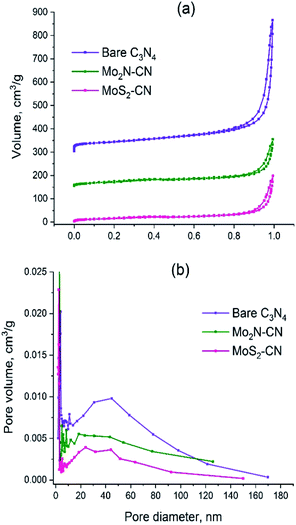 | ||
| Fig. 3 (a) N2 adsorption–desorption isotherms for C3N4, Mo2N–CN and MoS2–CN; (b) BJH pore distributions for C3N4, Mo2N–CN, MoS2–CN. | ||
The isotherms of Mo2N–CN and MoS2–CN have similar shape to that of the parent C3N4 material, but the pore volumes and the specific surface areas are smaller, obviously because of higher density of the corresponding molybdenum compounds (Table 2). Comparison of isotherms and BJH pore size distributions suggests that Mo2N–CN and MoS2–CN replicate the main features of the pore structure of C3N4 template and possess hierarchical mesoporosity. This is an important finding since mesoporous materials of this type are highly demanded and not readily available. Indeed, both Mo2N and MoS2 obtained by conventional solid–gas reaction techniques are microporous. Bulk Mo2N prepared via widely used Volpe and Boudart TPR method possesses high specific surface area (around 200 m2 g−1), but pore size smaller than 30 Å, fully lying in the microporosity range.28,29 Similarly, MoS2 synthesized by conventional techniques such as ammonium thiomolybdate (ATM) decomposition possesses low pore volume and considerable microporosity.30
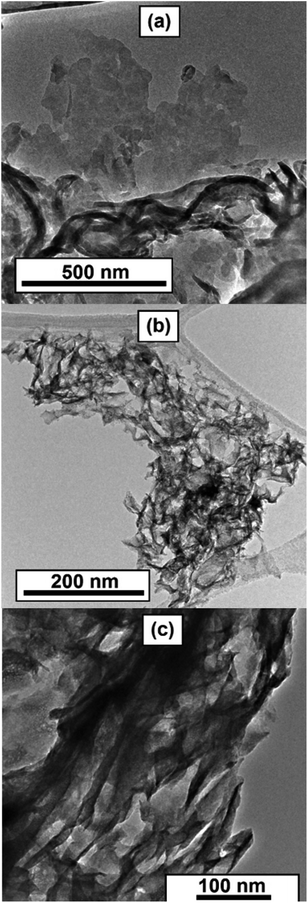
Transmission electron microscopy (TEM) study corroborates the results of other characterizations and provides additional insights into the morphology of the solids. Low-magnification TEM reveals lamellar morphology of the C3N4 template (Fig. 4a and S5†). The layers of carbon nitride are randomly bent, having a rag-like aspect. The morphology of the reaction products Mo2N–CN and MoS2–CN bears a significant similarity to the parent template. Lamellar morphology and open porosity with convex macropores were observed (Fig. 4b and c; see also video in the ESI†).
At higher magnifications stacked layers of MoS2 become visible in the MoS2–CN sample (Fig. 5b) and several nm-size Mo2N particles were observed in the Mo2N–CN solid (Fig. 5a).
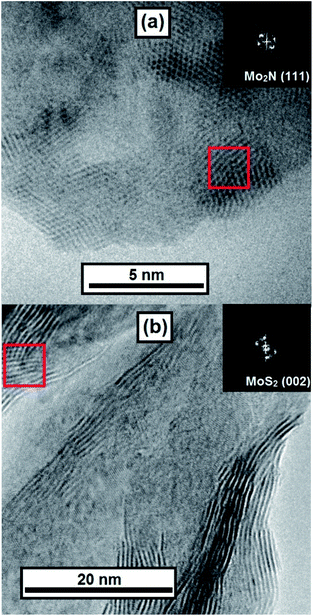 | ||
| Fig. 5 TEM images of (a) Mo2N–CN and (b) MoS2–CN; insets – digital diffraction for zones marked by red squares. | ||
Interplanar distances 0.205 nm and 0.242 nm correspond respectively to the (2 0 0) and (1 1 1) planes of γ-Mo2N. In the MoS2–CN sample the measured interplanar distance is 0.67 nm, corresponding to the theory value for (0 0 2) plane of MoS2 (0.62 nm) and to the measured XRD peak position (0.65 nm). Note that because of the slabs bending and stacking defects, the measured interplane distance in the nanoscopic MoS2 samples is often greater than in the bulk molybdenite.31
Overall, the obtained mesoporous Mo2N and MoS2 materials replicate the hierarchical porous structure and lamellar morphology of the template. Mo2N–CN and MoS2–CN were further tested in the model reactions of gas-phase thiophene HDS and liquid-phase HER.
Catalytic properties
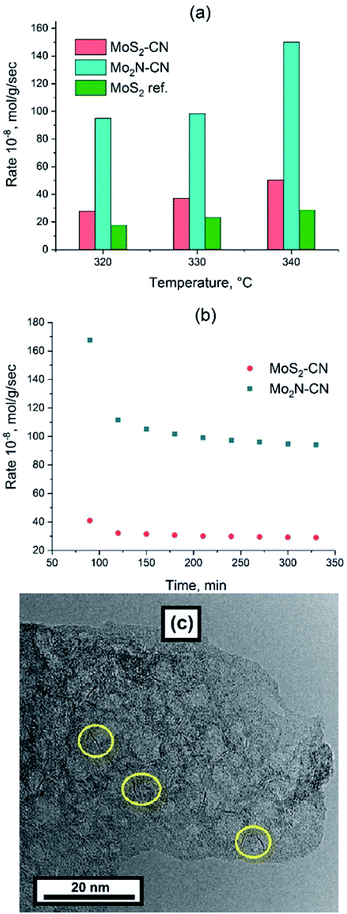
Thiophene HDS rates are shown in Fig. 6 in comparison with the benchmark ATM–MoS2 reference. The Mo2N–CN sample demonstrates one of the highest HDS activities reported for the non-promoted Mo catalysts, being at least five times more active than the ATM–MoS2 bulk reference and also much more active than bulk MoS2 solids from our previous works that were tested in the HDS reaction under the same conditions.32 (Fig. 6a).The evolution of HDS activity versus time was significantly different for sulfide and nitride samples. At 320 °C the nitride catalyst loses 50% of its activity during the first hour on-stream, whereas MoS2–CN sulfide was deactivated much less (Fig. 6b). The Mo2N–CN solid after the HDS test preserved opened porous morphology (Fig. 6c). However, at high resolution short (1–3 nm) MoS2 single slabs were observed. Therefore, partial sulfidation of molybdenum nitride occurred at the surface of pores. Steady state HDS activity can be attributed to these slabs, very short due to confinement in the pores of Mo2N matrix. In agreement with our findings, it was reported earlier that the initial thiophene HDS activity of γ-Mo2N/Al2O3 is high, but during the reaction rapid sulfidation of the surface occurs and the steady state activity is defined by the MoS2 slabs formed on the surface.33
Formation of MoS2 occurs via sulfidation of the passivating surface oxide layer rather than a direct nitride-to-sulfide transformation.34 Exceptionally high apparent HDS rate during the initial period might be due to high intrinsic activity of Mo2N, but might be also related to the sulfur uptake by nitride.
The MoS2–CN sample demonstrates lower HDS activity than the Mo2N–CN one, but still higher than the ATM–MoS2 reference (Fig. 6a). Indeed, on the TEM images of MoS2–CN, extended (>5 nm) and stacked layers of MoS2 are mostly present (Fig. 5b). Lower dispersion of MoS2 slabs and therefore lower amount of the active edge structures explains its lesser activity in comparison with Mo2N–CN. The selectivity distributions of HDS products are similar to those observed earlier for the non-promoted Mo sulfide catalysts (Fig. S6†).30,32 Beside C4 HDS products, small amounts of methane were detected. Production of methane might be due to partial surface oxidation of Mo2N and MoS2 with formation of Mo oxide species that possess acidic sites, able to perform cracking.
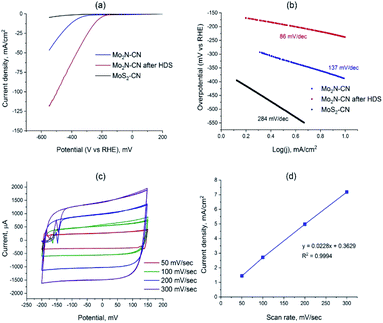
To access the potential of electrochemical applications, Mo2N–CN (fresh and after HDS test) and MoS2–CN were tested in the electrochemical HER in 0.5 M H2SO4. The MoS2–CN material demonstrates poor HER activity, in accordance with its moderate HDS catalytic performance (Fig. 7a). Low activity of bulk 2H–MoS2 was previously reported in the literature.35 The Mo2N based samples demonstrate good activity, the sample taken after HDS being more active than the initial nitride. The overpotential for Mo2N–CN after HDS at 10 mA cm−2 is much lower (239 mV) than that of the initial nitride sample (390 mV) (Fig. 7a). The calculated Tafel slopes for three tested samples are 86 mV dec−1 for Mo2N–CN after HDS, 137 mV dec−1 for Mo2N–CN and only 284 mV dec−1 for MoS2–CN (Fig. 7b). The obtained values of Tafel slopes for Mo2N based catalysts indicate that HER reaction follows Volmer–Heyrovsky mechanism. For the sample Mo2N–CN collected after HDS test, that shows the highest HER performance, the electrochemical surface area (ECSA) calculated from the non-faradaic CV at different scan rates is 136 m2 g−1 (Fig. 7c and d). This value is close to the BET surface area and attests good availability of the surface for the electrochemical reaction.
The superior HER catalytic performance of the Mo2N–CN sample after HDS text might be associated with high activity of short MoS2 slabs on the surface of Mo2N, formed during the HDS reaction due to sulfidation of the catalyst surface by the released H2S. Oppositely to the metallic Mo2N, 2H–MoS2 is a semiconductor, so it possesses relatively low electric conductivity36 and, therefore, lower activity in HER, whereas the active sites for these two materials are similar (MoS2 slabs edges). It appears that mesoporous Mo2N decorated with MoS2 fringes provides optimal structure for an efficient HER catalyst. Thus in ref. 37 it was suggested that if MoS2 edges are in a tight contact with the surface of Mo2N, then the electronic structure of Mo sites located at the interface could be tuned, boosting HER catalytic performance. Recently, in the same lines, for chemically similar W sulfide it was shown that metallic W particles surrounded with WS2 show high HER activity.38 The interface between MoS2 n-type semiconductor, and Mo2N would create ohmic or Schottky contact, depending on the difference between the work functions of two materials. For the similar Mo–MoS2 contact, low Schottky barrier was observed that potentially provides easy charge injection from current collector to the catalyst sites.39 For the Mo2N–MoS2 interface, both experiment and DFT analysis show that an electric field is created at the interface between Mo2N and MoS2 that facilitates charge transfer.40
Conclusions
Mesoporous MoS2 and Mo2N materials replicating the hierarchical mesoporous morphology of C3N4 were prepared using a simple topotactic solid–gas reaction. Due to the advantageous morphology these solids are well adopted for the applications in the heterogeneous catalysis and in the electrocatalysis. The most active catalyst in both HDS and HER reactions is mesoporous molybdenum nitride decorated at the surface by small MoS2 fringes. The HDS performance of this sample is one of the highest ever reported for the non-promoted Mo systems.Due to application of the reactive gases, our synthetic approach extends the potential use of C3N4 as a template towards considerably lower temperatures and to the materials other than nitrides. The advantage of this method is its utter simplicity. Indeed, carbon nitride support is impregnated with ammonium heptamolybdate according to the standard procedure, commonly applied for the preparation of heterogeneous catalysts. Further activation with H2S/H2 or NH3/H2 is also carried out by following the standard procedures that are used to prepare sulfide and nitride catalysts. Unlike in many other template-based techniques there is no template leaching steps. Obviously, mesoporous sulfides and nitrides of other metals (such as V, W, Cr) and their combinations could be prepared using this approach under relatively soft conditions. By the same token, preparation of mesoporous phosphides or borides could be considered, by means of the reductive treatment of phosphates or borates supported on C3N4. Beside catalysis, other applications could be considered in the fields where materials with open porosity are demanded, such as pseudo capacitors, electrodes or sensors.
Author contributions
DR: writing, materials preparation, catalytic tests, PA: conceptualising, materials characterizations, writing.Conflicts of interest
There are no conflicts to declare.Acknowledgements
We thank Yoann Aizac for performing XRD measurements and Mimoun Aouine for assistance with TEM.References
- H. Topsøe, B. S. Clausen and F. E. Massoth, Hydrotreating Catalysis, Catalysis: Science and Technology, Springer, Berlin, Heidelberg, 1996 Search PubMed.
- R. R. Chianelli, Catal. Rev., 1984, 26, 361–393 CrossRef CAS.
- E. J. M. Hensen, P. J. Kooyman, Y. van der Meer, A. M. van der Kraan, V. H. J. de Beer, J. A. R. van Veen and R. A. van Santen, J. Catal., 2001, 199, 224–235 CrossRef CAS.
- C. G. Morales-Guio, L.-A. Stern and X. Hu, Chem. Soc. Rev., 2014, 43, 6555 RSC.
- S. Zaman and K. J. Smith, Catal. Rev., 2012, 54, 41–132 CrossRef CAS.
- M. Führer, T. van Haasterecht and J. H. Bitter, Catal. Sci. Technol., 2020, 10, 6089–6097 RSC.
- Z. Liang, Y. Xue, X. Wang, Y. Zhou, X. Zhang, H. Cui, G. Cheng and J. Tian, Chem. Eng. J., 2021, 421, 130016 CrossRef.
- Z. Liang, X. Meng, Y. Xue, X. Chen, Y. Zhou, X. Zhang, H. Cui and J. Tian, J. Colloid Interface Sci., 2021, 598, 172–180 CrossRef CAS PubMed.
- P. Xiao, M. A. Sk, L. Thia, X. Ge, R. J. Lim, J.-Y. Wang, K. H. Lim and X. Wang, Energy Environ. Sci., 2014, 7, 2624–2629 RSC.
- B. Cao, J. C. Neuefeind, R. R. Adzic and P. G. Khalifah, Inorg. Chem., 2015, 54, 2128–2136 CrossRef CAS PubMed.
- A. Arunchander, S. G. Peera and A. K. Sahu, J. Power Sources, 2017, 353, 104–114 CrossRef CAS.
- M. Asadi, B. Kumar, A. Behranginia, B. A. Rosen, A. Baskin, N. Repnin, D. Pisasale, P. Phillips, W. Zhu, R. Haasch, R. F. Klie, P. Král, J. Abiade and A. Salehi-Khojin, Nat. Commun., 2014, 5, 4470 CrossRef CAS PubMed.
- C. Oumahi and P. Afanasiev, J. Alloys Compd., 2018, 768, 824–829 CrossRef CAS.
- P. Afanasiev, Catal. Today, 2015, 250, 134–144 CrossRef CAS.
- P. Qin, D. Yi and J. Hao, Adv. Powder Technol., 2021, 32, 1594–1601 CrossRef CAS.
- L. Jing, G. Lian, S. Han, J. Sun, C. Sun, Q. Wang, H. Jiang and D. Cui, J. Alloys Compd., 2019, 801, 367–374 CrossRef CAS.
- L. Su, L. Luo, J. Wang, T. Song, W. Tu and Z. Wang, Catal. Sci. Technol., 2021, 11, 1292–1297 RSC.
- J. Dai, J. Li, Q. Zhang, M. Liao, T. Duan and W. Yao, Mater. Lett., 2019, 236, 483–486 CrossRef CAS.
- S. Wang, C. An and J. Yuan, Materials, 2010, 3, 401–433 CrossRef CAS.
- P. Afanasiev, C. Geantet, I. Llorens and O. Proux, J. Mater. Chem., 2012, 22, 9731–9737 RSC.
- G. Zhao, Y. Cheng, P. Sun, W. Ma, S. Hao, X. Wang, X. Xu, Q. Xu and M. Liu, Electrochim. Acta, 2020, 331, 135262 CrossRef CAS.
- A. Fischer, M. Antonietti and A. Thomas, Adv. Mater., 2007, 19, 264–267 CrossRef CAS.
- A. Fischer, J. O. Müller, M. Antonietti and A. Thomas, ACS Nano, 2008, 2, 2489–2496 CrossRef CAS PubMed.
- F. Pan, B. Li, W. Deng, Z. Du, Y. Gang, G. Wang and Y. Li, Appl. Catal., B, 2019, 252, 240–249 CrossRef CAS.
- Q. Li, X. Tian, W. Yang, L. Hou, Y. Li, B. Jiang, X. Wang and Y. Li, Appl. Surf. Sci., 2020, 530, 147298 CrossRef CAS.
- Y. Cao, Z. Zhang, J. Long, J. Liang, H. Lin, H. Lin and X. Wang, J. Mater. Chem. A, 2014, 2, 17797–17807 RSC.
- M. Elshafie, S. A. Younis, P. Serp and E. A. M. Gad, Egypt. J. Pet., 2020, 29, 21–29 CrossRef.
- L. Volpe and M. Boudart, J. Solid State Chem., 1985, 59, 332–347 CrossRef CAS.
- G. Ranhotra, J. Catal., 1987, 108, 24–39 CrossRef CAS.
- P. Afanasiev, J. Catal., 2010, 269, 269–280 CrossRef CAS.
- H. Liu, D. Su, R. Zhou, B. Sun, G. Wang and S. Z. Qiao, Adv. Energy Mater., 2012, 1–6 CrossRef.
- P. Afanasiev, Appl. Catal., B, 2018, 227, 44–53 CrossRef CAS.
- Z. Wu, C. Li, Z. Wei, P. Ying and Q. Xin, J. Phys. Chem. B, 2002, 106, 979–987 CrossRef CAS.
- Z. B. Z. Wei, P. Grange and B. Delmon, Appl. Surf. Sci., 1998, 135, 107–114 CrossRef CAS.
- H. Tributsch and J. C. Bennett, J. Electroanal. Chem. Interfacial Electrochem., 1977, 81, 97–111 CrossRef CAS.
- T. Okamoto, T. Shimizu, K. Takase, T. Ito and S. Shingubara, Micro Nano Eng., 2020, 9, 100071 CrossRef.
- K. Ojha, S. Saha, S. Banerjee and A. K. Ganguli, ACS Appl. Mater. Interfaces, 2017, 9, 19455–19461 CrossRef CAS PubMed.
- L. Ji, H. Cao, W. Xing, S. Liu, Q. Deng and S. Shen, J. Mater. Chem. A, 2021, 9, 9272–9280 RSC.
- J. Kwon, C. J. Delker, D. B. Janes, C. T. Harris and S. R. Das, Phys. Status Solidi A, 2020, 217, 1900880 CrossRef CAS.
- S. Yang, Y. Zhang, S. Wang, J. Shi, X. Liu and L. Li, J. Mater. Chem. A, 2019, 7, 23886–23894 RSC.
Footnote |
| † Electronic supplementary information (ESI) available: Additional TEM images, XRD patterns, ATG curves. See DOI: 10.1039/d1ra03657b |
| This journal is © The Royal Society of Chemistry 2021 |

