
 Open Access Article
 This Open Access Article is licensed under a Creative Commons Attribution-Non Commercial 3.0 Unported Licence
Anticancer activity of pyrimidodiazepines based on 2-chloro-4-anilinoquinazoline: synthesis, DNA binding and molecular docking†
Viviana Cuartas ab,
Alberto Aragón-Murielc,
Yamil Liscanod,
Dorian Polo-Cerónc,
Maria del Pilar Crespo-Ortize,
Jairo Quirogaa,
Rodrigo Aboniaa and
Braulio Insuasty*ab
ab,
Alberto Aragón-Murielc,
Yamil Liscanod,
Dorian Polo-Cerónc,
Maria del Pilar Crespo-Ortize,
Jairo Quirogaa,
Rodrigo Aboniaa and
Braulio Insuasty*ab
aHeterocyclic Compounds Research Group, Department of Chemistry, Universidad del Valle, A.A. 25360 Cali, Colombia. E-mail: braulio.insuasty@correounivalle.edu.co; Fax: +57-2339-3248; Tel: +57-315-484-6665
bCenter for Bioinformatics and Photonics-CIBioFI, A.A. 25360 Cali, Colombia
cLaboratorio de Investigación en Catálisis y Procesos (LICAP), Departamento de Química, Universidad del Valle, Cali 760001, Colombia
dGrupo de Investigación en Química y Biotecnología (QUIBIO), Universidad Santiago de Cali, Cali 760035, Colombia
eGrupo de Biotecnología e Infecciones Bacterianas, Departamento de Microbiología, Universidad del Valle, Cali 760043, Colombia
First published on 1st July 2021
Abstract
Multidrug resistance to chemotherapy is a critical health problem associated with mutation of the therapeutic target. Therefore, the development of anticancer agents remains a challenge to overcome cancer cell resistance. Herein, a new series of quinazoline-based pyrimidodiazepines 16a–g were synthesized by the cyclocondensation reaction of 2-chloro-4-anilinoquinazoline-chalcones 14a–g with 2,4,5,6-tetraaminopyrimidine. All quinazoline derivatives 14a–g and 16a–g were selected by the U.S. National Cancer Institute (NCI) for testing their anticancer activity against 60 cancer cell lines of different panels of human tumors. Among the tested compounds, quinazoline-chalcone 14g displayed high antiproliferative activity with GI50 values between 0.622–1.81 μM against K-562 (leukemia), RPMI-8226 (leukemia), HCT-116 (colon cancer) LOX IMVI (melanoma), and MCF7 (breast cancer) cancer cell lines. Additionally, the pyrimidodiazepines 16a and 16c exhibited high cytostatic (TGI) and cytotoxic activity (LC50), where 16c showed high cytotoxic activity, which was 10.0-fold higher than the standard anticancer agent adriamycin/doxorubicin against ten cancer cell lines. COMPARE analysis revealed that 16c may possess a mechanism of action through DNA binding that is similar to that of CCNU (lomustine). DNA binding studies indicated that 14g and 16c interact with the calf thymus DNA by intercalation and groove binding, respectively. Compounds 14g, 16c and 16a displayed strong binding affinities to DNA, EGFR and VEGFR-2 receptors. None of the active compounds showed cytotoxicity against human red blood cells.
1. Introduction
Cancer is a life-threatening disease and the second cause of death globally,1,2 accounting for 9.6 million deaths in 2018,3 according to the World Health Organization (WHO), with lung, prostate, colorectal, stomach, liver, breast, cervical, and thyroid being the most common types of cancer.3 Therefore, the development of anticancer agents remains an important field of research to find alternatives to the chemotherapy toxicities and to overcome the intrinsic cancer cell resistance.4 Traditional chemotherapy affects the main signaling pathways, cell proliferation, survival, migration, adhesion, differentiation, and overexpression in several solid tumors,1,5 with the epidermal growth factor receptor (EGFR) being one of the most used therapeutic targets to block progression of different types of malignant tumors,1 including lung, breast, esophageal, colon, pancreatic and prostate cancer.6 The first-generation of EGFR tyrosine kinase inhibitors (TKIs) agents gefitinib and erlotinib (Fig. 1) rapidly shrink tumor size in the treatment of non-small cell lung cancer (NSCLC),6,7 as well as, lapatinib is recognized as a dual EGFR and HER2 (human epidermal growth factor receptor 2) inhibitor, approved for metastatic breast cancer.5 These tyrosine kinase inhibitors (gefitinib, erlotinib, and lapatinib) are reversible competitors against the binding site of the EGFR, and they have been used with some clinical success.7 However, the patients develop acquired resistance to gefitinib and erlotinib within 10–16 months of treatment.7 On the other hand, the second-generation EGFR inhibitors (such as afatinib, canertinib, dacomitinib, Fig. 1) have been developed as irreversible inhibitors against Cys797,5,8 allowing to overcome EGFR-TK mutation-related resistance in clinical trials. Nevertheless, these chemotherapeutic agents have a limited therapeutic window,5,7 so the acquired resistance remains a major clinical problem.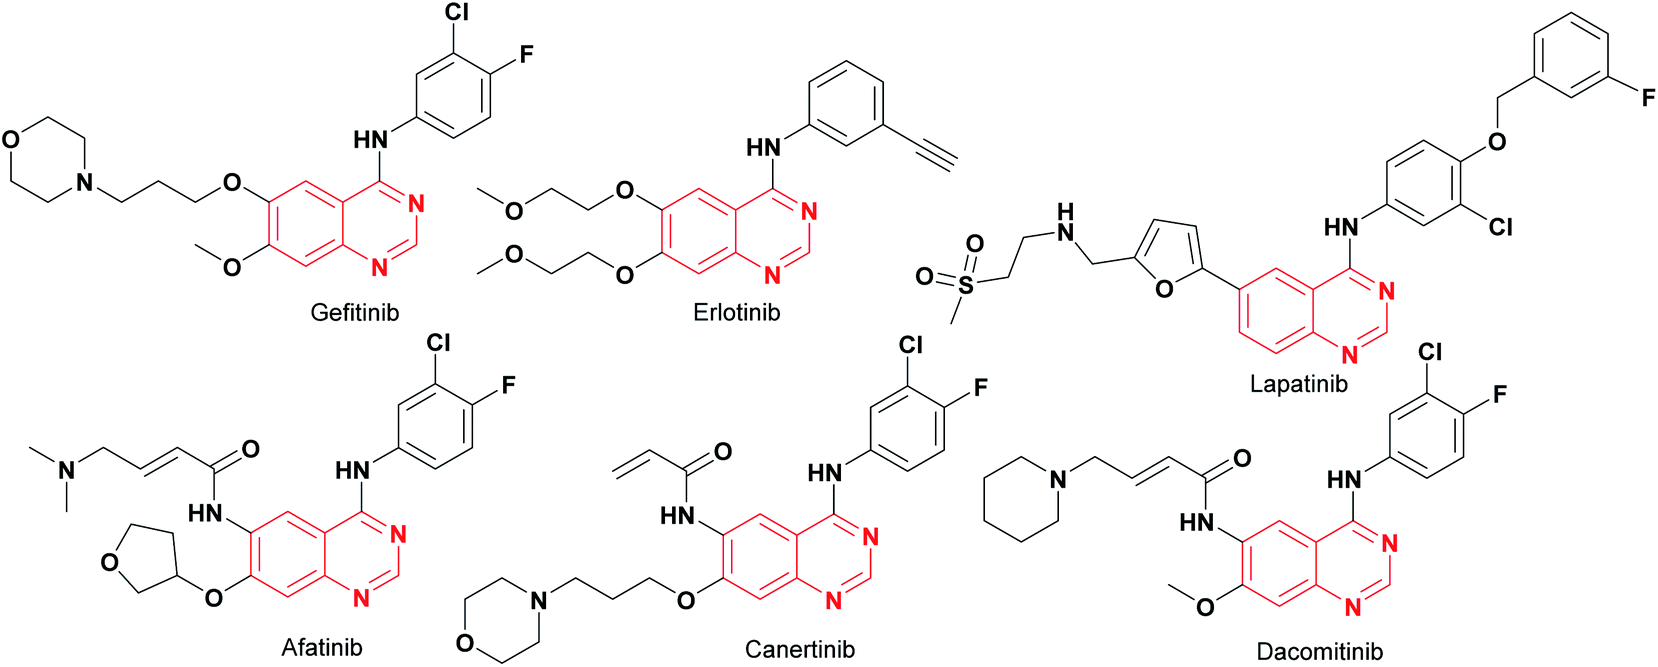 | ||
| Fig. 1 The first- and second-generation EGFR-TKIs agents. | ||
Recently, computational approaches and rational strategies have allowed the design of ligands directed toward multiple therapeutic targets as an alternative to traditional pharmacological therapy.9 Although, the main target of 4-anilinoquinazolines is the EGFR,1,10,11 some derivatives also target several kinases due to the similarities of their binding pockets6 such as B-Raf, phosphoinositide 3-kinase (PI3K), HER2 and, vascular endothelial growth factor (VEGFR-2), as well as the dual inhibitors afatinib (EGFR/HER2), lapatinib (EGFR/HER2) and vandetanib (EGFR/VEGFR-2).10 Among recently reported examples, 2-chloro-4-anilinoquinazolines with heterocyclylsulfonamido moiety have shown antitumor activity (1–2, Fig. 2), highlighting compound 2, which displayed an IC50 value of 0.13 nM against MCF-7 human breast carcinoma cell line.12 Barbosa, M. et al.13 designed and synthesized a novel 2-chloro-quinazoline as EGFR and VEGFR-2 dual inhibitor (3, Fig. 2), which was approximately 11- and 7-fold more potent on EGFR and VEGFR-2 compared to prototype 2. In both series including a functional group as hydrogen bond acceptor for binding to the therapeutic target similar to sorafenib and tivozanib (Fig. 2), which form hydrogen bonding interactions between urea fragment with the amino acids Glu855 and Asp1046 in VEGFR-2.6,11,13 In Fig. 2, dual EGFR and VEGFR-2 inhibitors containing the 2-chloro-quinazoline core are shown.9
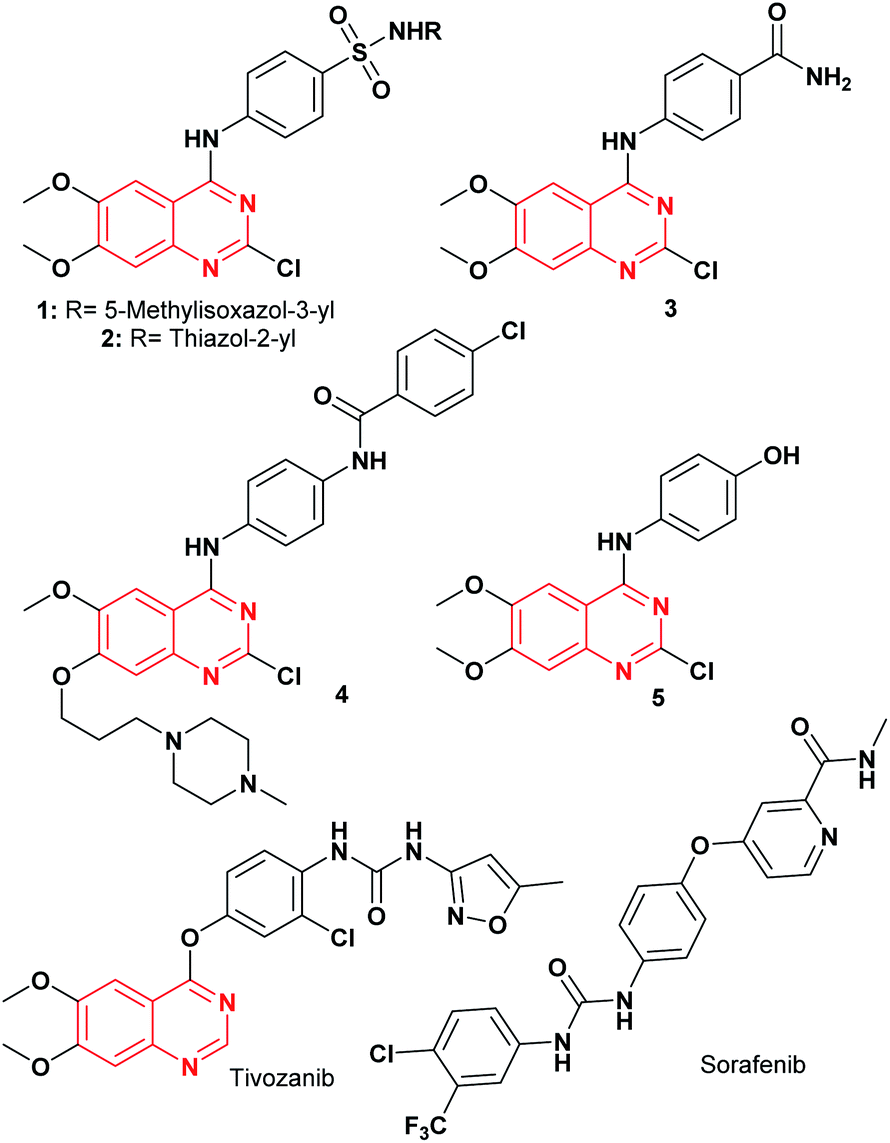 | ||
| Fig. 2 EGFR and VEGFR-2 tyrosine kinase inhibitors. | ||
Although, quinazoline derivatives have exhibited high affinity and selectivity as tyrosine kinase inhibitors (TKIs), those compounds can interact with double-stranded DNA due to their planar conjugated system through intercalation and groove binding to DNA14 with recognition mainly for GC-rich sequences.15 These types of interactions lead to cell death by disrupting replication and transcription.14 Therefore, quinazolines represent an important scaffold to the development of DNA-targeted anticancer agents.14,16
Pyrimidodiazepines are an important bicyclic system due to their biological activities,17,18 being a very interesting scaffold in medicinal chemistry, which has been incorporated into many drugs as antitumor19 and antiviral agents,20,21 given its ability to mimic the nitrogenous bases of nucleic acids.17,20 Furthermore, pyrimidodiazepines have shown important activity as Aurora A/B,22 EGFR,23 and c-Met kinase19 inhibitors. Fig. 3 shows some structures of pyrimidodiazepines with significant antitumor activity.19,22,24
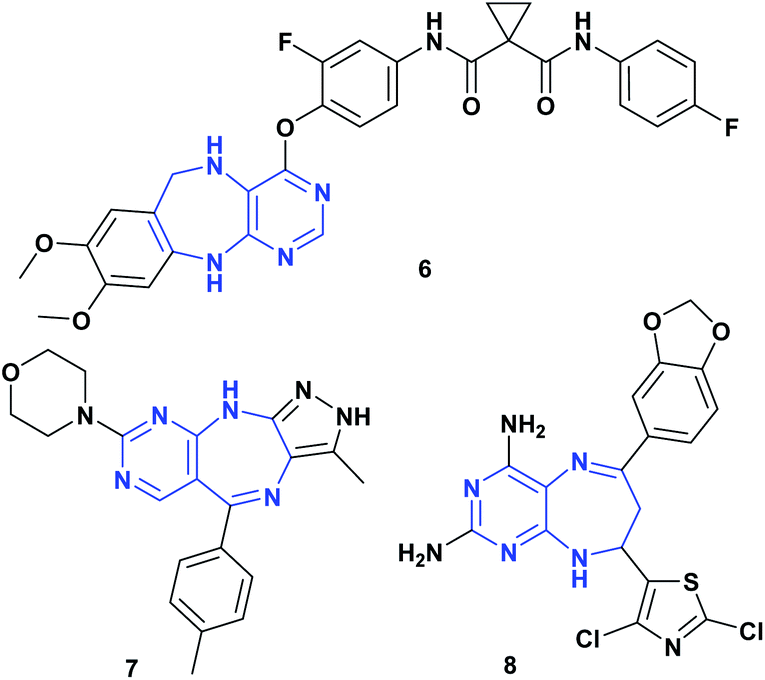 | ||
| Fig. 3 Pyrimidodiazepines with antitumor activity. | ||
Based on the general interest of 4-anilinoquinazolines, we designed and synthesized a new series of pyrimidodiazepines containing the 2-chloro-4-anilinoquinazoline fragment, which were obtained by the cyclocondensation reaction between quinazoline-chalcones with tetraaminopyrimidine. Further, those quinazoline-chalcones and pyrimidodiazepines were tested for in vitro antitumor activity against a wide panel of tumor cells by the U.S. National Cancer Institute (NCI). DNA binding study was carried out between quinazoline derivatives with calf thymus DNA (ctDNA). Moreover, the binding modes of quinazoline derivatives to DNA, EGFR and VEGFR-2 receptors were examined by molecular docking and molecular dynamics studies.
2. Results and discussion
2.1 Chemistry
The synthetic strategy to prepare the target compounds 14 and 16 is illustrated in Schemes 1 and 2. The 2-chloro-4-anilinoquinazoline 11 was obtained via nucleophilic substitution of the more reactive 4-chlorine12,25 of commercially available 2,4-dichloro-6,7-dimethoxyquinazoline 9 with the 3′-aminoacetophenone 10 at room temperature in THF with the addition of DIPEA to afford the desired product 11 in 40% yield (Scheme 1). Further, when the reaction was carried out using DIPEA in DMF, compound 11 was obtained in 45% yield. The mass spectrum of 2-chloro-4-anilinoquinazoline 11 revealed the isotopic profile for a monochloride molecule at m/z 357/359 [M]+/[M + 2]+ with a 3![[thin space (1/6-em)]](https://www.rsc.org/images/entities/char_2009.gif) :1 relative abundance (82/27) for 35Cl and 37Cl isotopes. It should be mentioned that the use of ethanol as a solvent under reflux for 4 h, gives the corresponding 2,4-diaminoquinazoline derivative 12 in 63% yield. Thus, quinazoline-chalcones 14a–g were synthesized in good yields (51–85%) by Claisen–Schmidt condensation between compound 11 and aromatic aldehydes 13a–g in presence of KOH in methanol at room temperature for 24 h.
:1 relative abundance (82/27) for 35Cl and 37Cl isotopes. It should be mentioned that the use of ethanol as a solvent under reflux for 4 h, gives the corresponding 2,4-diaminoquinazoline derivative 12 in 63% yield. Thus, quinazoline-chalcones 14a–g were synthesized in good yields (51–85%) by Claisen–Schmidt condensation between compound 11 and aromatic aldehydes 13a–g in presence of KOH in methanol at room temperature for 24 h.
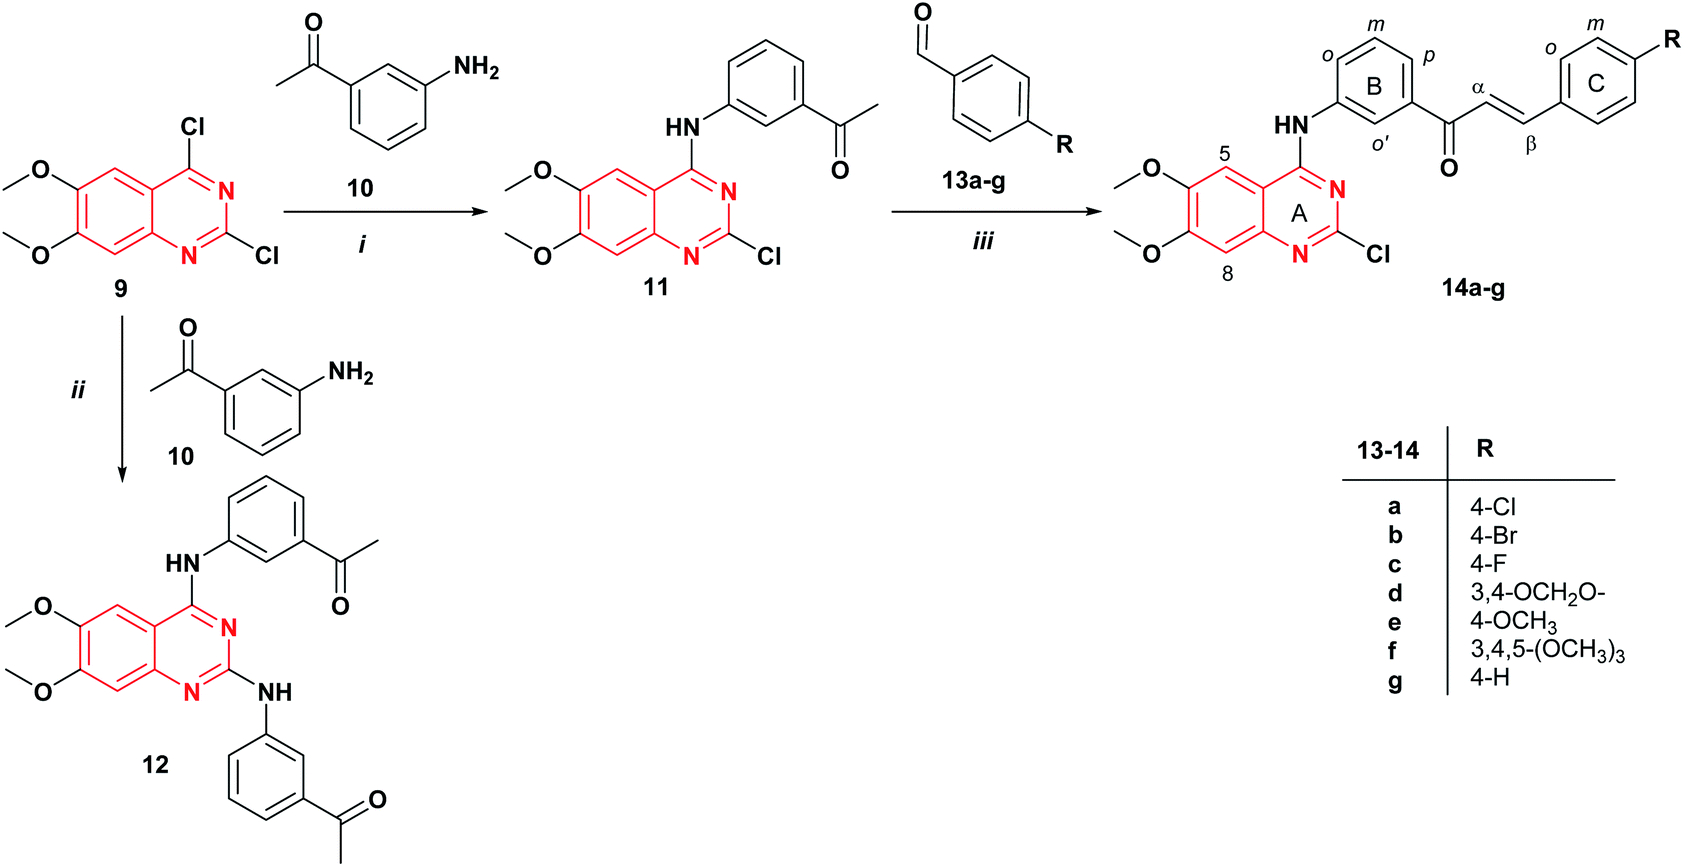 | ||
| Scheme 1 Synthesis of quinazoline-chalcones 14a–g. Reagents and conditions: (i) DIPEA, DMF, rt., 24 h; (ii) EtOH, reflux, 4 h; (iii) KOH, MeOH, rt., 24 h. | ||
 | ||
| Scheme 2 Synthesis of new pyrimidodiazepines 16a–g containing the 2-chloro-4-anilinoquinazoline fragment. Reagents and conditions: (i) MeOH, reflux, 10–12 h. | ||
The structural elucidation of quinazoline-chalcones 14a–g was performed by spectroscopic techniques: Fourier-transform infrared spectroscopy (FT-IR), 1H NMR, 13C NMR, and mass spectrometry. Compounds 14a–g showed similar spectroscopic data and therefore, we discuss here the compound 14a as the representative of this series. In the 1H NMR spectrum, the signal corresponding to Hα appears as a doublet at 7.78 ppm with coupling constant 3J = 15.5 Hz, confirming the E configuration of the C![[double bond, length as m-dash]](https://www.rsc.org/images/entities/char_e001.gif) C bond in the α,β-unsaturated fragment; the signals for Hβ, H-5, HCo and HBp appear as a multiplet between 8.06–7.84 ppm. At 3.97 and 3.93 ppm, two singlets were assigned to the methoxy groups. The 13C NMR spectrum showed the expected twenty-three signals for the carbon atoms of compound 14a. The mass spectrum showed the molecular ion peak at m/z 479/481/483 with a isotopic profile (12/11/1) [M]+/[M + 2]+/[M + 4]+, according to the assigned structure.
C bond in the α,β-unsaturated fragment; the signals for Hβ, H-5, HCo and HBp appear as a multiplet between 8.06–7.84 ppm. At 3.97 and 3.93 ppm, two singlets were assigned to the methoxy groups. The 13C NMR spectrum showed the expected twenty-three signals for the carbon atoms of compound 14a. The mass spectrum showed the molecular ion peak at m/z 479/481/483 with a isotopic profile (12/11/1) [M]+/[M + 2]+/[M + 4]+, according to the assigned structure.
The reaction of quinazoline-chalcones 14a–g with 2,4,5,6-tetraaminopyrimidine dihydrochloride 15 in methanol under reflux leads to the regioselective formation of a new series of pyrimidodiazepine derivatives 16a–g in good yields (50–58%). In this case, the reaction is highly regioselective, being controlled by nucleophilic addition of the more nucleophilic 5-amino group of the tetraaminopyrimidine 15 to the carbonyl group of the α,β-unsaturated fragment of 14 followed by a Michael type addition to Cβ of 14a–g, in agreement with the previously reported works on the synthesis of pyrimidodiazepines.24,26,27 The structural assignment of compounds 16a–g was performed based on NMR data, and mass spectrometry. In the 1H NMR spectrum of compound 16b, the signals for H-7 appear as a double doublet and multiplet at 2.83 ppm integrating for one proton (H7a′) and between 3.94–3.84 ppm for four protons corresponding to H-7′ (H7b′) and the OCH3 protons, and the signal of H-8′ appears as a triplet at 5.05 ppm with coupling constant 3J = 5.8 Hz, which form an AMX spin systems. Two singlets for the amino protons 2′-NH2 and 4′-NH2 were observed at 5.75 and 6.27 ppm, respectively. The 13C NMR spectrum showed the expected twenty-seven signals for the carbon atoms of compound 16b.
2.2 Anticancer activity
Quinazoline derivatives 14a–g and 16a–g were submitted to Developmental Therapeutic Program (DTP) of the U.S. National Cancer Institute (NCI). All compounds (14a–g and 16a–g) were selected for anticancer evaluation against 60 cancer cell lines of different panels of human tumor including colon, lung, prostate, ovarian, breast, and renal carcinoma, melanoma, central nervous system tumors, and leukemia. The preliminary in vitro anticancer screening was carried out at a single-dose of 10 μM after 48 h of incubation with the tumor cell lines. The results were reported as percentages growth (G%) (values between 0 and 100) and lethality (values less than 0) of the treated cells vs. control cells by the COMPARE program (see ESI†). Table 1 shows the results of antiproliferative activity expressed in terms of percent growth inhibition (GI% = 100 − G%) and lethality.28 Compounds 14g, 16a, and 16c were found to be highly active because they exhibited significant growth inhibition with the lowest values of mean growth (52.70, 46.58, and 57.99%, respectively) and high percentages growth inhibition (GI%), including lethality values in some cell lines, especially on HCT-116 (colon cancer), U251 (CNS cancer) and LOX IMVI (melanoma), respectively. Compound 14g showed strong growth inhibition in the three colon cancer cell lines HCT-116, HCT-15 and W-620 with 52.14, 34.08 and 11.91% lethality. Whereas 16a exhibited high inhibitory effects on the cancer cell lines HCT-116 (colon cancer), U251 (CNS cancer), LOX IMVI (melanoma) and 786-0 (renal cancer) with 44.82, 52.44, 52.35 and 52.06% lethality, respectively. Compound 16c showed a significant antiproliferative effect on HCT-116 (colon cancer), U251 (CNS cancer), LOX IMVI (melanoma) and MCF7 (breast cancer). On the other hand, the introduction of methylenedioxy (14d, 16d) and methoxy (14e, 14f, 16e, 16f) groups on the aryl ring (C, Schemes1 and 2) was unfavorable (high mean growth values), resulting in a reduced antiproliferative activity.| Compound | NSC Number | Mean growth | Most sensitive cell lines | G%/lethalitya | GI%b |
|---|---|---|---|---|---|
| a G%, growth percentages (values between 0 and 100); lethality, values less than 0.b GI, growth inhibition percentages (GI% = 100 − G%). Bold values correspond to GI > 50 (active compound against that cell line). The most active compounds are highlighted in italic. | |||||
| 14a | 822717 | 64.03 | HCT-116 (colon cancer) | −0.90 | — |
| SW-620 (colon cancer) | −5.87 | — | |||
| 14b | 822718 | 79.02 | RPMI-8226 (leukemia) | −2.21 | — |
| 14c | 822719 | 57.88 | RPMI-8226 (leukemia) | −18.09 | — |
| HCT-116 (colon cancer) | −41.24 | — | |||
| 14d | 822720 | 96.91 | RPMI-8226 (leukemia) | 26.65 | 73.35 |
| 14e | 822721 | 85.65 | RPMI-8226 (leukemia) | 18.57 | 81.43 |
| 14f | 822722 | 81.23 | RPMI-8226 (leukemia) | 13.87 | 86.13 |
| 14g | 822723 | 52.70 | RPMI-8226 (leukemia) | −2.13 | — |
| HCT-116 (colon cancer) | −52.14 | — | |||
| HCT-15 (colon cancer) | −34.08 | — | |||
| SW-620 (colon cancer) | −11.91 | — | |||
| 16a | 826382 | 46.58 | CCFR-CEM (leukemia) | −30.26 | — |
| HCT-116 (colon cancer) | −44.82 | — | |||
| U251 (CNS cancer) | −52.44 | — | |||
| LOX IMVI (melanoma) | −52.35 | — | |||
| 786-0 (renal cancer) | −52.06 | — | |||
| 16b | 826383 | 68.59 | U251 (CNS cancer) | −46.46 | — |
| 16c | 826384 | 57.99 | HCT-116 (colon cancer) | −41.74 | — |
| U251 (CNS cancer) | −22.02 | — | |||
| LOX IMVI (melanoma) | −53.62 | — | |||
| MCF7 (breast cancer) | −5.06 | — | |||
| 16d | 826385 | 71.80 | U251 (CNS cancer) | 8.17 | 91.83 |
| 16e | 826386 | 76.27 | SR (leukemia) | 3.81 | 96.19 |
| 16f | 826387 | 93.37 | K-562 (leukemia) | 55.33 | 44.67 |
| 16g | 826388 | 81.09 | K-562 (leukemia) | 6.71 | 93.29 |
| SR (leukemia) | −1.18 | — | |||
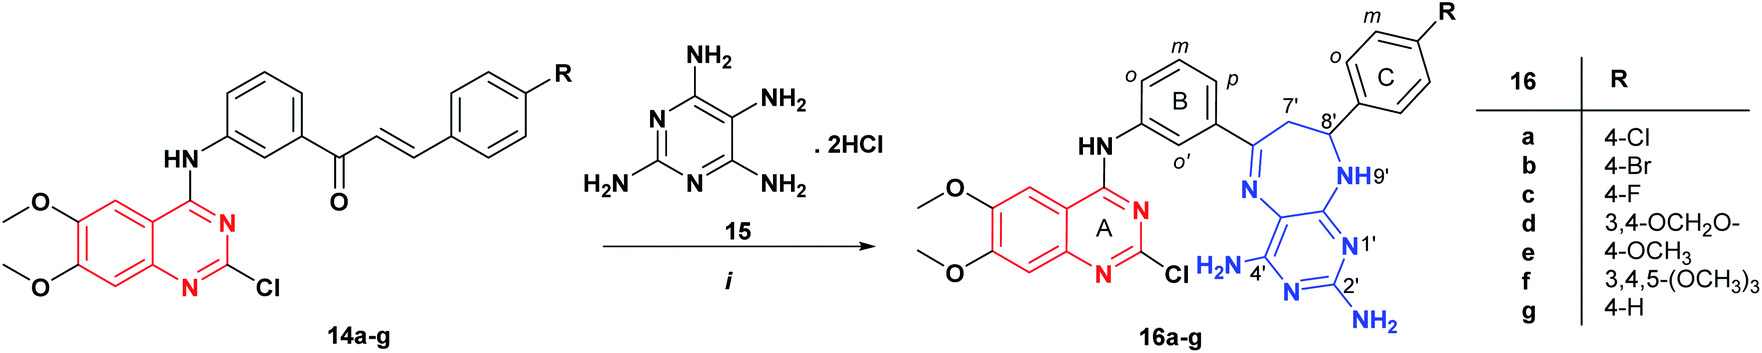
Subsequently, compounds 14g, 16a, and 16c were selected for advanced five-dose testing against the above 60 cancer cell lines using a series of five 10-fold dilutions (100.0, 10.0, 1.0, 0.1, 0.01 μM).29,30 The results were expressed for each cell line in three dose–response parameters, GI50 (molar concentration of compound required to inhibit 50% of the growth of the cancer cell line), TGI (molar concentration leading to total growth inhibition), and LC50 (molar concentration required to kill 50% of cancer cells).31
As illustrated in Table 2, the quinazoline-chalcone 14g displayed high antiproliferative activity on K-562 (leukemia), RPMI-8226 (leukemia), HCT-116 (colon cancer), LOX IMVI (melanoma) and MCF7 (breast cancer) cancer cell lines with GI50 values between 0.622–1.81 μM. It exhibited strong growth inhibitory activity against the K-562 leukemia cell line with GI50 of 0.622 μM. Compound 16a exhibited potent anticancer activity against the cell lines HL-60(TB) (leukemia), K-562 (leukemia), HCT-116 (colon cancer), HCT-15 (colon cancer), SW-620 (colon cancer), SF-539 (CNS cancer), SK-MEL-5 (melanoma), OVCAR-3 (ovarian cancer), OVCAR-4 (ovarian cancer), ACHN (renal cancer), CAKI-1 (renal cancer), DU-145 (prostate cancer), MCF7 (breast cancer), MDA-MB-231/ATCC (breast cancer) and MDA-MB-468 (breast cancer), showing for those cell lines better cytostatic (TGI) and/or cytotoxic activity (LC50) than adriamycin/doxorubicin (NSC 123127), NCI standard drug. Moreover, compound 16c exhibited the highest cytostatic activity against SNB-75 (CNS cancer) and 786-0 (renal cancer) cells line with TGI value of 2.42 and 2.99 μM. It totally inhibited the growth of thirty-six (36) cell lines at 2.42–3.99 μM. As a reference, the growth inhibition percentages of compound 16c against the 60 cancer cell lines at five different concentrations were recorded in dose–responses curves (Fig. 4).
| Panel cell line | Compounds | Doxorubicin NSC 123127b | ||||||||||
|---|---|---|---|---|---|---|---|---|---|---|---|---|
| 14g | 16a | 16c | ||||||||||
| GI50 | TGI | LC50 | GI50 | TGI | LC50 | GI50 | TGI | LC50 | GI50 | TGI | LC50 | |
| a GI50, the molar concentration of compound required to inhibit 50% of the growth of the cancer cell line (relative to untreated cells); TGI, the molar concentration leading to total growth inhibition; and LC50, the molar concentration required to kill 50% of cancer cells.b The values of activity against human cancer cell lines displayed by adriamycin/doxorubicin (NSC 123127). Please visit: https://dtp.cancer.gov/dtpstandard/cancerscreeningdata/index.jsp. Bold values are the highest values of GI50, TGI and LC50 in comparison to the standard anticancer agent adriamycin/doxorubicin. | ||||||||||||
| Leukemia | ||||||||||||
| CCRF-CEM | 2.45 | >100 | >100 | 1.59 | 5.30 | >100 | 1.05 | 4.14 | >100 | 0.081 | 10.0 | 100 |
| HL-60(TB) | 3.61 | >100 | >100 | 1.79 | 4.18 | 9.77 | 1.95 | 4.09 | 8.60 | 0.120 | 2.57 | 89.1 |
| K-562 | 1.74 | >100 | >100 | 1.91 | 4.16 | 9.08 | 1.96 | 4.69 | >100 | 0.194 | 12.0 | 100 |
| MOLT-4 | 2.77 | >100 | >100 | 1.75 | 5.10 | >100 | 1.77 | 5.45 | >100 | 0.031 | 1.00 | 100 |
| RPMI-8226 | 0.622 | 3.48 | >100 | 1.97 | 4.84 | >100 | 1.77 | 4.42 | >100 | 0.076 | 1.28 | 100 |
| SR | 1.70 | — | >100 | 1.91 | 5.33 | >100 | 1.96 | 4.80 | >100 | 0.028 | 1.34 | 100 |
|
||||||||||||
| Non-small cell lung cancer | ||||||||||||
| A549/ATCC | 15.00 | >100 | >100 | 3.14 | 16.10 | >100 | 2.64 | 7.82 | >100 | 0.061 | 0.28 | 100 |
| EKVX | 11.40 | >100 | >100 | 2.44 | 9.17 | >100 | 1.50 | 3.99 | >100 | 0.416 | 5.49 | 47.8 |
| HOP-62 | 3.71 | 31.7 | >100 | 5.24 | 32.50 | >100 | 1.68 | 3.69 | — | 0.067 | 1.99 | 67.6 |
| HOP-92 | 2.09 | 8.51 | >100 | 1.68 | 3.82 | — | 1.50 | 3.72 | — | 0.100 | 1.99 | 42.6 |
| NCI-H226 | 5.81 | >100 | >100 | 14.90 | 50.1 | >100 | 3.22 | 16.60 | >100 | 0.050 | 0.25 | 6.45 |
| NCI-H23 | 6.62 | >100 | >100 | 2.69 | 8.40 | >100 | 2.00 | 4.73 | >100 | 0.151 | 0.91 | 13.1 |
| NCI-H322M | 20.40 | >100 | >100 | 2.93 | 9.91 | >100 | 2.14 | 5.57 | 34.8 | 0.537 | 5.01 | 67.6 |
| NCI-H460 | 4.20 | >100 | >100 | 2.01 | 3.87 | — | 1.91 | 3.82 | 7.64 | 0.017 | 1.28 | 51.2 |
| NCI-H522 | 3.09 | 52.6 | >100 | — | — | — | — | — | — | 0.028 | 0.16 | 2.81 |
|
||||||||||||
| Colon cancer | ||||||||||||
| COLO 205 | 11.40 | >100 | >100 | 1.80 | 3.81 | — | 1.77 | 3.51 | 6.94 | 0.181 | 0.95 | 4.36 |
| HCC-2998 | 2.54 | 5.56 | >100 | 1.89 | 3.63 | — | 1.92 | 3.48 | 6.32 | 0.257 | 2.23 | 21.8 |
| HCT-116 | 1.62 | 5.16 | >100 | 1.71 | 3.25 | — | 1.76 | 3.34 | 6.33 | 0.079 | 8.12 | 54.9 |
| HCT-15 | 2.88 | >100 | >100 | 2.07 | 4.80 | >100 | 1.96 | 4.27 | 9.27 | 6.45 | 100 | 100 |
| HT29 | 4.39 | >100 | >100 | 2.05 | 4.53 | >100 | 2.05 | 4.38 | 9.34 | 0.123 | 0.95 | 67.6 |
| KM12 | 2.45 | >100 | >100 | 1.94 | 3.88 | — | 1.88 | 3.61 | 6.94 | 0.263 | 14.7 | 93.3 |
| SW-620 | 2.79 | >100 | >100 | 1.85 | 3.79 | 7.78 | 1.76 | 3.60 | 7.39 | 0.091 | 11.7 | 58.8 |
|
||||||||||||
| CNS cancer | ||||||||||||
| SF-268 | 4.99 | 81.40 | >100 | 1.85 | 4.05 | — | 1.68 | 3.68 | 8.07 | 0.104 | 1.41 | 30.1 |
| SF-295 | 3.08 | 19.60 | >100 | 1.89 | 3.78 | — | 1.82 | 3.50 | 6.72 | 0.102 | 1.25 | 69.1 |
| SF-539 | 3.82 | 19.20 | >100 | 1.75 | 3.13 | 5.71 | 1.53 | 2.93 | 5.60 | 0.114 | 1.51 | 26.9 |
| SNB-19 | 2.89 | 10.10 | >100 | 1.99 | 4.22 | — | 1.94 | 4.22 | — | 0.042 | 2.63 | 50.1 |
| SNB-75 | 2.06 | 8.61 | >100 | 2.39 | 14.30 | 63.90 | 1.13 | 2.42 | 5.19 | 0.067 | 0.33 | 3.31 |
| U251 | 3.11 | 14.50 | >100 | 1.99 | 4.20 | — | 2.12 | 4.35 | — | 0.038 | 2.23 | 30.9 |
|
||||||||||||
| Melanoma | ||||||||||||
| LOX IMVI | 1.54 | 3.63 | >100 | 1.87 | 3.79 | — | 1.78 | 3.51 | 6.93 | 0.066 | 2.45 | 50.1 |
| M14 | 5.01 | >100 | >100 | 1.87 | 4.04 | — | 1.86 | 3.70 | 7.36 | 0.123 | 0.41 | 3.98 |
| MDA-MB-435 | 3.40 | 28.90 | >100 | 1.64 | 3.07 | 5.77 | 1.66 | 3.11 | 5.84 | 0.177 | 0.93 | 4.07 |
| SK-MEL-2 | 4.42 | 57.70 | >100 | 1.95 | 4.21 | — | 1.65 | 3.68 | — | 0.251 | 1.44 | 9.54 |
| SK-MEL-28 | 5.03 | >100 | >100 | 1.66 | 3.10 | 5.78 | 1.62 | 3.04 | 5.69 | 0.169 | 0.39 | 1.07 |
| SK-MEL-5 | 5.17 | >100 | >100 | 1.68 | 3.08 | 5.62 | 1.65 | 3.02 | 5.51 | 0.208 | 0.70 | 15.8 |
| UACC-257 | 9.75 | >100 | >100 | 2.43 | 6.22 | >100 | 1.96 | 3.94 | 7.94 | 0.077 | 0.21 | 0.48 |
| UACC-62 | 2.55 | 10.10 | >100 | 1.71 | 3.32 | — | 1.76 | 3.31 | 6.23 | 0.141 | 0.47 | 8.12 |
|
||||||||||||
| Ovarian cancer | ||||||||||||
| IGROV1 | 4.45 | 42.90 | >100 | 2.90 | 10.90 | >100 | 1.78 | 4.16 | — | 0.169 | 12.8 | 100 |
| OVCAR-3 | 3.75 | 31.30 | >100 | 2.04 | 4.20 | 8.63 | 1.85 | 3.55 | 6.79 | 0.389 | 10.0 | 85.1 |
| OVCAR-4 | 5.50 | 33.30 | >100 | 2.00 | 4.81 | 19.30 | 1.63 | 3.38 | 7.03 | 0.371 | 7.41 | 74.1 |
| OVCAR-5 | 8.79 | >100 | >100 | 2.12 | 5.25 | 22.40 | 1.79 | 3.55 | 7.04 | 0.416 | 4.67 | 100 |
| OVCAR-8 | 4.99 | >100 | >100 | 2.35 | 5.99 | >100 | 2.30 | — | >100 | 0.100 | 1.99 | 43.6 |
| NCI/ADR-RES | 7.26 | >100 | >100 | 4.16 | 92.00 | >100 | 6.07 | >100 | >100 | 7.24 | 72.4 | 100 |
| SK-OV-3 | 7.96 | 51.70 | >100 | 21.80 | 48.00 | >100 | 25.70 | 59.20 | >100 | 0.223 | 13.1 | 100 |
|
||||||||||||
| Renal cancer | ||||||||||||
| 786-0 | 3.05 | 15.00 | >100 | 1.70 | 3.18 | — | 1.56 | 2.99 | 5.71 | 0.125 | 5.62 | 51.2 |
| A498 | 6.23 | 44.3 | >100 | 10.50 | 26.90 | 69.20 | 1.01 | 2.47 | 6.00 | 0.100 | 0.38 | 1.90 |
| ACHN | 3.51 | >100 | >100 | 2.15 | 4.87 | 15.20 | 1.74 | 3.22 | 5.97 | 0.075 | 13.8 | 100 |
| CAKI-1 | 4.17 | 35.40 | >100 | 1.99 | 4.49 | 11.50 | 1.61 | 3.27 | 6.64 | 0.954 | 56.2 | 100 |
| RXF 393 | 2.02 | 5.46 | >100 | 1.61 | 3.14 | — | 1.38 | 2.85 | — | 0.097 | 0.53 | 4.67 |
| SN12C | 3.98 | 41.10 | >100 | 2.68 | 8.10 | 81.40 | 1.72 | 3.48 | 7.05 | 0.072 | 5.01 | 72.4 |
| TK-10 | 4.19 | 20.00 | >100 | 2.62 | 6.87 | >100 | 1.95 | 3.86 | 7.63 | 0.186 | 2.39 | 87.0 |
| UO-31 | 17.8 | >100 | >100 | 2.48 | 8.89 | 76.40 | 1.55 | 3.54 | 8.07 | 0.489 | 2.63 | 26.3 |
|
||||||||||||
| Prostate cancer | ||||||||||||
| PC-3 | 3.86 | 27.80 | >100 | 3.97 | 37.90 | >100 | 2.17 | 6.68 | >100 | 0.323 | 5.88 | 87.0 |
| DU-145 | 23.80 | >100 | >100 | 2.07 | 8.84 | 17.60 | 1.77 | 3.44 | 6.67 | 0.107 | 17.7 | 100 |
|
||||||||||||
| Breast cancer | ||||||||||||
| MCF7 | 1.81 | >100 | >100 | 1.80 | 4.11 | — | 1.73 | 3.92 | — | 0.027 | 10.7 | 51.2 |
| MDA-MB-231/ATCC | 9.14 | 85.40 | >100 | 1.63 | 3.29 | 6.64 | 1.49 | 3.03 | 6.14 | 0.512 | 4.16 | 34.6 |
| HS 578T | 3.71 | 41.10 | >100 | 1.88 | 4.28 | — | 1.98 | 4.53 | >100 | 0.331 | 4.67 | 85.1 |
| BT-549 | 2.36 | 7.83 | 53.6 | 7.93 | 38.00 | >100 | 2.29 | 4.36 | 8.33 | 0.234 | 2.18 | 21.3 |
| T-47D | 9.17 | >100 | >100 | 2.02 | 4.61 | >100 | 1.93 | 4.64 | >100 | 0.058 | 0.77 | 85.1 |
| MDA-MB-468 | 3.39 | >100 | >100 | 1.73 | 3.49 | 7.05 | 1.79 | 3.39 | 6.42 | 0.055 | 0.31 | 2.51 |
| MEAN | 4.07 | 4.27 | 100 | 2.34 | 6.17 | 39.8 | 1.91 | 4.36 | 15.5 | 0.141 | 2.34 | 28.8 |
 | ||
| Fig. 4 Anticancer activity of compound 16c against 60 cancer cell lines of different panels of human cell lines. The horizontal lines at zero (0) show the concentration that leads to total growth inhibition. | ||
Among those molecules, compound 16c also displayed 10.0-fold higher cytotoxic activity against ten cell lines in comparison to the standard anticancer agent adriamycin/doxorubicin (NSC 123127) for HL-60(TB) (leukemia), HCT-15 (colon cancer), OVCAR-3 (ovarian cancer), OVCAR-4 (ovarian cancer), OVCAR-5 (ovarian cancer), ACHN (renal cancer), CAKI-1 (renal cancer), SN12C (renal cancer), TK-10 (renal cancer) and DU-145 (prostate cancer) cell lines with LC50 values ranging from 5.97 to 9.27 μM. Given their antitumor activities, compounds 14g, 16a and 16c were further tested for hemolytic activity against human red blood cells (huRBC). None of the active compounds induced disruption of human red blood cells (0.0–0.6%), indicating that they may be not related with cell membrane damage.
2.3 COMPARE analysis
The NCI COMPARE algorithm (https://dtp.cancer.gov/databases_tools/compare.htm) indicates a correlation between compounds with known biological targets, which have been used extensively to predict and identify the mechanisms of action of synthetic and natural products.32–34 Therefore, the in vitro antitumor screening of compounds 14g, 16a and 16c were analyzed using COMPARE algorithm against the NCI standard drugs database at the GI50 and LC50 levels. The algorithm ranks the results of the tested compound in order of the similarity of responses against 60 human tumor cell lines,31 expressed quantitatively as Pearson correlation coefficient (PCC) as shown in Table 3. Compounds 14g, 16a, and 16c showed low Pearson correlation coefficients (PCC) did not allow to distinguish their antiproliferative mechanism (end point – GI50). However, compound 16c showed the highest correlation at the LC50 level with the DNA alkylating agent CCNU (lomustine) (NSC 79037) (PCC = 0.75), suggesting that compound 16c possesses a similar cytotoxicity mechanism of action through DNA binding.| Compound | End point | PCCa | Target | NSC number | Target/mechanism of action |
|---|---|---|---|---|---|
| a PCC: Pearson correlation coefficient (PCC ≥ 0.60 was considered significant). | |||||
| 14g | GI50 | 0.58 | L-Cysteine analogue | 303861 | L-Glutamine antagonist inhibited purine nucleotide biosynthesis35 |
| 16a | GI50 | 0.58 | S-Trityl-L-cysteine | 83265 | Inhibitor of the Human Kinesin Eg5 (ref. 36) |
| 16c | GI50 | 0.61 | Didemnin B | 325319 | Didemnin B inhibits protein synthesis and DNA synthesis37 |
| LC50 | 0.75 | CCNU (lomustine) | 79037 | DNA/RNA alkylating agent38 | |
2.4 DNA binding study
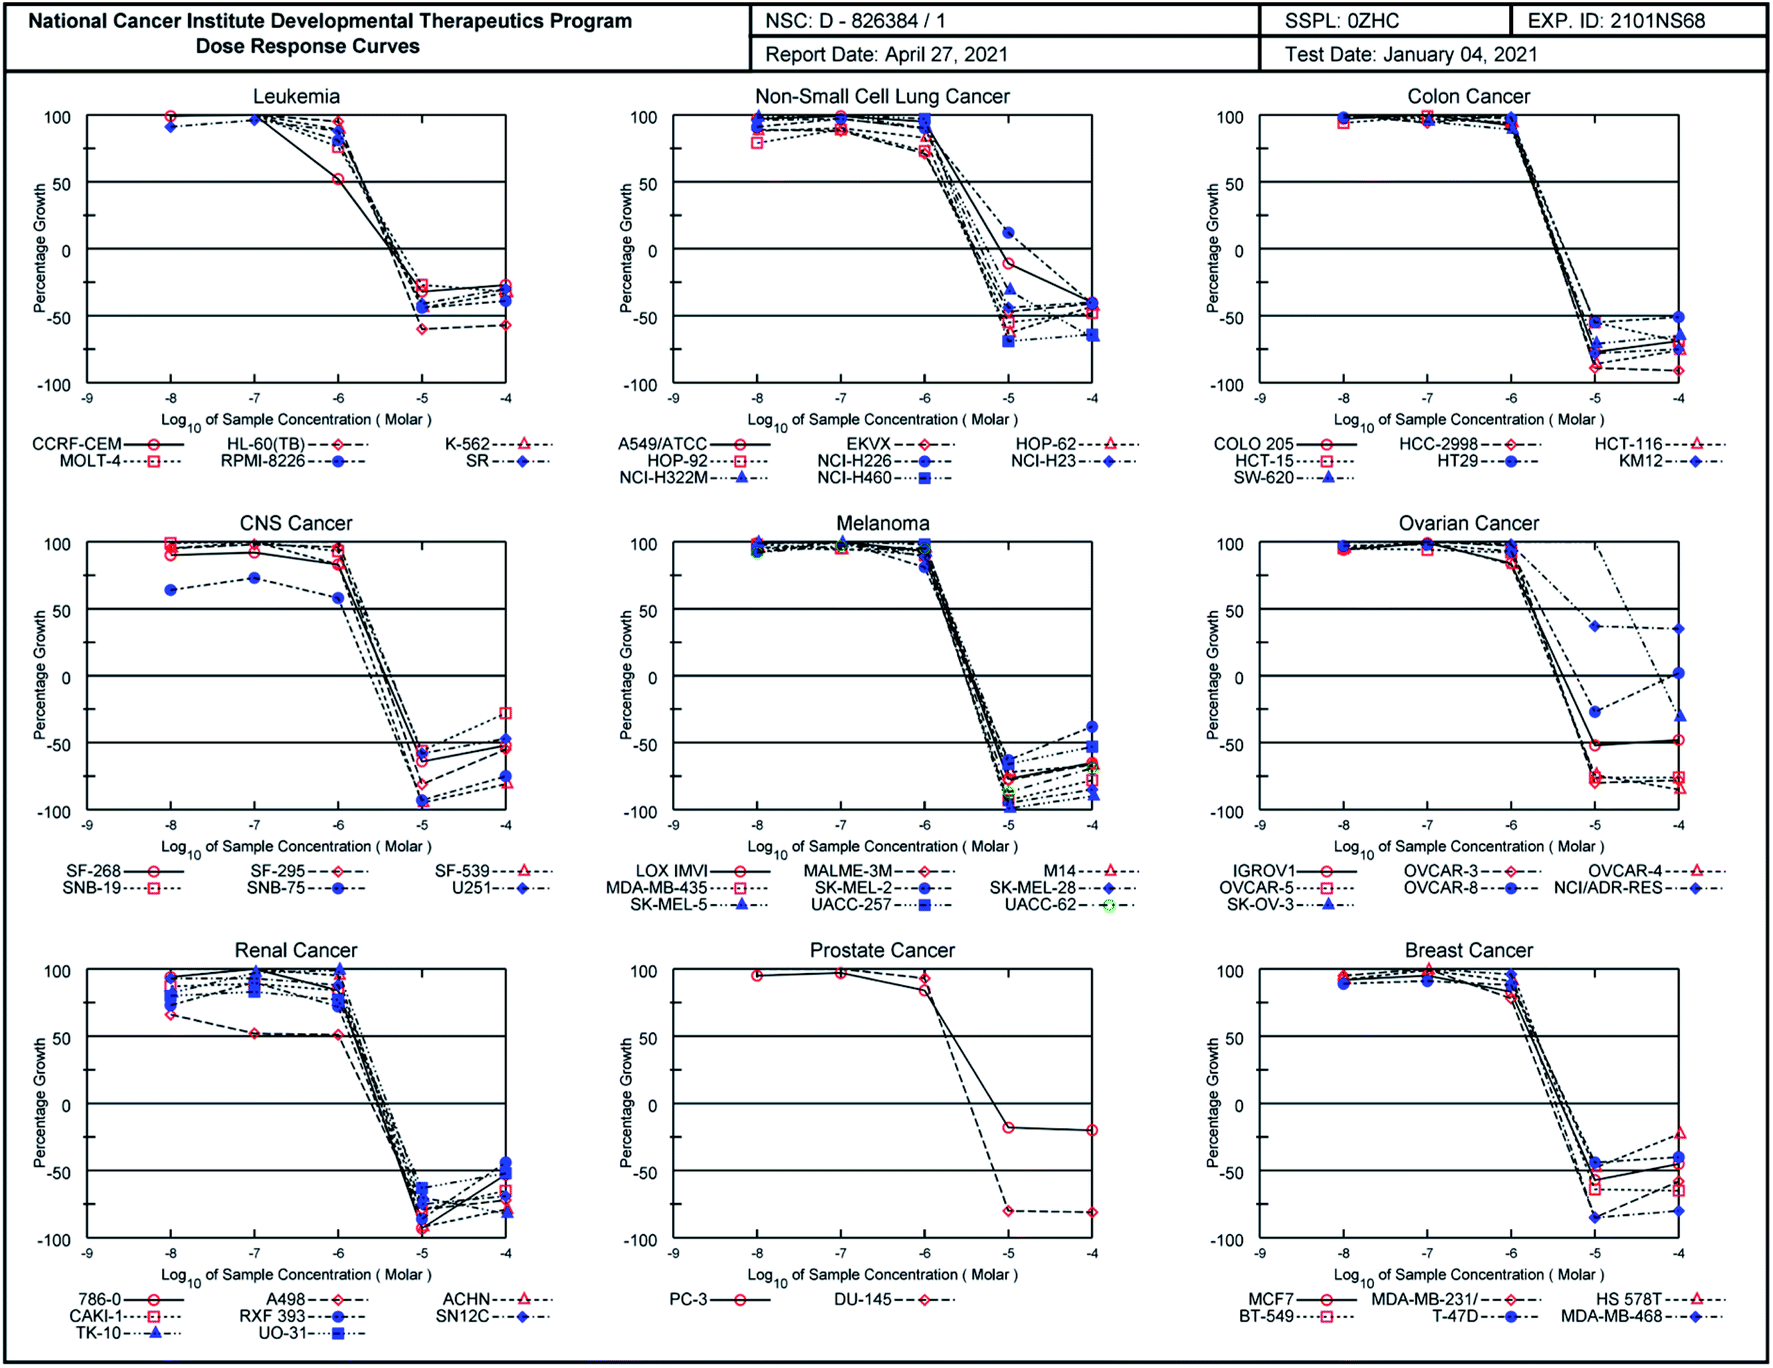
According to COMPARE analysis, compound 16c owes its anticancer activity through DNA binding, being DNA an important target of anticancer agents. Therefore, the study of the union between the quinazolines (14g and 16c) and calf thymus DNA (ctDNA) was carried out by UV spectroscopy to assess the possible interaction between those compounds with nucleic acids. Quinazolines 14g and 16c showed alterations on their electronic UV spectra during the titration of a fixed amount of ctDNA. Fig. 5A shows a clear hypochromic effect of up to 35% on the electronic UV spectrum of 14g after the addition of ctDNA, without showing a significant change in the maximum absorption wavelengths. Besides, an isosbestic point was found at 385 nm, indicating the presence of two species in the solution,39,40 the free compound 14g and the 14g–ctDNA complex. The hypochromic effect indicates that this molecule may interact with the DNA strands by intercalation since the molecular structure of 14g has a planar conjugated system, which facilitates interaction with the double-stranded ctDNA.41 As shown in Fig. 5B, compound 16c also shows a hypochromic effect after titration with ctDNA, being up to 19% for the highest concentration of ctDNA evaluated due to the binding mode between the compound 16c and the nitrogenous bases of DNA through π–π stacking interaction.41 A clear blue shift in the peak position can be observed in Fig. 5, and this hypsochromism indicates the destabilization of the π interactions involving the nitrogenous bases due to the entry of one-half of the planar molecule, whose second zone has a non-planar steric conformation.42 | ||
| Fig. 5 (A) UV-vis absorption spectra of quinazoline-chalcone 14g and (B) pyrimidodiazepine 16c alone (black line) after the addition of amounts of calf thymus DNA (ctDNA) from 9.6 to 96.0 μM (orange line) at 25 °C. The arrow shows the absorbance change by the addition of ctDNA. | ||
According to UV-vis absorption spectra, the binding constant (Kb) were calculated from Wolfe–Shimmer eqn (1) as 9.3 × 10³ and 7.1 × 10³ M−1 for the compounds 14g and 16c with DNA, respectively (Fig. 6), where εa, εf, and εb are apparent molar absorption coefficients of the compound with DNA, without DNA, and binding DNA, respectively.43,44 The binding constant (Kb) values were higher than those found for the DNA target drugs methyl-CCNU (semustine) and CCNU (lomustine) with Kb of 1.53 × 10³ and 8.12 × 10³ M−1 to calf thymus DNA, respectively.45 The interactions between small molecules and nucleic acids can generally be classified into two types: intercalation and groove binding; however, some molecules possess structural properties that favor interactions using both mechanisms, such as planarity, high π conjugation, and additional charges or zones that are deficient in high electron density.14 These results indicated that compounds 14g and 16c could bind to the groove of DNA or weak intercalation, where compound 14g has a higher affinity than 16c to DNA, according to the hypochromic effect and binding constant (Kb). These findings may contribute to a greater understanding of the mechanism of action of those quinazoline derivatives.
 | (1) |
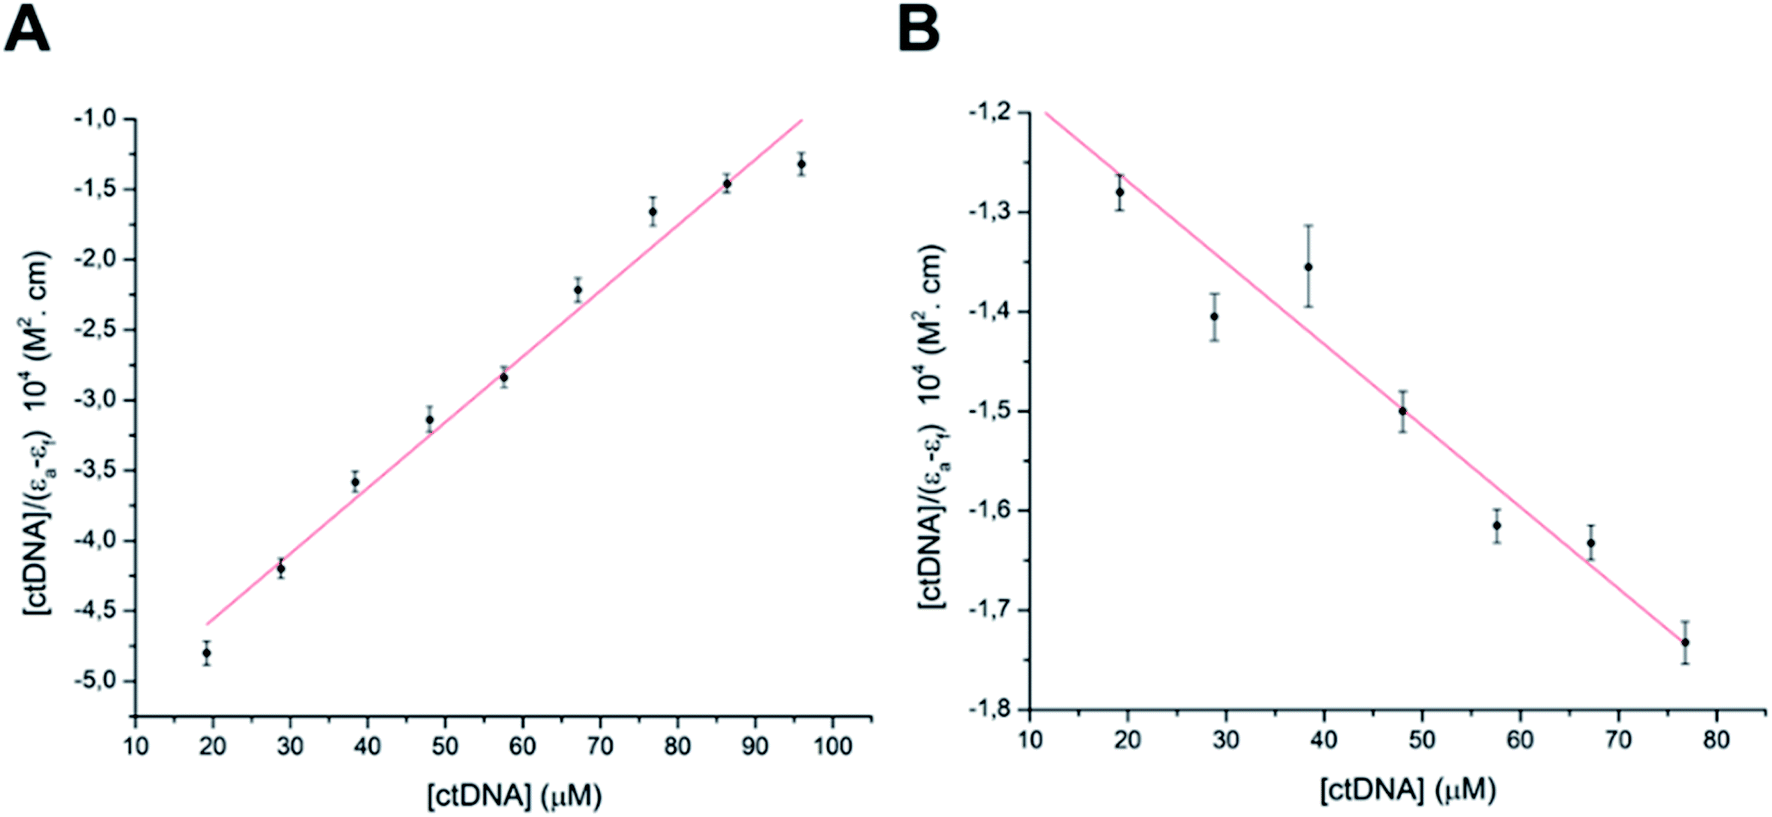 | ||
| Fig. 6 Binding saturation plots according to Wolfe–Shimmer equation. (A) ctDNA–14g and (B) ctDNA–16c. | ||
The binding of compounds to DNA can alter the denaturation temperature (Tm) of DNA, depending on intercalation forces. Absorbance changes at 260 nm were observed when the absorbance of ctDNA was measured in the absence and presence of the compounds 14g and 16c. Fig. 7 presents the melting curves of free ctDNA and its systems, showing that the Tm value changed from 69 °C for native ctDNA to approximately 72 and 67 °C for ctDNA–14g and ctDNA–16c, respectively, which suggests that the binding mode involves the destabilization of π interactions, weak intercalation, or unfavorable groove binding.46 In general, the union between small molecules and DNA that occurs through strong intercalation forces causes Tm values to increase from 5–8 °C;46,47 therefore, this mode of binding could be excluded.
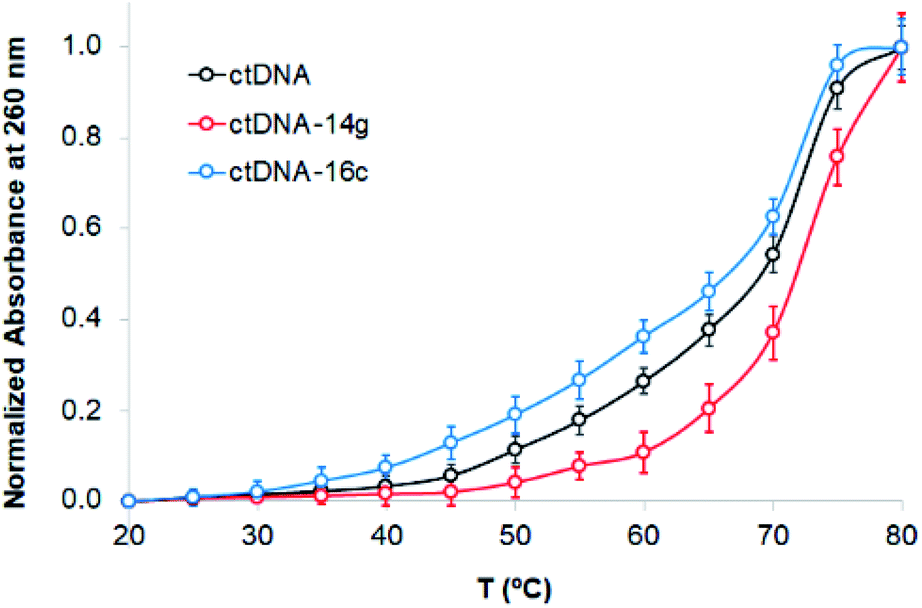 | ||
| Fig. 7 Melting curves of ctDNA (80 μM) in the absence and presence of the compounds 14g and 16c (80 μM). | ||
To study changes in the hydrodynamics of an aqueous DNA solution caused by phenomena related to changes in the DNA length and tertiary structures, viscosity studies were carried out for ctDNA alone and combined with compounds 14g and 16c at various concentrations. Fig. 8 displays a graph of the relative viscosity versus the [compound]/[ctDNA] ratio. These results indicated that no significant changes occurred in the ctDNA–16c system, further supporting that the interaction occurs through groove binding because DNA length remains intact and viscosity is almost unaffected when a molecule binds to the groove of a double-helix DNA molecule.40 When the ctDNA–14g system was examined, an increase in the ctDNA viscosity was observed, which suggested that the 14g molecules are accommodated in the space of adjacent base pairs, as occurs during classical intercalation binding.46
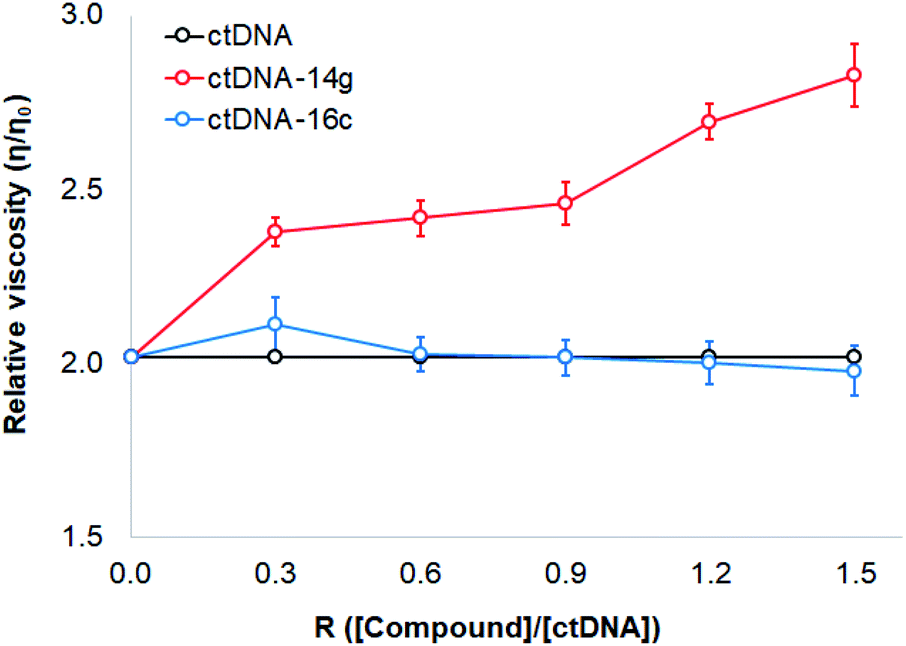 | ||
| Fig. 8 Effect of increasing amounts of 14g and 16c on the relative viscosity of ctDNA. | ||
Based on these results, compound 16c most likely binds ctDNA through a groove interaction, whereas compound 14g appears to favor weak intercalations at 25 ± 5 °C. To establish the possible interactions of those quinazoline derivatives, molecular docking was performed with DNA, EGFR, and VEGFR-2 receptors.
2.5 Molecular docking
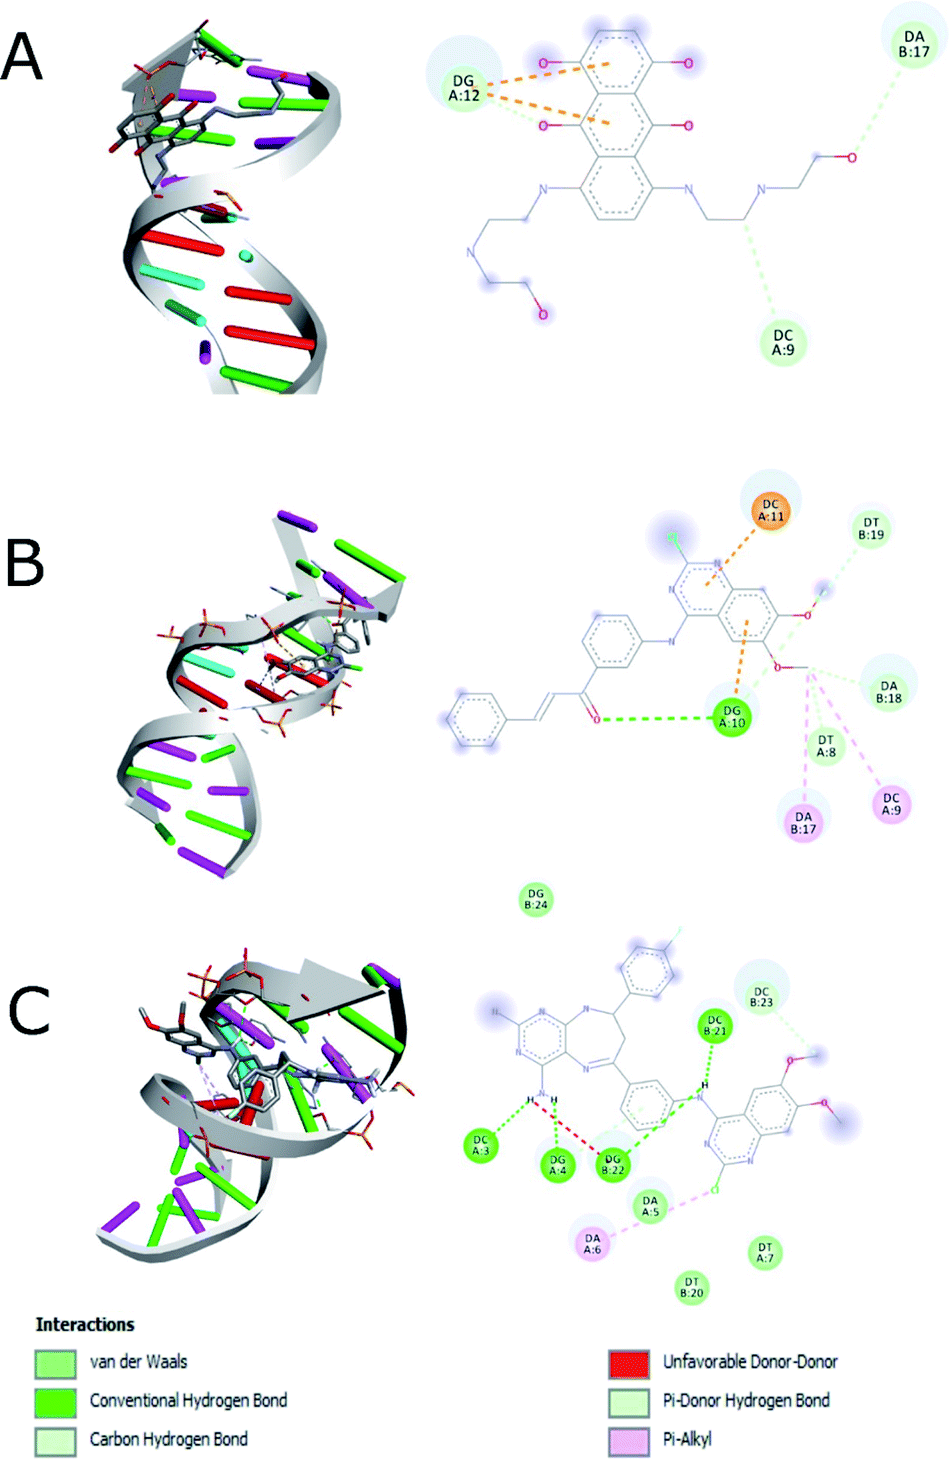
The docking study was performed on DNA to predict the binding affinity and the interactions of compounds 14g and 16c using mitoxantrone48,49 for interaction with DNA (1BNA). Based on the fact that 2-chloro-4-anilinoquinazoline derivatives have been reported as anticancer agents to target the EGFR and VEGFR-2 receptors,9,12,13 we also performed the studies of docking of compounds 14g, 16a and 16c into the active site of the EGFR (PDB: 1XKK) and VEGFR-2 (PDB: 4ASE). Two controls were taken for both EGFR (gefitinib and lapatinib) and VEGFR-2 (sorafenib and tivozanib) receptors. The structures of the compounds 14g, 16a and 16c (ligands) and controls were prepared with Autodock software50 using Gasteiger charges.51As shown in Table 4, a comparison of the interactions with DNA between mitoxantrone (DNA intercalating agent) and compound 16c, shows that 16c exhibits an enhanced interaction with a binding energy of −8.20 kcal mol−1 mainly hydrogen bonding type interaction with the 4-amino group of pyrimidodiazepine 16c (dashed lines in Fig. 9). In contrast, the quinazoline-chalcone 14g was the structure that interacts most strongly with DNA, forming both hydrogen bonds and hydrophobic interactions, generating a slightly better binding energy of −8.30 kcal mol−1 with respect to ligand 16c (−8.20 kcal mol−1), which agrees quite well with the results obtained for compound 14g with calf thymus DNA by UV spectroscopy.
| Ligands | Receptor | Binding energy (kcal mol−1) | HB | EI | HI | Halogen |
|---|---|---|---|---|---|---|
| a HI: hydrophobic interactions; HB: hydrogen bonds; EI: electrostatic interactions. | ||||||
| Mitoxantrone | DNA | −6.40 | 3 | 2 | 0 | 0 |
| 14g | DNA | −8.30 | 5 | 2 | 0 | 0 |
| 16c | DNA | −8.20 | 9 | 2 | 0 | 0 |
| Gefitinib | EGFR | −5.40 | 0 | 1 | 5 | 0 |
| Lapatinib | EGFR | −8.30 | 3 | 1 | 6 | 1 |
| 14g | EGFR | −6.30 | 8 | 0 | 5 | 0 |
| 16a | EGFR | −7.80 | 3 | 2 | 11 | 0 |
| 16c | EGFR | −9.90 | 5 | 0 | 18 | 1 |
| Sorafenib | VEGFR-2 | −9.10 | 7 | 0 | 5 | 2 |
| Tivozanib | VEGFR-2 | −7.70 | 4 | 1 | 6 | 0 |
| 14g | VEGFR-2 | −7.90 | 2 | 3 | 6 | 0 |
| 16a | VEGFR-2 | −9.20 | 6 | 3 | 2 | 0 |
| 16c | VEGFR-2 | −9.00 | 10 | 2 | 5 | 1 |
 | ||
| Fig. 9 Interaction between (A) hydrophobic interaction mitoxantrone and DNA, (B) 14g with DNA and (C) 16c with DNA. | ||
Fig. 9 shows the enhanced interaction of the compound 16c with DNA by forming mainly hydrogen bonds from the amino groups of pyrimidodiazepine and anilino moieties with both cytosine (Dc3, Dc21) and guanine (Dg4, Dg22). Further, the 2-chlorine atom of quinazoline of 16c allows it to form hydrophobic interactions with adenine (Da6) to a lesser degree. In contrast, the quinazoline moiety of ligand 14g interacts with hydrogen bond, electrostatic and hydrophobic interactions with all nitrogenous bases bind to the minor groove of DNA as revealed from the most favorable conformation of the docking study (Fig. 9B). The hydrogen bond was formed between the carbonyl group of the α,β-unsaturated fragment with guanine (Dg10). Mitoxantrone exhibits only two hydrophobic interactions with guanine (Dg12).
Table 4 shows how ligand 16c has higher binding energy with the EGFR receptor, even better than the controls lapatinib and gefitinib. The type of interactions that ligand 16c presented were mainly 18 hydrophobic interactions, five hydrogen bridges, and one halogenated. Hydrophobic interactions are formed with quinazoline moiety of 16c where 2-chlorine atom increases this type of interaction forming up to five hydrophobic interactions mainly with Ala743, Leu792, and Met793. Regarding the affinity between ligand and VEGFR-2 the best result was found for compound 16a (−9.20 kcal mol−1), followed closely by 16c (−9.00 kcal mol−1) having similar values to the control sorafenib. The major type of interactions that both ligands 16a and 16c displayed with VEGFR-2 were hydrogen bonds.
Fig. 10A shows the interactions between the ligands with the EGFR receptor, where ligands display in common both hydrogen bonding and hydrophobic interactions. Compound 16c presents a higher number of hydrophobic interactions than the rest of the molecules, followed by ligand 16a with the same behavior. In Fig. 10B, more hydrogen bridge interactions with the VEGFR-2 receptor are observed among all the ligands except for tivozanib and 14g, which obtained the lowest affinity energy.
 | ||
| Fig. 10 Number of interactions between ligands and controls with (A) EGFR and (B) VEGFR-2. HI: hydrophobic interactions; HB: hydrogen bonds; EI: electrostatic interactions. | ||
Fig. 11 shows ligand 16c interacting with EGFR revealing a cavity formed by hydrophobic amino acids such as Val726, Leu792, Leu718, Ala743, Met793, Leu844, and Leu1001 that form hydrophobic interactions with this ligand. Other types of molecular interactions formed are hydrogen bonds with residues such as Lys745, Phe795, Cys797, and Tyr998; besides a halogenated interaction between the 2-chlorine atom of quinazoline 16c with residue Val717 is formed (Fig. 11).
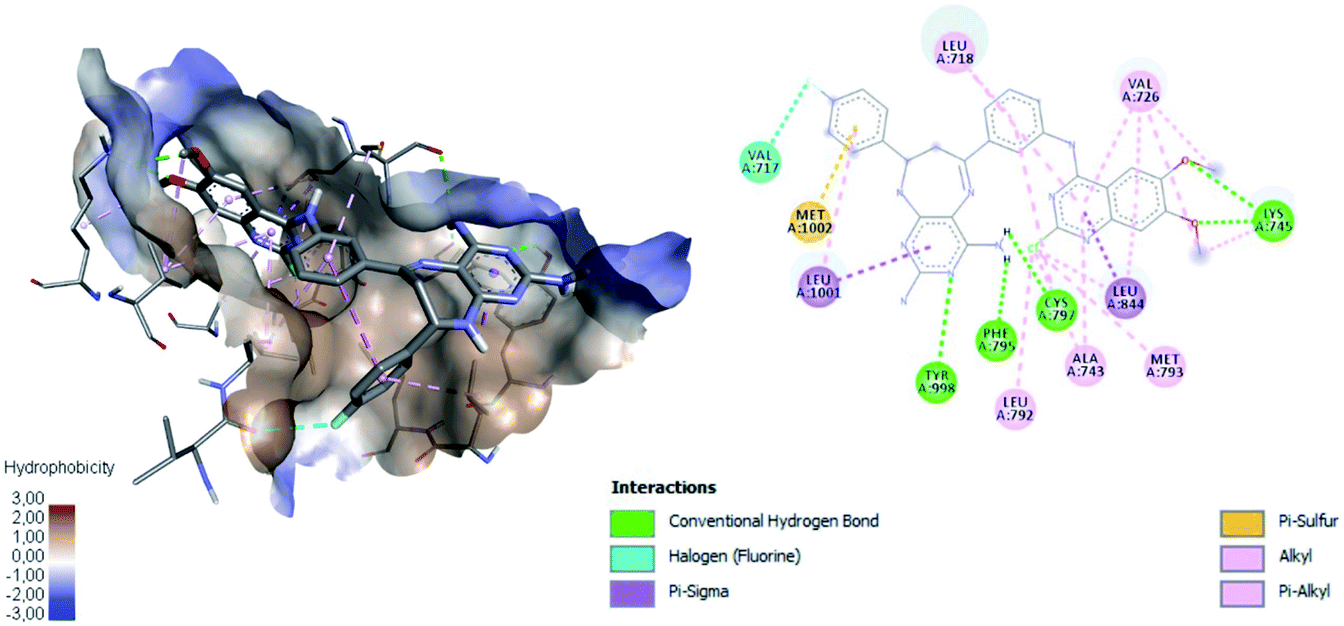 | ||
| Fig. 11 Interaction between 16c and EGFR using the hydrophobicity scale and 2D plot. | ||
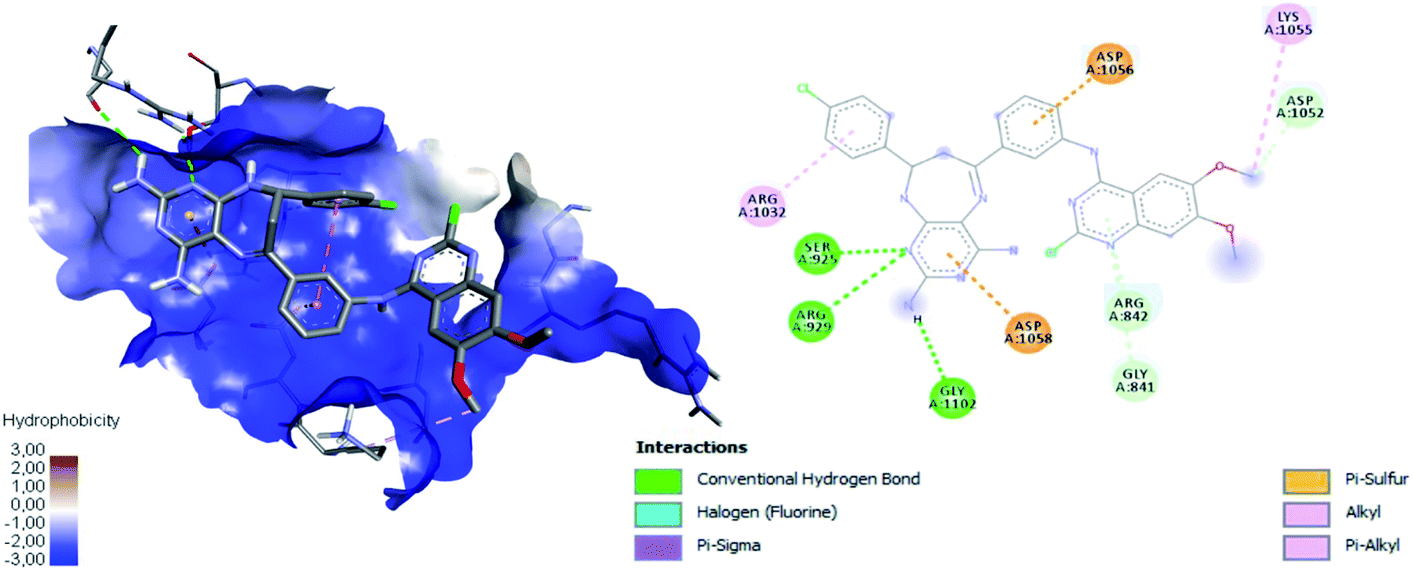
Fig. 12 shows the interaction between compound 16a and VEGFR-2, which was the molecule with the best binding energy to the VEGFR-2 receptor, showing a hydrophilic environment compared to the hydrophobic environment of the previous interaction between 16c and EGFR. The residues that interact forming mainly hydrogen bonds with this compound 16a are Ser925, Arg929, Gly1102, Gly841, Asp1052, and Arg842 (Fig. 12). A few hydrophobic interactions are formed with Arg1032 and Lys1055.
 | ||
| Fig. 12 Interaction between 16a and VEGFR-2 using the hydrophobicity scale and 2D plot. | ||
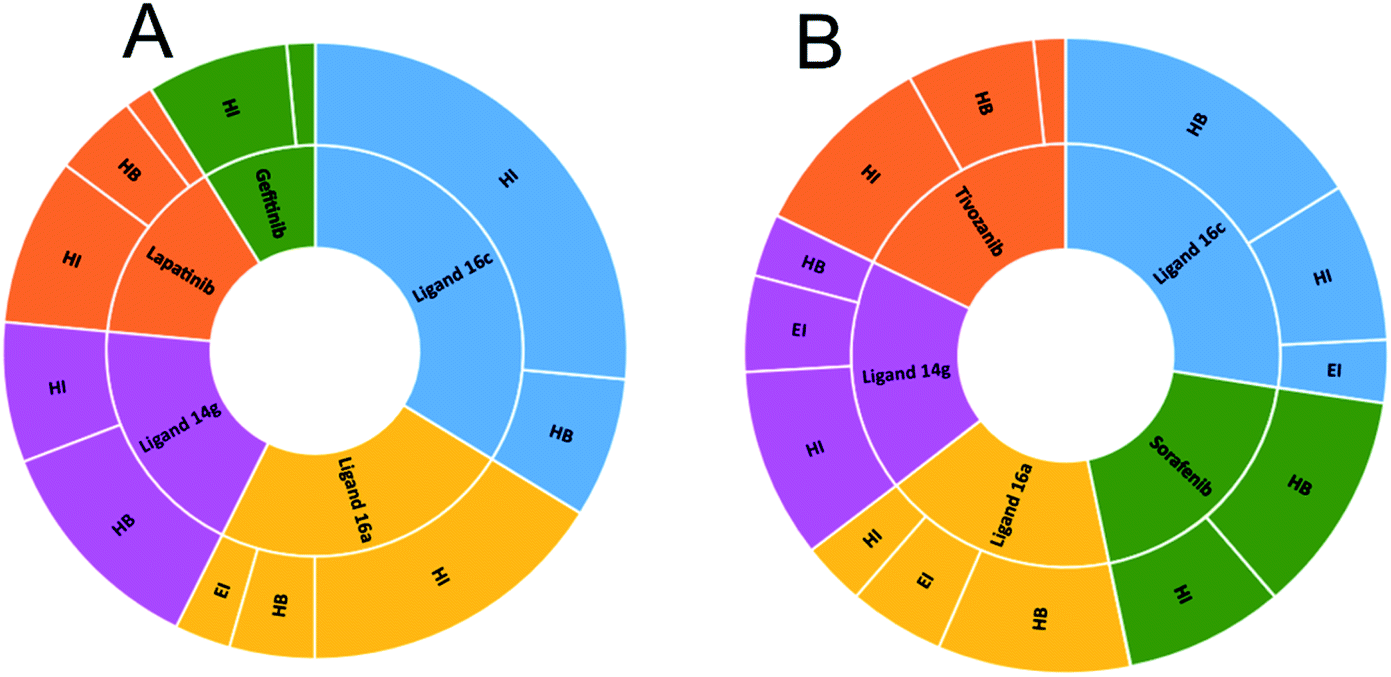
To observe if there are residues in common between the interactions of the ligands with EGFR and VEGFR-2 receptors, Fig. 13 and 14 were made with compounds 14g, 16a and 16c. Fig. 13A shows that Arg776 from the EGFR receptor has the most varied interactions because it presents hydrogen bridges, electrostatic and hydrophobic interactions mainly with ligands 14g and 16a. Leu1017 is interacting with ligands 14g and 16a through hydrophobic interactions. Compounds 16a and 16c share hydrophobic interaction with residue Leu844. Fig. 13B shows that 16a shares residues in common with 14g such as Arg776 and Leu1017.
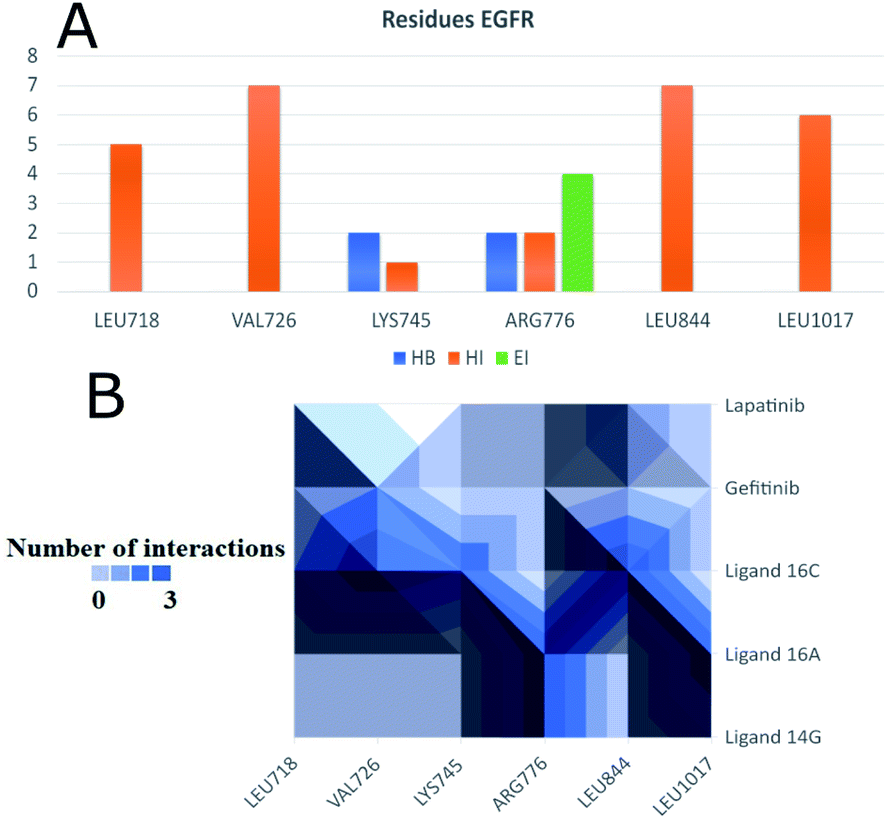 | ||
| Fig. 13 Most frequent residues in interactions with the EGFR receptor. (A) Most frequent residues in interacting with EGFR and the type of interaction. (B) Heatmap of most frequent residues interacting with ligands and controls. HI: hydrophobic interactions; HB: hydrogen bonds; EI: electrostatic interactions. | ||
 | ||
| Fig. 14 Most frequent residues in interactions with the VEGFR-2 receptor. (A) Most frequent residues in interacting with VEGFR-2 and the type of interaction. (B) Heatmap of most frequent residues interacting with ligands and controls. HI: hydrophobic interactions; HB: hydrogen bonds; EI: electrostatic interactions. | ||
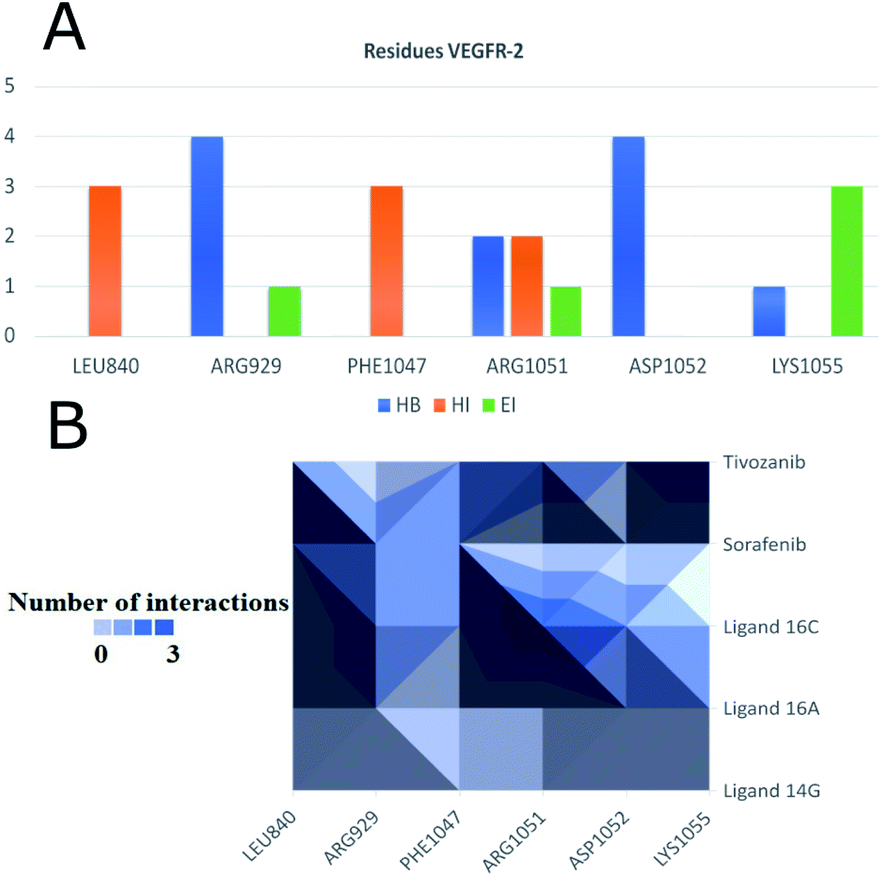
Fig. 14 shows the residues that have the most interactions with VEGFR-2 and ligands including the controls sorafenib and tivozanib. Arg1051 comes to form three different interactions, hydrogen bridges, electrostatic and hydrophobic interactions, mainly with ligand 16c and tivozanib. The highest number of interactions (4) of the Arg929 ligand has been with ligands 16a, 16c and sorafenib. Similarly, residue Asp1052 forms a total of four interactions with ligands 16a, 16c and tivozanib.
2.6 Molecular dynamics studies
The MD simulation of ligands 14g and 16c with DNA was performed to investigate the DNA-ligand interactions. Fig. 15 shows the RMSD of both molecules, being stable during the first 2 ns. Ligand 14g from 3 ns onwards starts to vary the stability of its structure by 0.10 nm approximately until 6 ns, this could be due to the intermittent interaction with DNA and surrounding water molecules. Fig. 16 shows the interactions of ligand 14g with DNA for 6 ns. Up to 4 ns, there is an interaction between the compound 14g and the nitrogenous bases adenine, cytosine, and guanine through hydrogen bonds is observed. However, at 6 ns the interaction with DNA stopped and the ligand 14g only form hydrogen bonds with water. Ligand 16c presents two peaks at 3 and 4 ns going from 0.14 to 0.35 nm due to high interaction with water molecules as shown in Fig. 15, also there are interactions between the pyrimidodiazepine moiety of ligand 16c with cytosine and guanine up to 6 ns, then it interacts mainly with water molecules. A transient interaction with DNA is observed (Fig. 17).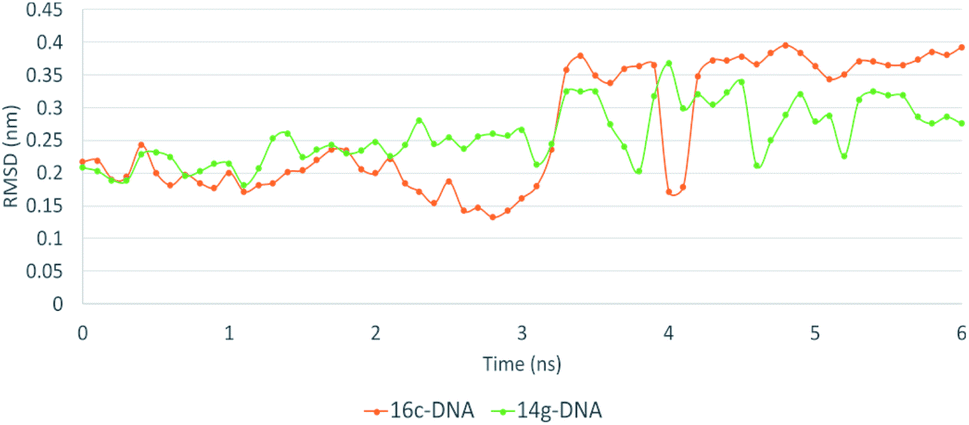 | ||
| Fig. 15 RMSD of ligand interactions 14g-DNA and 16c-DNA. | ||
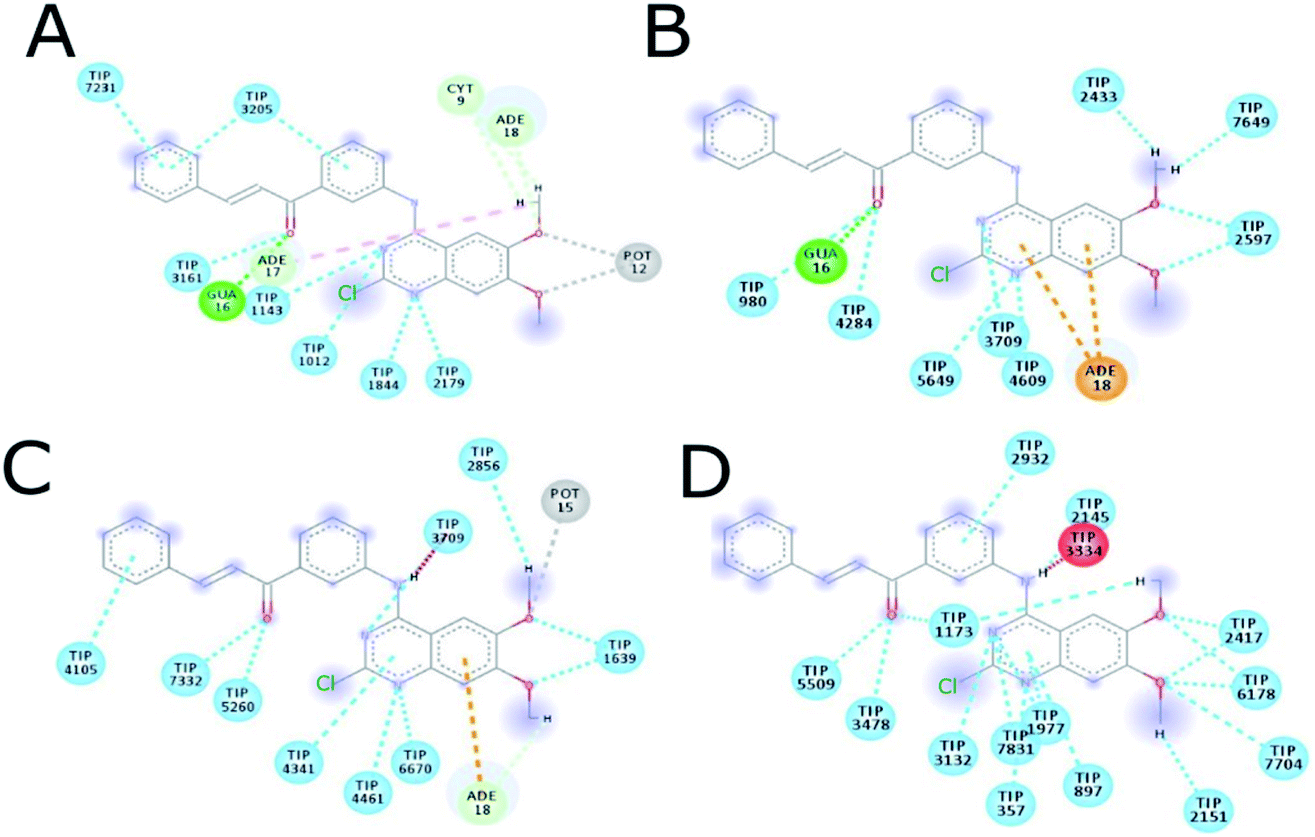 | ||
| Fig. 16 Intermolecular interactions between 14g and DNA. (A) 1 ns, (B) 2 ns, (C) 4 ns, (D) 6 ns. CYT: cytosine, GUA: guanine, TIP: water molecule, POT: potassium ion. | ||
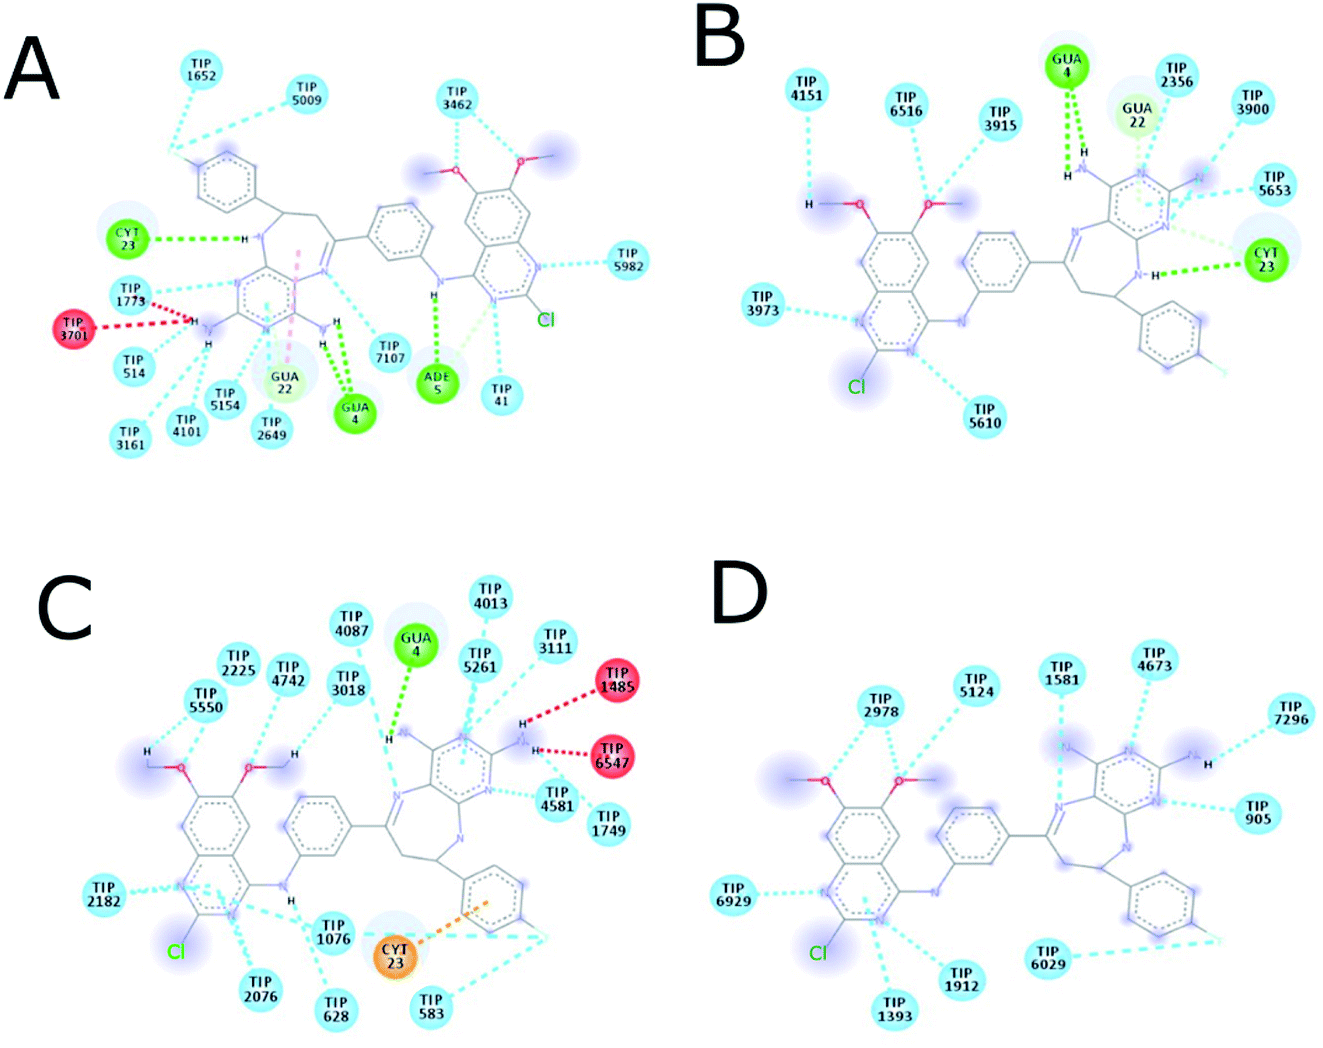 | ||
| Fig. 17 Intermolecular interactions between 16c and DNA. (A) 1 ns, (B) 2 ns, (C) 4 ns, (D) 6 ns. ADE: adenine; CYT: cytosine; GUA: guanine; TIP: water molecule. | ||
Fig. 18 shows the frequency of the type of interaction between 14g and 16c with DNA. Hydrogen bonds are the most frequent in the interactions of ligands 14g and 16c with DNA, followed by a higher frequency of the interaction with water molecules. Halogenated bond formation is also observed by the 2-chlorine atom of quinazoline present in the 16c for the interaction with DNA. If we compare to which type of nitrogenous bases ligands 14g and 16c bind during the 6 ns, the quinazoline moiety of 14g presents a constant interaction with adenines (ADE17, ADE18) forming both hydrogen bonds and hydrophobic interactions, while ligand 16c only interacted with one adenine (ADE5).
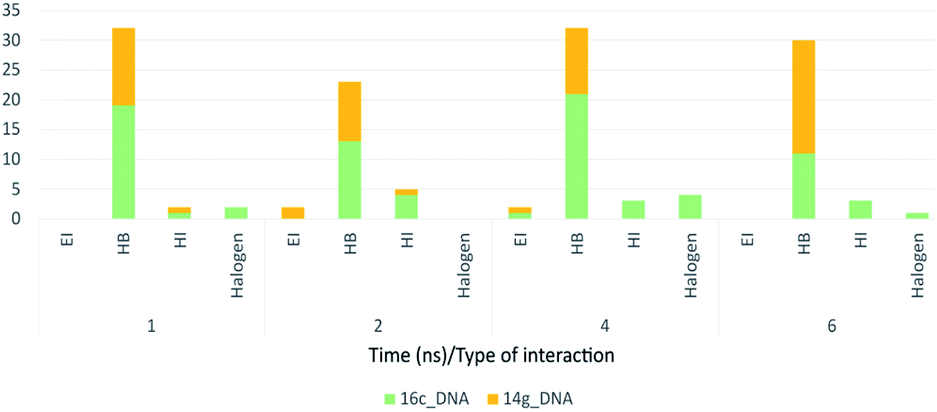 | ||
| Fig. 18 Frequency of type of interaction between ligand-receptor 14g-DNA and 16c-DNA during 6 ns. HI: hydrophobic interactions; HB: hydrogen bonds; EI: electrostatic interactions. | ||
Moreover, the interactions of ligand 16c with EGFR (Fig. 19A), presenting a range between 0.10 and 0.15 nm, mainly to quinazoline moiety forms sustained interactions with residues Val726, Ala743, Leu844, Leu792, and Met1002 for 10 ns.
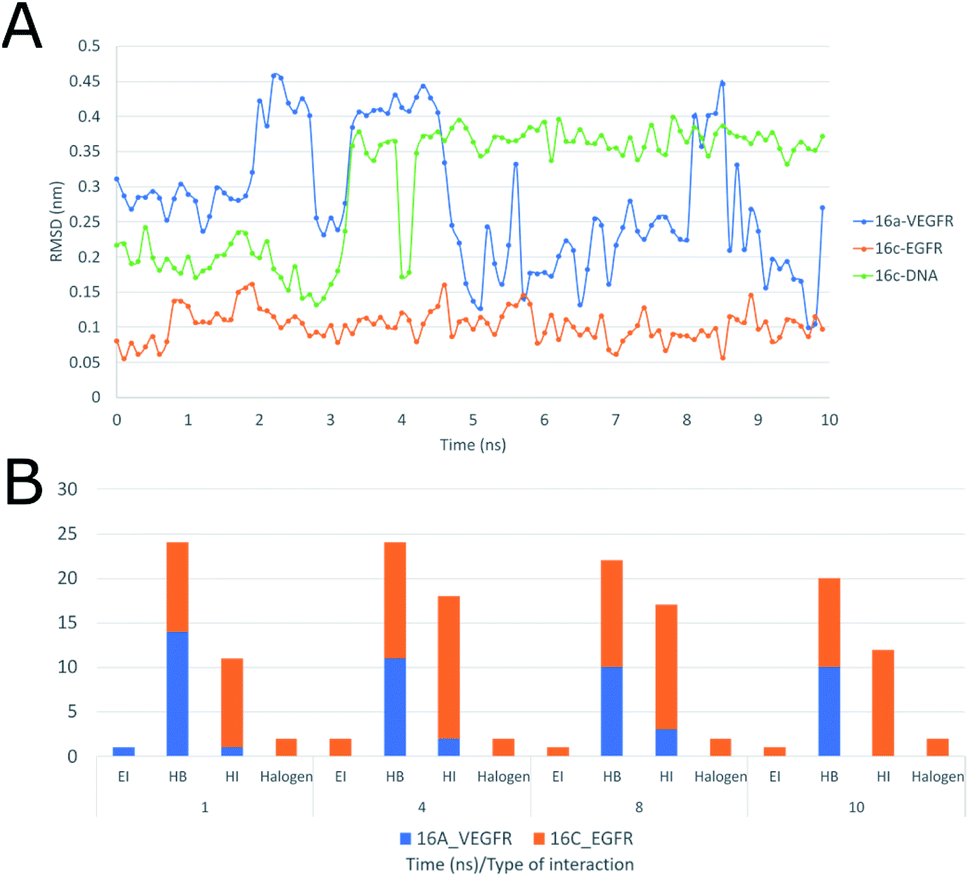 | ||
| Fig. 19 (A) RMSD of ligand interactions 16a-VEGFR, 16c-EGFR, 16c-DNA. (B) Frequency of type of interactions between ligand-receptor 16c-EGFR and 16a-VEGFR during 10 ns, HI: hydrophobic interactions; HB: hydrogen bonds; EI: electrostatic interactions. | ||
Moreover, Fig. 19A shows the interaction of 16a with VEGFR-2 is unstable with wide ranges of variation in the conformation of the structure with peaks at 2, 3, 5 and 8 ns, ranging from 0.10 to 0.45 nm, and this is due to the strong interaction with water, which goes from having four hydrogen bonds in the first 2 ns to having more than six with water molecules after 4 ns, maintaining this trend up to 10 ns. Regarding the frequency of those type of interaction between the ligand 16c with EGFR shows an almost constant trend into the active site with hydrophobic interactions during the 10 ns (Fig. 19A). Halogenated bond formation is also observed by the 2-chlorine atom of the quinazoline 16c for both the interaction with EGFR and DNA, which could induce an additive or synergistic effect in antiproliferative activity.52 Further, the interaction of 16a into VEGFR-2 receptor, presents the same tendency of hydrogen bond formation but in smaller number in comparison to 16c-DNA.
3. Conclusions
The anticancer activity of the new series of quinazoline-chalcones 14a–g and pyrimidodiazepines 16a–g against 60 cancer cell lines of different panels of human tumor revealed that most of the assayed compounds exhibited significant growth inhibition percentages and lethality especially compounds 14g, 16a and 16c. The results showed that quinazoline-chalcone 14g exhibited high antiproliferative activity being effective against leukemia cell line K-562 with a GI50 value of 0.622 μM. Compounds 16a and 16c showed better cytostatic (TGI) and/or cytotoxic activity (LC50) than adriamycin/doxorubicin against HL-60(TB) (leukemia), HCT-116 (colon cancer), HCT-15 (colon cancer), SW-620 (colon cancer), OVCAR-3 (ovarian cancer), OVCAR-4 (ovarian cancer), ACHN (renal cancer), CAKI-1 (renal cancer), DU-145 (prostate cancer) and MDA-MB-231/ATCC (breast cancer), where compound 16c showed better LC50 values than adriamycin/doxorubicin, being 10.0-fold more active against ten cancer cell lines. DNA binding study has shown that compounds 14g and 16c may interact with the DNA strands through groove binding with binding constant (Kb) of 9.3 × 10³ and 7.1 × 10³ M−1, respectively. These results suggest that compound 14g has more prominent interaction with DNA than CCNU (lomustine). Molecular docking study was carried out for DNA, EGFR, and VEGFR-2 receptors, showing that the compounds 14g, 16c and 16a have better binding energies of −8.30, −9.90 and −9.20 kcal mol−1, respectively, including mainly hydrogen bonds and hydrophobic interactions. Also, compounds 14g and 16c interacted with DNA through intercalation and groove binding, according to binding constant (Kb) and docking results. Finally, the interactions of ligand 16c with EGFR showed an almost constant trend into the active site with hydrophobic interactions with residues Val726, Ala743, Leu844, Leu792, and Met1002 by molecular dynamics simulation. All these findings may help to understand the possible mechanism of action of those quinazoline derivatives.4. Experimental section
4.1 General information
Reagents and solvents used were purchased from Sigma-Aldrich. Reactions were monitored by TLC on Merck silica gel 60 F254 aluminum plates. Melting points were measured in open glass capillaries using a Stuart SMP10 melting point apparatus. Attenuated total reflection (ATR)-FTIR spectra were obtained on a Shimadzu IRAffinity-1. 1H and 13C NMR spectra were run on a BRUKER DPX 400 spectrometer operating at 400 and 100 MHz, respectively, using DMSO-d6 as solvent and tetramethylsilane as internal standard. Mass spectra were obtained on a SHIMADZU-GCMS-QP2010 spectrometer operating at 70 eV. The elemental analyses were performed using a Thermo Finnigan Flash EA1112 CHN (STIUJA) elemental analyzer. The original NMR spectra of representative compounds of series are provided as ESI.†4.2 Chemistry
:water (6:4) to provide the 2-chloro-4-anilinoquinazoline 11 as a white solid, which did not require further purification. White solid; 45% yield; mp 239–241 °C; FTIR (ATR) ν(cm−1): 3447 (N–H), 3082 (C–H), 1674 (CO), 1512 and 1433 (CN and CC). 1H NMR (400 MHz, DMSO-d6) δ ppm 9.12 (s, 1H, NH), 7.46 (s, 1H, HBo′), 7.26 (d, J = 7.9 Hz, 1H, HBo), 7.03 (s, 1H, H-5), 6.93 (d, J = 7.7 Hz, 1H, HBp), 6.74 (t, J = 7.9 Hz, 1H, HBm), 6.33 (s, 1H, H-8), 3.12 (s, 3H, OCH3), 3.09 (s, 3H, OCH3), 1.78 (s, 3H, COCH3). 13C NMR (100 MHz, DMSO-d6) δ ppm 197.6, 157.8, 155.1, 154. 0, 149.1, 148.3, 139.1, 137.2, 129.0, 127.0, 124.1, 121.6, 107.3, 106.7, 102.2, 56.3, 56.0, 26.8. MS (EI): m/z 357/359 [M+/M + 2+] (82/27), 356/358 (66/38), 322 (36), 43 (100). Anal. calcd. For C18H16ClN3O3: C, 60.43; H, 4.51; N, 11.74. Found: C, 60.52; H, 4.71; N, 11.65.:water (1:1) to provide the 4-anilinoquinazoline 12 as a white solid, which did not require further purification. White solid; 63% yield; mp 258–260 °C; FTIR (ATR) ν(cm−1): 3377 (N–H), 3211 (C–H), 1681 and 1639 (CO), 1560 and 1479 (CN and CC). 1H NMR (400 MHz, DMSO-d6) δ ppm 10.71 (s, 1H, NH), 8.77 (s, 1H, NH), 8.25–7.99 (m, 3H, 2× HBo′, H-5), 7.75–7.13 (m, 5H, 2× HBo, 2× HBp, HBm), 6.90–6.76 (m, 2H, HBm, H-8), 3.88 (s, 3H, OCH3), 3.82 (s, 3H, OCH3), 2.60 (s, 6H, 2× COCH3). 13C NMR (100 MHz, DMSO-d6) δ ppm 197.7, 162.4, 161.0, 154.9, 154.8, 150.4, 146.7, 146.3, 145.0, 139.6, 137.4, 136.5, 129.2, 123.6, 122.1, 118.4, 110.7, 107.1, 106.5, 105.5, 97.8, 55.8, 55.6, 26.8. MS (EI): m/z 456 [M+] (1.82), 353 (19), 339 (99), 324 (100), 164 (48), 43 (100). Anal. calcd. For C26H24N4O4: C, 68.41; H, 5.30; N, 12.27. Found: C, 68.59; H, 5.45; N, 12.39.4.2.3.1. (E)-1-(3-((2-Chloro-6,7-dimethoxyquinazolin-4-yl)amino)phenyl)-3-(4-chlorophenyl)prop-2-en-1-one (14a). Pale yellow solid; 85% yield; mp 230–232 °C; FTIR (ATR) ν(cm−1): 3304 (N–H), 3030 (
C–H), 1658 (CO), 1595 and 1577 (CN and CC). 1H NMR (400 MHz, DMSO-d6) δ ppm 10.00 (s, 1H, NH), 8.43 (s, 1H, HBo′), 8.15 (d, J = 8.1 Hz, 1H, HBo), 8.06–7.84 (m, 5H, Hβ, H-5, HCo, HBp), 7.78 (d, J = 15.5 Hz, 1H, Hα), 7.63 (t, J = 8.1 Hz, 1H, HBm), 7.53 (d, J = 8.0 Hz, 2H, HCm), 7.18 (s, 1H, H-8), 3.97 (s, 3H, OCH3), 3.93 (s, 3H, OCH3). 13C NMR (100 MHz, DMSO-d6) δ ppm 188.8, 157.8, 155.0, 154.1, 149.1, 148.3, 142.7, 139.3, 137.9, 135.2, 133.6, 130.5, 129.1, 128.9, 127.1, 124.4, 122.7, 122.0, 107.3, 106.6, 102.2, 56.3, 56.0. MS (EI): m/z 479/481/483 [M+/M + 2+/M + 4+] (12/11/1), 478/480/482 (4/6/2), 165 (34), 137 (71), 102 (100). Anal. calcd. For C25H19Cl2N3O3: C, 62.51; H, 3.99; N, 8.75. Found: C, 62.64; H, 4.32; N, 8.53.
4.2.3.2. (E)-3-(4-Bromophenyl)-1-(3-((2-chloro-6,7-dimethoxyquinazolin-4-yl)amino)phenyl)prop-2-en-1-one (14b). Pale yellow solid; 68% yield; mp 197–199 °C; FTIR (ATR) ν(cm−1): 3305 (N–H), 3018 (
C–H), 1659 (CO), 1597 and 1573 (CN and CC). 1H NMR (400 MHz, DMSO-d6) δ ppm 10.39 (s, 1H, NH), 8.42 (s, 1H, HBo′), 8.13 (d, J = 8.2 Hz, 1H, HBo), 8.01–7.91 (m, 2H, HBp, Hβ), 7.90–7.81 (m, 3H, H-5, HCo), 7.75 (d, J = 15.2 Hz, 1H, Hα), 7.65 (d, J = 8.4 Hz, 2H, HCm), 7.63 (t, J = 7.8 Hz, 1H, HBm), 7.15 (s, 1H, H-8), 3.95 (s, 3H, OCH3), 3.92 (s, 3H, OCH3). 13C NMR (100 MHz, DMSO-d6) δ ppm 188.9, 157.9, 155.0, 154.1, 150.4, 149.1, 148.3, 145.0, 142.8, 137.9, 136.6, 131.9, 130.9, 130.8, 129.1, 129.0, 122.8, 121.7, 107.4, 106.7, 102.2, 56.3, 56.0. MS (EI): m/z 523/525/527 [M+/M + 2+/M + 4+] (12/16/4), 488/490 (2/1), 209/211 (7/6), 102 (100). Anal. calcd. For C25H19BrClN3O3: C, 57.22; H, 3.65; N, 8.01. Found: C, 57.31; H, 3.58; N, 8.15.
4.2.3.3. (E)-1-(3-((2-Chloro-6,7-dimethoxyquinazolin-4-yl)amino)phenyl)-3-(4-fluorophenyl)prop-2-en-1-one (14c). Yellow solid; 51% yield; mp 228–230 °C; FTIR (ATR) ν(cm−1): 3385 (N–H), 3005 (
C–H), 1653 (CO), 1598 and 1571 (CN and CC). 1H NMR (400 MHz, DMSO-d6) δ ppm 10.00 (s, 1H, NH), 8.43 (s, 1H, HBo′), 8.15 (d, J = 8.1 Hz, 1H, HBo), 8.07–7.72 (m, 6H, HBp, Hβ, H-5, HCo, Hα), 7.64 (t, J = 8.1 Hz, 1H, HBm), 7.32 (t, J = 8.8 Hz, 2H, HCo), 7.18 (s, 1H, H-8), 3.97 (s, 3H, OCH3), 3.93 (s, 3H, OCH3). 13C NMR (100 MHz, DMSO-d6) δ ppm 188.8, 163.4 (d, 1JC–F = 249.0 Hz, C), 157.8, 155.0, 149.1, 143.0, 139.3, 138.0, 131.3, 131.2 (d, 3JC–F = 8.8 Hz, CH), 130.8 (d, 4JC–F = 2.6 Hz, C), 129.0, 127.1, 124.4, 122.0, 121.9, 115.9 (d, 2JC–F = 21.7 Hz, CH), 114.8, 107.3, 106.6, 102.2, 56.3, 56.0. MS (EI): m/z 463/465 [M+/M + 2+] (23/8), 149 (45), 121 (83), 101 (100). Anal. calcd. For C25H19ClFN3O3: C, 64.73; H, 4.13; N, 9.06. Found: C, 64.83; H, 4.16; N, 9.19.
4.2.3.4. (E)-3-(Benzo[d][1,3]dioxol-5-yl)-1-(3-((2-chloro-6,7-dimethoxyquinazolin-4-yl)amino)phenyl)prop-2-en-1-one (14d). Yellow solid; 58% yield; mp 252–254 °C; FTIR (ATR) ν(cm−1): 3358 (N–H), 3097 (
C–H), 1635 (CO), 1599 and 1579 (CN and CC). 1H NMR (400 MHz, DMSO-d6) δ ppm 10.03 (s, 1H, NH), 8.42 (s, 1H, HBo′), 8.14 (d, J = 7.7 Hz, 1H, HBo), 8.03–7.57 (m, 5H, HBp, H-5, Hβ, Hα, HCo), 7.35 (d, J = 7.9 Hz, 1H, HCm′), 7.20 (s, 1H, H-8), 7.01 (d, J = 7.9 Hz, 1H, HCo′), 6.12 (s, 2H, O–CH2–O), 3.98 (s, 3H, OCH3), 3.94 (s, 3H, OCH3). 13C NMR (100 MHz, DMSO-d6) δ ppm 188.6, 157.9, 155.1, 154.1, 149.7, 149.1, 148.3, 148.1, 144.3, 139.2, 138.2, 129.1, 129.0, 127.0, 126.0, 124.4, 122.1, 119.9, 108.6, 107.3, 106.9, 106.7, 102.2, 101.7, 56.3, 56.0. MS (EI): m/z 222 (40), 207 (17), 136 (42), 43 (100). Anal. calcd. For C26H20ClN3O5: C, 63.74; H, 4.12; N, 8.58. Found: C, 63.65; H, 4.18; N, 8.63.
4.2.3.5. (E)-1-(3-((2-Chloro-6,7-dimethoxyquinazolin-4-yl)amino)phenyl)-3-(4-methoxyphenyl)prop-2-en-1-one (14e). Yellow solid; 56% yield; mp 217–218 °C; FTIR (ATR) ν(cm−1): 3365 (N–H), 3078 (
C–H), 1635 (CO), 1581 and 1558 (CN and CC). 1H NMR (400 MHz, DMSO-d6) δ ppm 10.18 (s, 1H, NH), 8.40 (s, 1H, HBo′), 8.08 (d, J = 8.8 Hz, 1H, HBo), 7.96–7.75 (m, 6H, HBp, Hβ, HCo, H-5, Hα), 7.59 (t, J = 8.4 Hz, 1H, HBm), 7.13 (s, 1H, H-8), 7.02 (d, J = 8.2 Hz, 2H, HCm), 3.95 (s, 3H, OCH3), 3.92 (s, 3H, OCH3), 3.82 (s, 3H, p-OCH3). 13C NMR (100 MHz, DMSO-d6) δ ppm 188.8, 161.5, 158.0, 154.8, 154.5, 148.9, 148.2, 144.1, 138.3, 137.2, 130.8, 128.9, 127.3, 127.0, 123.7, 122.2, 119.5, 114.5, 108.0, 106.6, 102.6, 56.2, 56.0, 55.4. MS (EI): m/z 475/477 [M+/M + 2+] (62/21), 446 (15), 440 (13), 161 (70), 133 (100), 118 (52). Anal. calcd. For C26H22ClN3O4: C, 65.62; H, 4.66; N, 8.83. Found: C, 65.76; H, 4.81; N, 8.75.
4.2.3.6. (E)-1-(3-((2-Chloro-6,7-dimethoxyquinazolin-4-yl)amino)phenyl)-3-(3,4,5-trimethoxyphenyl)prop-2-en-1-one (14f). Yellow solid; 61% yield; mp 178–180 °C; FTIR (ATR) ν(cm−1): 3363 (N–H), 3001 (
C–H), 1653 (CO), 1582 and 1575 (CN and CC). 1H NMR (400 MHz, DMSO-d6) δ ppm 9.87 (s, 1H, NH), 8.33 (s, 1H, HBo′), 8.05 (d, J = 8.1 Hz, 1H, HBo), 7.93 (d, J = 7.7 Hz, 1H, HBp), 7.90–7.82 (m, 3H, Hβ, H-5), 7.73 (d, J = 15.5 Hz, 1H, Hα), 7.59 (t, J = 7.9 Hz, 1H, HBm), 7.23 (s, 2H, HCo), 7.10 (s, 1H, H-8), 3.94 (s, 3H, OCH3), 3.91 (s, 3H, OCH3), 3.86 (s, 6H, m-OCH3), 3.72 (s, 3H, p-OCH3). 13C NMR (100 MHz, DMSO-d6) δ ppm 189.1, 158.1, 154.7, 154.6, 153.1, 150.7, 148.6, 148.1, 144.9, 144.6, 139.8, 138.1, 130.2, 128.9, 127.3, 123.6, 122.3, 121.4, 106.6, 106.5, 102.8, 60.2, 60.1, 56.2, 55.9. MS (EI): m/z 535/537 [M+/M + 2+] (100/35), 520/522 (52/18), 500 (10), 135 (31), 77 (41). Anal. calcd. For C28H26ClN3O6: C, 62.75; H, 4.89; N, 7.84. Found: C, 62.84; H, 4.93; N, 7.94.
4.2.3.7. (E)-1-(3-((2-Chloro-6,7-dimethoxyquinazolin-4-yl)amino)phenyl)-3-phenylprop-2-en-1-one (14g). Yellow solid; 57% yield; mp 156–158 °C; FTIR (ATR) ν(cm−1): 3294 (N–H), 3014 (
C–H), 1653 (CO), 1591 and 1577 (CN and CC). 1H NMR (400 MHz, DMSO-d6) δ ppm 10.01 (s, 1H, NH), 8.46 (s, 1H, HBo′), 8.14 (d, J = 8.0 Hz, 1H, HBo), 8.02–7.85 (m, 5H, Hβ, HBp, HCm, H-5), 7.80 (d, J = 15.6 Hz, 1H, Hα), 7.63 (t, J = 7.9 Hz, 1H, HBm), 7.51–7.42 (m, 3H, HCo, HCp), 7.17 (s, 1H, H-8), 3.97 (s, 3H, OCH3), 3.93 (s, 3H, OCH3). 13C NMR (100 MHz, DMSO-d6) δ ppm 188.9, 157.9, 155.1, 154.1, 149.1, 148.3, 144.3, 139.3, 138.0, 134.6, 130.7, 129.1, 129.0, 128.9, 127.0, 124.3, 122.0, 121.9, 107.3, 106.7, 102.2, 56.3, 56.0. MS (EI): m/z 445/447 [M+/M + 2+] (100/30), 410 (31), 380 (23), 131 (46), 103 (82). Anal. calcd. For C25H20ClN3O3: C, 67.34; H, 4.52; N, 9.42. Found: C, 67.48; H, 4.61; N, 9.48.
:1). These fractions required an additional purification by silica gel column chromatography using ethyl acetate/methanol (10:1).
4.2.4.1. 6-(3-((2-Chloro-6,7-dimethoxyquinazolin-4-yl)amino)phenyl)-8-(4-chlorophenyl)-8,9-dihydro-7H-pyrimido[4,5-b][1,4]diazepine-2,4-diamine (16a). Yellow solid; 58% yield; mp 206–208 °C; FTIR (ATR) ν(cm−1): 3481, 3460, 3371 (N–H), 1568 and 1558 (C
N and CC). 1H NMR (400 MHz, DMSO-d6) δ ppm 9.78 (s, 1H, NH), 8.04 (s, 1H, HBo′), 7.85 (s, 1H, H-5), 7.65 (dd, J = 8.0, 1.6 Hz, 1H, HBp), 7.39–7.25 (m, 2H, HBo, HBm), 7.23 (d, J = 8.8 Hz, 2H, HCo), 7.18 (d, J = 8.8 Hz, 2H, HCm), 7.16 (s, 1H, H-8), 7.09 (d, J = 5.8 Hz, 1H, NH), 6.21 (s, 2H, 4-NH2), 5.69 (d, J = 3.9 Hz, 2H, 2-NH2), 5.07 (dt, J = 6.6, 3.9 Hz, 1H, H8′), 3.93 (s, 3H, OCH3), 3.93–3.81 (m, 4H, OCH3, H7b′), 2.82 (dd, J = 14.9, 6.8 Hz, 1H, H7a′). 13C NMR (100 MHz, DMSO-d6) δ ppm 163.7, 160.4, 157.9, 154.9, 154.7, 154.5, 154.3, 153.3, 150.3, 149.0, 148.2, 146.8, 143.0, 141.3, 138.3, 131.1, 128.0, 127.8, 122.0, 120.0, 106.6, 102.4, 101.4, 56.6, 56.3, 56.0, 38.6. MS (EI): m/z 601/603/605 [M+/M + 2+/M + 4+] (2.81/1/1), 577 (6), 551 (5), 43 (100). Anal. calcd. For C29H25Cl2N9O2: C, 57.81; H, 4.18; N, 20.92. Found: C, 58.12; H, 4.04; N, 21.20.
4.2.4.2. 8-(4-Bromophenyl)-6-(3-((2-chloro-6,7-dimethoxyquinazolin-4-yl)amino)phenyl)-8,9-dihydro-7H-pyrimido[4,5-b][1,4]diazepine-2,4-diamine (16b). Yellow solid; 50% yield; mp 254–255 °C; FTIR (ATR) ν(cm−1): 3473, 3352 (N–H), 1567 and 1554 (C
N and CC). 1H NMR (400 MHz, DMSO-d6) δ ppm 9.81 (s, 1H, NH), 8.05 (s, 1H, HBo′), 7.86 (s, 1H, H-5), 7.67 (d, J = 7.7 Hz, 1H, HBp), 7.40–7.26 (m, 4H, HCo, HBo, HBm), 7.19–7.06 (m, 4H, HCm, H-8, NH), 6.27 (s, 2H, 4-NH2), 5.75 (s, 2H, 2-NH2), 5.05 (t, J = 5.8 Hz, 1H, H8′), 3.94 (s, 3H, OCH3), 3.94–3.84 (m, 4H, OCH3, H7b′), 2.83 (dd, J = 14.6, 6.7 Hz, 1H, H7a′). 13C NMR (100 MHz, DMSO-d6) δ ppm 163.7, 160.4, 157.9, 155.0, 154.7, 154.6, 154.3, 153.3, 149.0, 148.4, 148.2, 146.8, 143.4, 141.3, 138.4, 130.9, 128.2, 120.0, 119.7, 107.3, 102.4, 101.4, 56.6, 56.3, 56.0, 39.5, 38.6. MS (EI): m/z 645/647/649 [M+/M + 2+/M + 4+] (1/1.4/0.5), 563 (1), 184 (10), 91 (54), 43 (100). Anal. calcd. For C29H25BrClN9O2: C, 53.84; H, 3.90; N, 19.49. Found: C, 53.46; H, 3.67; N, 20.01.
4.2.4.3. 6-(3-((2-Chloro-6,7-dimethoxyquinazolin-4-yl)amino)phenyl)-8-(4-fluorophenyl)-8,9-dihydro-7H-pyrimido[4,5-b][1,4]diazepine-2,4-diamine (16c). Yellow solid; 55% yield; mp 241–242 °C; FTIR (ATR) ν(cm−1): 3483, 3363, 3248 (N–H), 1564 and 1554 (C
N and CC). 1H NMR (400 MHz, DMSO-d6) δ ppm 9.83 (s, 1H, NH), 8.08 (s, 1H, HBo′), 7.88 (s, 1H, H-5), 7.66 (d, J = 7.5 Hz, 1H, HBp), 7.36–7.26 (m, 2H, HBo, HBm), 7.21 (dd, J = 8.4, 4JH–F = 5.5 Hz, 2H, HCo), 7.16 (s, 1H, H-8), 7.11 (d, J = 5.7 Hz, 1H, NH), 7.00 (t, J = 8.7 Hz, 2H, HCm), 6.29 (s, 2H, 4-NH2), 5.76 (s, 2H, 2-NH2), 5.06 (t, J = 6.2 Hz, 1H, H8′), 3.95 (s, 3H, OCH3), 3.92 (s, 3H, OCH3), 3.83 (dd, J = 14.9, 6.0 Hz, 1H, H7b′), 2.85 (dd, J = 14.9, 6.8 Hz, 1H, H7a′). 13C NMR (100 MHz, DMSO-d6) δ ppm 163.6, 162.3, 160.9 (d, 1JC–F = 242.5 Hz, C), 157.9, 155.0, 154.6, 154.3, 153.6, 148.2, 141.3, 140.2, 138.3, 128.2, 127.8 (d, 3JC–F = 7.5 Hz, CH), 122.5, 122.1 (d, 4JC–F = 3.2 Hz, C), 120.1, 114.7 (d, 2JC–F = 21.4 Hz, CH), 107.3, 106.7, 102.4, 101.3, 56.7, 56.3, 56.0, 38.7. MS (EI): m/z 406 (2), 264 (2), 149 (13), 57 (60), 43 (100). Anal. calcd. For C29H25ClFN9O2: C, 59.44; H, 4.30; N, 21.51. Found: C, 60.11; H, 4.29; N, 21.47.
4.2.4.4. 8-(Benzo[d][1,3]dioxol-5-yl)-6-(3-((2-chloro-6,7-dimethoxyquinazolin-4-yl)amino)phenyl)-8,9-dihydro-7H-pyrimido[4,5-b][1,4]diazepine-2,4-diamine (16d). Yellow solid; 56% yield; mp 233–235 °C; FTIR (ATR) ν(cm−1): 3483, 3353 (N–H), 1568 and 1554 (C
N and CC). 1H NMR (400 MHz, DMSO-d6) δ ppm 9.83 (s, 1H, NH), 8.30 (s, 1H, HBo′), 7.87 (s, 1H, H-5), 7.68 (dd, J = 7.7, 2.4 Hz, 1H, HBp), 7.40 (d, J = 8.0 Hz, 1H, HBo), 7.32 (t, J = 7.9 Hz, 1H, HBm), 7.16 (s, 1H, H-8), 6.97 (d, J = 5.4 Hz, 1H, NH), 6.74 (d, J = 1.7 Hz, 1H, HCo), 6.72 (d, J = 8.0 Hz, 1H, HCm′), 6.65 (dd, J = 8.1, 1.8 Hz, 1H, HCo′), 6.27 (s, 2H, 4-NH2), 5.85 (d, J = 10.9 Hz, 2H, O–CH2–O), 5.73 (s, 2H, 2-NH2), 4.96 (td, J = 5.9, 2.1 Hz, 1H, H8′), 3.95 (s, 3H, OCH3), 3.92 (s, 3H, OCH3), 3.72 (dd, J = 14.7, 6.3 Hz, 1H, H7b′), 2.86 (dd, J = 14.7, 2.2 Hz, 1H, H7a′). 13C NMR (100 MHz, DMSO-d6) δ ppm 163.6, 160.3, 157.9, 154.9, 154.6, 154.3, 153.7, 149.0, 148.4, 148.2, 147.0, 145.8, 141.4, 138.3, 138.2, 128.2, 122.4, 122.1, 120.1, 119.0, 107.8, 107.3, 106.5, 102.3, 101.3, 100.7, 57.1, 56.3, 56.0, 38.9. MS (EI): m/z 611/613 [M+/M + 2+] (1/0.6), 527 (1), 148 (31), 89 (30), 50 (100). Anal. calcd. For C30H26ClN9O4: C, 58.87; H, 4.28; N, 20.60. Found: C, 59.07; H, 4.13; N, 21.08.
4.2.4.5. 6-(3-((2-Chloro-6,7-dimethoxyquinazolin-4-yl)amino)phenyl)-8-(4-methoxyphenyl)-8,9-dihydro-7H-pyrimido[4,5-b][1,4]diazepine-2,4-diamine (16e). Yellow solid; 51% yield; mp 208–210 °C; FTIR (ATR) ν(cm−1): 3473, 3371, 3352 (N–H), 1565 and 1554 (C
N and CC). 1H NMR (400 MHz, DMSO-d6) δ ppm 9.80 (s, 1H, NH), 8.04 (s, 1H, HBo′), 7.86 (s, 1H, H-5), 7.65 (d, J = 7.9 Hz, 1H, HBp), 7.38 (d, J = 8.1 Hz, 1H, HBo), 7.30 (t, J = 7.9 Hz, 1H, HBm), 7.17 (s, 1H, H-8), 7.10 (d, J = 8.8 Hz, 2H, HCo), 6.97 (d, J = 5.4 Hz, 1H, NH), 6.74 (d, J = 8.8 Hz, 2H, HCm), 6.25 (s, 2H, 4-NH2), 5.72 (s, 2H, 2-NH2), 4.97 (t, J = 5.7 Hz, 1H, H8′), 3.95 (s, 3H, OCH3), 3.93 (s, 3H, OCH3), 3.73 (dd, J = 14.9, 6.3 Hz, 1H, H7b′), 3.61 (s, 3H, p-OCH3), 2.87 (dd, J = 14.9, 5.4 Hz, 1H, H7a′). 13C NMR (100 MHz, DMSO-d6) δ ppm 163.6, 160.3, 157.9, 157.9, 155.0, 154.7, 154.3, 153.6, 149.0, 148.2, 141.5, 138.3, 136.2, 128.2, 127.0, 122.4, 122.1, 120.1, 113.4, 107.3, 106.7, 102.3, 101.3, 56.6, 56.3, 56.0, 54.9, 38.9. MS (EI): m/z 597/599 [M+/M + 2+] (6/2), 577 (6), 578 (6), 458 (7), 134 (100), 91 (64), 44 (83). Anal. calcd. For C30H28ClN9O3: C, 60.25; H, 4.72; N, 21.08. Found: C, 60.51; H, 4.19; N, 21.24.
4.2.4.6. 6-(3-((2-Chloro-6,7-dimethoxyquinazolin-4-yl)amino)phenyl)-8-(3,4,5-trimethoxyphenyl)-8,9-dihydro-7H-pyrimido[4,5-b][1,4]diazepine-2,4-diamine (16f). Yellow solid; 53% yield; mp 203–205 °C; FTIR (ATR) ν(cm−1): 3462, 3379, 3363 (N–H), 1571 and 1554 (C
N and CC). 1H NMR (400 MHz, DMSO-d6) δ ppm 9.82 (s, 1H, NH), 8.06 (s, 1H, HBo′), 7.86 (s, 1H, H-5), 7.66 (d, J = 8.0 Hz, 1H, HBp), 7.50 (d, J = 7.9 Hz, 1H, HBo), 7.34 (t, J = 6.8 Hz, 1H, HBm), 7.17 (s, 1H, H-8), 6.93 (d, J = 5.1 Hz, 1H, NH), 6.51 (s, 1H, HCo), 6.24 (s, 2H, 4-NH2), 5.72 (s, 2H, 2-NH2), 4.94 (t, J = 5.7 Hz, 1H, H8′), 3.94 (s, 3H, OCH3), 3.88 (s, 3H, OCH3), 3.78 (dd, J = 14.5, 6.8 Hz, 1H, H7b′), 3.57 (s, 6H, m-OCH3), 3.50 (s, 3H, p-OCH3), 2.89 (dd, J = 14.5, 3.8 Hz, 1H, H7a′). 13C NMR (100 MHz, DMSO-d6) δ ppm 163.5, 161.4, 158.6, 157.9, 157.1, 155.0, 154.4, 154.3, 152.5, 149.0, 148.2, 146.8, 141.4, 139.5, 138.3, 136.3, 128.1, 128.0, 122.2, 107.3, 106.7, 103.7, 102.4, 101.4, 56.4, 56.2, 56.0, 55.7, 38.9. MS (EI): m/z 657/659 [M+/M + 2+] (3/1), 653 (7), 435 (19), 241 (34), 194 (81), 179 (64), 43 (100). Anal. calcd. For C32H32ClN9O5: C, 58.40; H, 4.90; N, 19.16. Found: C, 58.65; H, 4.86; N, 19.42.
4.2.4.7. 6-(3-((2-Chloro-6,7-dimethoxyquinazolin-4-yl)amino)phenyl)-8-phenyl-8,9-dihydro-7H-pyrimido[4,5-b][1,4]diazepine-2,4-diamine (16g). Yellow solid; 50% yield; mp 238–240 °C; FTIR (ATR) ν(cm−1): 3473, 3371, 3311 (N–H), 1568 and 1554 (C
N and CC). 1H NMR (400 MHz, DMSO-d6) δ ppm 9.80 (s, 1H, NH), 8.05 (s, 1H, HBo′), 7.86 (s, 1H, H-5), 7.65 (d, J = 7.7 Hz, 1H, HBp), 7.34 (d, J = 7.9 Hz, 1H, HBo), 7.28 (t, J = 7.9 Hz, 1H, HBm), 7.22–7.17 (m, 4H, HCo, HCm), 7.16 (s, 1H, H-8), 7.12–7.02 (m, 2H, HCp, NH), 6.27 (s, 2H, 4-NH2), 5.75 (s, 2H, 2-NH2), 5.05 (t, J = 5.9 Hz, 1H, H8′), 3.94 (s, 3H, OCH3), 3.92 (s, 3H, OCH3), 3.81 (dd, J = 14.7, 6.3 Hz, 1H, H7b′), 2.86 (d, J = 14.5, 2.1 Hz, 1H, H7a′). 13C NMR (100 MHz, DMSO-d6) δ ppm 163.6, 160.3, 157.9, 154.9, 154.7, 154.3, 153.6, 149.0, 148.2, 144.0, 141.4, 138.3, 128.1, 128.0, 126.7, 125.9, 122.4, 122.1, 120.0, 107.3, 106.6, 102.4, 101.3, 57.2, 56.3, 56.0, 38.9. MS (EI): m/z 567/569 [M+/M + 2+] (1/0.2), 551 (1), 73 (100), 44 (76). Anal. calcd. For C29H26ClN9O2: C, 61.32; H, 4.61; N, 22.19. Found: C, 61.49; H, 4.52; N, 22.27.
4.3 Anticancer activity
The human cancer cell lines of the cancer screening panel were grown in an RPMI-1640 medium containing 5% fetal bovine serum and 2 mM L-glutamine. For a typical screening experiment, cells were inoculated into 96-well microtiter plates. After cell inoculation, the microtiter plates were incubated at 37 °C, 5% CO2, 95% air, and 100% relative humidity for 24 h prior to the addition of the tested compounds. After 24 h, two plates of each cell line were fixed in situ with TCA, to represent a measurement of the cell population for each cell line at the time of sample addition (Tz). The samples were solubilized in dimethyl sulfoxide (DMSO) at 400-fold the desired final maximum test concentration and stored frozen prior to use. At the time of compound addition, an aliquot of frozen concentrate was thawed and diluted to twice the desired final maximum test concentration with complete medium containing 50 μg mL−1 gentamicin. An additional four 10-fold or 1/2 log serial dilutions were made to provide a total of five drug concentrations plus the control. Aliquots of 100 μL of these different sample dilutions were added to the appropriate microtiter wells already containing 100 μL of medium, resulting in the required final sample concentrations.53 After the tested compounds were added, the plates were incubated for an additional 48 h at 37 °C, 5% CO2, 95% air, and 100% relative humidity. For adherent cells, the assay was terminated by the addition of cold TCA. Cells were fixed in situ by the gentle addition of 50 μL of cold 50% (w/v) TCA (final concentration, 10% TCA) and incubated for 60 min at 4 °C. The supernatant was discarded, and plates were washed five times with tap water and air dried. Sulforhodamine B (SRB) solution (100 μL) at 0.4% (w/v) in 1% acetic acid was added to each well, and plates were incubated for 10 min at room temperature. After staining, unbound dye was removed by washing five times with 1% acetic acid and the plates were air dried. Bound stain was subsequently solubilized with 10 mM Trizma base, and the absorbance was read on an automated plate reader at a wavelength of 515 nm. Using the seven absorbance measurements [time zero (Tz), control growth in the absence of drug (C), and test growth in the presence of drug at the five concentration levels (Ti)], the percentage growth was calculated at each of the drug concentrations levels. Percentage growth inhibition was calculated as: [(Ti − Tz)/(C − Tz)] × 100 for concentrations for which Ti > Tz, and [(Ti − Tz)/Tz] × 100 for concentrations for which Ti < Tz. Two dose–response parameters were calculated for each compound. Growth inhibition of 50% (GI50) was calculated from [(Ti − Tz)/(C − Tz)] × 100 = 50, which is the drug concentration resulting in a 50% lower net protein increase in the treated cells (measured by SRB staining) as compared to the net protein increase seen in the control cells and the LC50 (concentration of drug resulting in a 50% reduction in the measured protein at the end of the drug treatment as compared to that at the beginning), indicating a net loss of cells; calculated from [(Ti − Tz)/Tz] × 100 = −50. Values were calculated for each of these two parameters if the level of activity is reached; however, if the effect was not reached or was exceeded, the value for that parameter was expressed as greater or less than the maximum or minimum concentration tested.53–554.4 Hemolytic activity
The ability to induce hemolysis was evaluated to compounds that showed anticancer activity following the method of cytotoxicity by spectrophotometry. The method was adapted from Conceição et al.56 with modifications. Briefly, 240 μL of human red blood cells (huRBC) adjusted to 5% hematocrit in phosphate buffer saline (PBS) were placed into each well of 96-well plate and subsequently exposed to 200 μg mL−1 of the selected compounds (i.e., 10 μL of 5 mg mL−1 working solution of each compound in MHB with 5% DMSO 0.1% Tween-80). As positive control for hemolytic activity 10 μL SDS 1% was added. For a negative control only medium with no chemicals was added to huRBC. Free hemoglobin was measured after 24 h incubation at 37 °C by spectrophotometry (420 nm Cytation 3M, BioteK). Non-specific absorbance was subtracted from a blank. Determinations were done by triplicate in at least two independent experiments.4.5 DNA binding study
The binding properties of the compounds 14g and 16c with highly polymerized and lyophilized calf thymus DNA (ctDNA, type I, fibers, Sigma-Aldrich, Lot#SLBJ8916V PCode 1001817527) have been studied using electronic absorption experiments and viscosity measurements, following standard methodologies and procedures previously adopted by our laboratory.57 Stock solutions of ctDNA were prepared using a solution of Tris (10 mM) and EDTA (1 mM) in deionized water (pH = 7.5) and stored at −5 °C. Concentration was determined spectrophotometrically at 25 °C, using ε260 = 6600 L cm−1 mol−1 as molar extinction coefficient and measuring the absorbance at 260 nm. The purity of ctDNA was determined by monitoring the absorbance ratio at 260 nm to that at 280 nm. The observed A260/A280 ratio between 1.7 and 1.9 for ctDNA solutions indicates that the DNA was free of RNA and proteins.4.6 Molecular docking
4.7 Molecular dynamics simulation and analysis
Molecular dynamic simulations were performed with NAMD software version 2.14.64 The concentration of KCl was 0.15 M as determined by the Monte Carlo method, with water thickness of 22.5 Å and CHARMM36m as a force field.65 The systems were adjusted by slowly heating to a temperature of 310 K at 2 fs (femtosecond) per step for 75 ps (picoseconds). For equilibration 90000000 numsteps were used. Once the system is equilibrated at the desired temperature and pressure MD was ran for data collection for 10 ns. We used pymol for extract the molecules PDB at 1, 4, 8 and 10 ns and Discovery studio for the analysis of interactions.
Author contributions
Viviana Cuartas: methodology, experimental details, and writing original draft. Alberto Aragón-Muriel: methodology and experimental details. Yamil Liscano: experimental details, formal analysis and writing original draft. Dorian Polo-Cerón: conceptualization, resources, and writing – review & editing. Maria P. Crespo-Ortiz: experimental details. Jairo Quiroga: conceptualization and funding acquisition. Rodrigo Abonia: resources, funding acquisition. Braulio Insuasty: conceptualization, supervision, and writing – review & editing.Conflicts of interest
There are no conflicts to declare.Acknowledgements
The authors would like to thank the U.S. National Cancer Institute (NCI), for in vitro anticancer screening of the compounds. This research was supported by the Universidad del Valle, Universidad Santiago de Cali, MINCIENCIAS (110680864255) and the Science, Technology and Innovation Fund-General Royalties System (FCTeI-SGR) under contract BPIN 2013000100007.References
- H. A. Allam, E. E. Aly, A. K. B. A. W. Farouk, A. M. El Kerdawy, E. Rashwan and S. E. S. Abbass, Bioorg. Chem., 2020, 98, 103726 CrossRef CAS PubMed.
- M. D. Canela, S. Noppen, O. Bueno, A. E. Prota, K. Bargsten, G. Sáez-Calvo, M. L. Jimeno, M. Benkheil, D. Ribatti, S. Velázquez, M. J. Camarasa, J. Fernando Díaz, M. O. Steinmetz, E. M. Priego, M. J. Pérez-Pérez and S. Liekens, Oncotarget, 2017, 8, 14325–14342 CrossRef PubMed.
- WHO, Cancer, https://www.who.int/health-topics/cancer#tab=tab_1.
- B. Mansoori, A. Mohammadi, S. Davudian, S. Shirjang and B. Baradaran, Adv. Pharm. Bull., 2017, 7, 339–348 CrossRef CAS PubMed.
- M. Sun, J. Jia, H. Sun and F. Wang, Bioorg. Med. Chem. Lett., 2020, 30, 127045 CrossRef CAS PubMed.
- Y. Li, J. Xiao, Q. Zhang, W. Yu, M. Liu, Y. Guo, J. He and Y. Liu, Bioorg. Med. Chem., 2019, 27, 568–577 CrossRef CAS PubMed.
- S. A. Elmetwally, K. F. Saied, I. H. Eissa and E. B. Elkaeed, Bioorg. Chem., 2019, 88, 102944 CrossRef PubMed.
- G. Verma, M. F. Khan, W. Akhtar, M. M. Alam, M. Akhter, O. Alam, S. M. Hasan and M. Shaquiquzzaman, Arabian J. Chem., 2019, 12, 4815–4839 CrossRef CAS.
- N. Fayyazi, A. Fassihi, S. Esmaeili, S. Taheri, J. B. Ghasemi and L. Saghaie, Int. J. Biol. Macromol., 2020, 142, 94–113 CrossRef CAS PubMed.
- M. T. Conconi, G. Marzaro, L. Urbani, I. Zanusso, R. Di Liddo, I. Castagliuolo, P. Brun, F. Tonus, A. Ferrarese, A. Guiotto and A. Chilin, Eur. J. Med. Chem., 2013, 67, 373–383 CrossRef CAS PubMed.
- H. Q. Zhang, F. H. Gong, C. G. Li, C. Zhang, Y. J. Wang, Y. G. Xu and L. P. Sun, Eur. J. Med. Chem., 2016, 109, 371–379 CrossRef CAS PubMed.
- K. Abouzid and S. Shouman, Bioorg. Med. Chem., 2008, 16, 7543–7551 CrossRef CAS PubMed.
- M. L. D. C. Barbosa, L. M. Lima, R. Tesch, C. M. R. Sant'Anna, F. Totzke, M. H. G. Kubbutat, C. Schächtele, S. A. Laufer and E. J. Barreiro, Eur. J. Med. Chem., 2014, 71, 1–14 CrossRef PubMed.
- K. El-Adl, M. K. Ibrahim, M. S. I. Alesawy and I. H. Eissa, Bioorg. Med. Chem., 2021, 30, 115958 CrossRef CAS PubMed.
- A. Garofalo, L. Goossens, B. Baldeyrou, A. Lemoine, S. Ravez, P. Six, M. H. David-Cordonnier, J. P. Bonte, P. Depreux, A. Lansiaux and J. F. Goossens, J. Med. Chem., 2010, 53, 8089–8103 CrossRef CAS PubMed.
- M. U. Rahman, G. Jeyabalan, P. Saraswat, G. Parveen, S. Khan and M. S. Yar, Synth. Commun., 2017, 47, 379–408 CrossRef CAS.
- J. M. de la Torre, M. Nogueras and J. Cobo, Arabian J. Chem., 2019, 12, 4579–4595 CrossRef CAS.
- D. Verma, P. Kumar, B. Narasimhan, K. Ramasamy, V. Mani, R. K. Mishra and A. B. A. Majeed, Arabian J. Chem., 2019, 12, 2882–2896 CrossRef CAS.
- D. Huang, L. Huang, Q. Zhang and J. Li, Eur. J. Med. Chem., 2017, 140, 212–228 CrossRef CAS PubMed.
- G. Li, X. Wang, C. Tian, T. Zhang, Z. Zhang and J. Liu, Tetrahedron Lett., 2012, 53, 5193–5196 CrossRef CAS.
- M. Melguizo, A. Sánchez, M. Nogueras, J. N. Low, R. Alan Howie, G. Andrei and E. De Clercq, Tetrahedron, 1994, 50, 13511–13522 CrossRef CAS.
- Q. Zhang, Q. Shen, L. Gao, L. Tong, J. Li, Y. Chen and W. Lu, Eur. J. Med. Chem., 2018, 158, 428–441 CrossRef CAS PubMed.
- S. Xu, L. Zhang, S. Chang, J. Luo, X. Lu, Z. Tu, Y. Liu, Z. Zhang, Y. Xu, X. Ren and K. Ding, MedChemComm, 2012, 3, 1155–1159 RSC.
- J. Ramírez, L. Svetaz, J. Quiroga, R. Abonia, M. Raimondi, S. Zacchino and B. Insuasty, Eur. J. Med. Chem., 2015, 92, 866–875 CrossRef PubMed.
- F. Liu, X. Chen, A. Allali-Hassani, A. M. Quinn, G. A. Wasney, A. Dong, D. Barsyte, I. Kozieradzki, G. Senisterra, I. Chau, A. Siarheyeva, D. B. Kireev, A. Jadhav, J. M. Herold, S. V. Frye, C. H. Arrowsmith, P. J. Brown, A. Simeonov, M. Vedadi and J. Jin, J. Med. Chem., 2009, 52, 7950–7953 CrossRef CAS PubMed.
- B. Insuasty, A. García, J. Bueno, J. Quiroga, R. Abonia and A. Ortiz, Arch. Pharm., 2012, 345, 739–744 CrossRef CAS PubMed.
- B. Insuasty, A. García, J. Quiroga, R. Abonia, M. Nogueras and J. Cobo, Eur. J. Med. Chem., 2010, 45, 2841–2846 CrossRef CAS PubMed.
- National Cancer Institute, NCI-60 Screening Methodology, https://dtp.cancer.gov/discovery_development/nci-60/methodology.htm.
- M. R. Boyd and K. D. Paull, Drug Dev. Res., 1995, 34, 91–109 CrossRef CAS.
- R. H. Shoemaker, Nat. Rev. Cancer, 2006, 6, 813–823 CrossRef CAS PubMed.
- D. W. Zaharevitz, S. L. Holbeck, C. Bowerman and P. A. Svetlik, J. Mol. Graphics Modell., 2002, 20, 297–303 CrossRef CAS PubMed.
- G. Berger, H. Leclercqz, A. Derenne, M. Gelbcke, E. Goormaghtigh, J. Nève, V. Mathieu and F. Dufrasne, Bioorg. Med. Chem., 2014, 22, 3527–3536 CrossRef CAS PubMed.
- D. Havrylyuk, B. Zimenkovsky, O. Vasylenko, C. W. Day, D. Smee, P. Grellier and R. Lesyk, Eur. J. Med. Chem., 2013, 66, 228–237 CrossRef CAS PubMed.
- M. H. El-Wakil, A. F. El-Yazbi, H. M. A. Ashour, M. A. Khalil, K. A. Ismail and I. M. Labouta, Bioorg. Chem., 2019, 90, 103089 CrossRef CAS PubMed.
- H. N. Jayaram, M. S. Lui, J. Plowman, K. Pillwein, M. A. Reardon, W. L. Elliott and G. Weber, Cancer Chemother. Pharmacol., 1990, 26, 88–92 CrossRef CAS PubMed.
- D. A. Skoufias, S. DeBonis, Y. Saoudi, L. Lebeau, I. Crevel, R. Cross, R. H. Wade, D. Hackney and F. Kozielski, J. Biol. Chem., 2006, 281, 17559–17569 CrossRef CAS PubMed.
- L. H. Li, L. G. Timmins, T. L. Wallace, W. C. Krueger, M. D. Prairie and W. B. Im, Cancer Lett., 1984, 23, 279–288 CrossRef CAS.
- National Cancer Institute, CCNU, https://www.cancer.gov/espanol/publicaciones/diccionarios/diccionario-cancer/def/ccnu.
- E. Movahedi, A. R. Rezvani and H. Razmazma, Int. J. Biol. Macromol., 2019, 126, 1244–1254 CrossRef CAS PubMed.
- R. G. Shinde, A. A. Khan and A. Barik, J. Mol. Struct., 2020, 1208, 127901 CrossRef CAS.
- E. S. Gil, C. B. da Silva, P. A. Nogara, C. H. da Silveira, J. B. T. da Rocha, B. A. Iglesias, D. S. Lüdtke, P. F. B. Gonçalves and F. S. Rodembusch, J. Mol. Liq., 2020, 297, 111938 CrossRef CAS.
- T. Biver, Appl. Spectrosc. Rev., 2012, 47, 272–325 CrossRef CAS.
- N. Vamsikrishna, S. Daravath, N. Ganji, N. Pasha and K. Shivaraj, Inorg. Chem. Commun., 2020, 113, 107767 CrossRef CAS.
- S. Bi, X. Sun, X. Li, R. Zhao and D. Shao, Luminescence, 2020, 35, 493–502 CrossRef CAS PubMed.
- S. Agarwal, D. Chadha and R. Mehrotra, J. Biomol. Struct. Dyn., 2015, 33, 1653–1668 CrossRef CAS PubMed.
- M. Dareini, Z. Amiri Tehranizadeh, N. Marjani, R. Taheri, S. Aslani-Firoozabadi, A. Talebi, N. NayebZadeh Eidgahi, M. R. Saberi and J. Chamani, Spectrochim. Acta, Part A, 2020, 228, 117528 CrossRef CAS PubMed.
- Y. Ma, G. Zhang and J. Pan, J. Agric. Food Chem., 2012, 60, 10867–10875 CrossRef CAS PubMed.
- N. L. Huang and J. H. Lin, Molecules, 2014, 19, 7415–7428 CrossRef PubMed.
- D. E. Arthur, Radiol. Infect. Dis., 2019, 6, 68–79 CrossRef.
- O. Trott and A. J. Olson, J. Comput. Chem., 2010, 31, 455–461 CAS.
- J. Gasteiger and M. Marsili, Tetrahedron Lett., 1978, 19, 3181–3184 CrossRef.
- J. Schmitt, E. Goodfellow, S. Huang, C. Williams, I. N. F. Gomes, M. N. Rosa, R. M. Reis, R. Yang, H. M. Titi and B. J. Jean-Claude, Eur. J. Med. Chem., 2020, 192, 112185 CrossRef CAS PubMed.
- A. Monks, D. Scudiero, P. Skehan, R. Shoemaker, K. Paull, D. Vistica, C. Hose, J. Langley, P. Cronise, A. Vaigro-wolff, M. Gray-goodrich, H. Campbell, J. Mayo and M. Boyd, J. Natl. Cancer Inst., 1991, 83, 757–766 CrossRef CAS PubMed.
- J. N. Weinstein, T. G. Myers, P. M. O'Connor, S. H. Friend, A. J. Fornace, K. W. Kohn, T. Fojo, S. E. Bates, L. V. Rubinstein, N. L. Anderson, J. K. Buolamwini, W. W. van Osdol, A. P. Monks, D. A. Scudiero, E. A. Sausville, D. W. Zaharevitz, B. Bunow, V. N. Viswanadhan, G. S. Johnson, R. E. Wittes and K. D. Paull, Science, 1997, 275, 343–349 CrossRef CAS PubMed.
- M. R. Grever, S. A. Schepartz and B. A. Chabner, Semin. Oncol., 1992, 19, 622–638 CAS.
- K. Conceição, K. Konno, M. Richardson, M. M. Antoniazzi, C. Jared, S. Daffre, A. C. M. Camargo and D. C. Pimenta, Peptides, 2006, 27, 3092–3099 CrossRef PubMed.
- J. D. Londoño-Mosquera, A. Aragón-Muriel and D. Polo-Cerón, Univ. Sci., 2018, 23, 141–169 CrossRef.
- H. L. Chen, P. Y. Su, Y. S. Chang, S. Y. Wu, Y. Di Liao, H. M. Yu, T. L. Lauderdale, K. Chang and C. Shih, PLoS Pathog., 2013, 9, e1003425 CrossRef CAS PubMed.
- A. K. Rappe, C. J. Casewit, K. S. Colwell, W. A. Goddard and W. M. Skiff, J. Am. Chem. Soc., 1992, 114, 10024–10035 CrossRef CAS.
- H. R. Drew, R. M. Wing, T. Takano, C. Broka, S. Tanaka, K. Itakura and R. E. Dickerson, Proc. Natl. Acad. Sci. U. S. A., 1981, 78, 2179–2183 CrossRef CAS PubMed.
- A. Gul, Z. Akhter, F. Perveen, S. Kalsoom, F. L. Ansari and M. Siddiq, Int. J. Polym. Sci., 2019, 2019, 2103891 Search PubMed.
- N. Rezki, F. F. Al-Blewi, S. A. Al-Sodies, A. K. Alnuzha, M. Messali, I. Ali and M. R. Aouad, ACS Omega, 2020, 5, 4807–4815 CrossRef CAS PubMed.
- I. Singh, V. Luxami and K. Paul, Sci. Rep., 2020, 10, 6534 CrossRef CAS PubMed.
- J. C. Phillips, D. J. Hardy, J. D. C. Maia, J. E. Stone, J. V. Ribeiro, R. C. Bernardi, R. Buch, G. Fiorin, J. Hénin, W. Jiang, R. McGreevy, M. C. Melo, B. K. Radak, R. D. Skeel, A. Singharoy, Y. Wang, B. Roux, A. Aksimentiev, Z. Luthey-Schulten, L. V. Kalé, K. Schulten, C. Chipot and E. Tajkhorshid, J. Chem. Phys., 2020, 153, 044130 CrossRef CAS PubMed.
- J. Huang and A. D. Mackerell, J. Comput. Chem., 2013, 34, 2135–2145 CrossRef CAS PubMed.
Footnote |
| † Electronic supplementary information (ESI) available: Table S1, spectra data and Fig. S1. See DOI: 10.1039/d1ra03509f |
| This journal is © The Royal Society of Chemistry 2021 |