 Open Access Article
A study on the preparation of polycation gel polymer electrolyte for supercapacitors†
Hao Guoa,
Longli Mab,
Chaojing Yanb and
Xiaohua Ma *b
*b
aDepartment of Chemistry, Fudan University, Shanghai 200433, China
bDepartment of Materials Science, Fudan University, Shanghai 200433, China. E-mail: xhma@fudan.edu.cn
First published on 19th July 2021
Abstract
The polycation gel polymer electrolyte (PGPE) is a promising electrolyte material for supercapacitors due to its high ionic conductivity and great flexibility. Herein, we report a novel flexible PGPE film, which is prepared by thermal copolymerization. The superiority of PGPE is attributed to the existence of charged groups in the polymer skeleton. Consequently, the crystallinity of the polymer is effectively reduced, and the migration of the lithium ion is evidently promoted. Moreover, the liquid retention capacity of the film is improved, which enhances its ionic conductivity as well. The reported PGPE exhibits a high ionic conductivity of 57.6 mS cm−1 at 25 °C and a potential window of 0–1.2 V. The symmetrical PGPE supercapacitor (AC/AC) shows 95.21% mass-specific capacitance retention after 5000 cycles at 2 A g−1 with a maximum energy density of 12.8 W h kg−1 and a maximum power density of 5.475 kW kg−1. This study confirms the exciting potential of PGPE for high performance supercapacitors.
1. Introduction
The key concern in alleviating the problems caused by energy depletion and environmental pollution is developing the green, efficient and environmentally friendly new energy systems to achieve a “low-carbon economy” and promote sustainable development.1–4 Supercapacitors are considered as novel outstanding energy-storage devices on account of their high energy density, light weight, long cycling life, great portability and safety.5–8 As an important part of energy-storage devices, electrolytes deeply influence their electrochemical performance.9 Compared with traditional electrolyte materials, gel polymer electrolytes (GPEs) are predominant owing to their high safety and great flexibility.10–14 The unique network structure of the polymer skeleton provides good mechanical properties, and the liquid electrolyte which is dispersed in the polymer network undertakes the task of ion conduction.15–17 Theoretically, GPE possess the high ionic conductivity of liquid electrolytes and the great mechanical properties of solid electrolytes at the same time. Various polymer systems have been proposed18–20 for the application in energy-storage such as poly(ethylene oxide) (PEO), poly(methyl methacrylate) (PMMA), poly acrylonitrile (PAN), poly(vinylidene fluoride) (PVDF), however, the contradiction between ionic conductivity and mechanical properties is existed in these systems. Generally, these GPE systems need to be improved for practical application, for example, it is useful to add plasticizers or nano-particles in the polymer system.21Although GPE shows favorable safety and electrochemical performances, their development is hindered by several problems. For instance, the supercapacitors store charge through the electrochemical double layers while the batteries store energy by the electrochemical reactions,21 so the energy density of supercapacitors is much lower than that of batteries. Meanwhile, the anions and cations will migrate under the function of the electric field after the dissociation of lithium salt in the polymer skeleton. Unfortunately, most of the ionic current is contributed by anions (the migration ability of anions and cations are different), which causes the concentration polarization (it is harmful to the conduction process). The polarization will results the increases of the overall impedance and the reduction of the ionic conductivity.22,23 Moreover, the operation temperatures and potential window of devices are limited by the evaporation and decomposition of the solvent molecules.24,25 Therefore, several novel GPE systems have been developed to solve these problems and produce high performance supercapacitors.26–28
Polycation gel polymer electrolyte (PGPE) introduces charged groups into the polymer framework,29 which decreases the polarization phenomenon effectively. On the one hand, the charged groups attract the anions in the system, which promotes the dissociation of lithium salts and the migration of lithium ions.30–32 On the other hand, the charged groups interact with the solvent molecules in the electrolytes, which improves the ionic conductivity and liquid retention capacity of the system.33,34 In addition, the charged groups also enhance the interaction between the electrode materials and the polymer films, which endows the system a better interface performance.35,36 Recently, the preparation and application of PGPE system has drawn extensive attention.37,38 Generally, PGPE system exhibits excellent flexibility, high ionic conductivity, wide potential window, great thermal stability and outstanding cycle performance.39–42 Thus, it has emerged as an ideal selection for flexible supercapacitors.
Stalgren et al.29 report two similar monomer with charged groups, one is used in the following work to prepare PGPE. Yan et al.42 develop a system of poly(C3(Br)DMAEMA-co-PEGMA) for all-solid-state supercapacitors, which exhibits high ionic conductivity of 66.8 mS cm−1 (25 °C) and excellent mechanical strength. When it is fabricated in the supercapacitor, the electrochemical properties of the device are outstanding. This research provides an idea for the design of the multifunctional polymer backbone to overcome the shortcomings of traditional GPE systems, which expands the investigation of the PGPE systems. Therefore, the another monomer ((EO)6(Cl)DMAEMA) which is reported by Stalgren et al.29 may exhibits great electrochemical and mechanical properties, therefore, we attempt studying its preparation and application in this paper.
In the present work, the alkylation reaction is used to synthesizing a novel cationic monomer, namely N-(2-methacryloyloxy)ethyl-N,N-dimethy-poly(ethylene glycol)-ammonium chloride ((EO)6(Cl)DMAEMA), its thermal copolymerization with poly (ethylene glycol) methacrylate (PEGMA) prepares a flexible PGPE matrix, enabling the amorphous structure. After socking in 1 mol L−1 Li2SO4/H2O solution for 6 h, the PGPE matrix is uniformly filled with liquid electrolytes, therefore, endowing the system favorable ionic conductivity. Morphological, structure and thermal stability studies suggest that the addition of the charged groups hinder the crystallization of the polymer, thus, enhancing the liquid uptake and retention ability. The ionic conductivity of PGPE is measured as 57.6 mS cm−1 at room temperature (25 °C), which exceeds the value of most reported hydrogels systems in Fig. S1 (ESI†). The symmetrical supercapacitor assembled by PGPE behaves a brilliant cycle stability, its mass-specific capacitance retention rate reaches 95.21% after 5000 cycles at a current density of 2 A g−1. However, the device exhibits narrow potential window and low energy density, which obstructs its practical application. The potential window of the supercapacitor is valued from 0 to 1.2 V, which is limited by the using of aqueous electrolytes. The maximum energy density and power density of the device is 12.8 W h kg−1 and 5.475 kW kg−1, respectively. Thus, we attempt adding carbon nanotubes (CNTs) into the PGPE system, which improves the potential window (0–1.5 V) and the energy density (21.64 W h kg−1) of the CNTs-doped device, furthermore, promoting the practical application of PGPE system. In short, the PGPE is in line with the current trend of electrochemical devices to be light weight and flexible, which expects its broad prospect.
2. Experimental
2.1 Materials
Poly(ethylene glycol) (PEG, average molecular weight (Mw): 300 g mol−1), thionyl chloride (SOCl2, 99.5%), pyridine (C5H5N, 99.0%), 2-(dimethylamino)ethyl methacrylate (DMAEMA, 99.0%), poly(ethylene glycol) methacrylate (PEGMA, Mw: 360 g mol−1), 2,2′-azobis(2-methylpropionitrile) (AIBN, 99.0%), activated carbon (AC, surface area: 2000 m2 g−1, particle size: 10 μm) are obtained from Aladdin. Toluene (C7H8, AR), acetonitrile (CH3CN, AR), isopropanol ((CH3)2CHOH, AR), N-methyl-2-pyrrolidone (NMP, 99.0%), lithium sulfate monohydrate (Li2SO4·H2O, AR) are obtained from Sinopharm.2.2 Synthesis of the cationic monomer (EO)6(Cl)DMAEMA
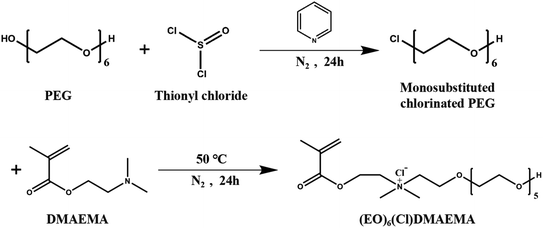
The synthetic route29 of the N-(2-methacryloyloxy)ethyl-N,N-dimethy-poly(ethylene glycol)-ammonium chloride ((EO)6(Cl)DMAEMA) was shown in Scheme 1. Monosubstituted chlorinated PEG ((EO)6Cl) was prepared by the reaction of PEG (30 mmol) with thionyl chloride (180 mmol) in refluxing toluene at 40 °C for 24 h, which using pyridine (180 mmol) as catalyst. The product of this reaction is the mixtures of monosubstituted and disubstituted chlorinated PEG. The former can be separated form the mixtures by its great solubility in water. The quaternization of (EO)6Cl with an equimolar amount of DMAEMA was carried out in refluxing acetonitrile at 50 °C for 24 h. Then the (EO)6(Cl)DMAEMA can be obtained form the reaction solution by vacuum distillation. The unreacted DMAEMA should be removed by multiple extractions using toluene until the pH is 7.2.3 Preparation of polycation gel polymer electrolytes
The preparation of polycation gel polymer electrolyte (PGPE) can be divided into two steps. The first step is the preparation of the PGPE matrix, which is made by the thermal copolymerization of (EO)6(Cl)DMAEMA (percentage of total monomer mass: 70%, 80%, 90%) and PEGMA at 60 °C for 5 h. AIBN is used as thermal initiator (percentage of total monomer mass: 2%). A mixed solution of isopropanol and water (volume ratio = 1![[thin space (1/6-em)]](https://www.rsc.org/images/entities/char_2009.gif) :
:![[thin space (1/6-em)]](https://www.rsc.org/images/entities/char_2009.gif) 2) is used as solvent. The prepared PGPE matrix need to be dried in vacuum at 80 °C for 12 h.
2) is used as solvent. The prepared PGPE matrix need to be dried in vacuum at 80 °C for 12 h.
Second, the PGPE matrix need to be immersed in Li2SO4/H2O solution (concentration: 0.5, 1, 1.5, 2 mol L−1) for 6 h. The mechanical properties and ionic conductivity of the prepared PGPE are shown in Table S2.† When the mass percentage of (EO)6(Cl)DMAEMA is 80% and the concentration of Li2SO4/H2O solution is 1 mol L−1, the prepared PGPE exhibits the optimum performance (high ionic conductivity and great flexibility). Therefore, this PGPE system is selected for subsequently characterizations and performance researches. In order to study the role of charged groups in PGPE skeleton, a polymer without charged groups is prepared through the thermal copolymerization of DMAEMA (percentage of total monomer mass: 80%) and PEGMA at same condition, which is named as poly(DMAEMA-co-PEGMA) (PDPA).
2.4 Assemblage of symmetric supercapacitors
Symmetric supercapacitor is assembled by putting two pieces of activated carbon electrodes and a PGPE membrane into the cell with the order of electrode/PGPE/electrode. The activated carbon electrodes is prepared by coating the homogeneous slurry of activated substance on the round nickel foam sheets (diameter: 14 mm). The slurry is made by mixing activated carbon (AC), acetylene black (conductive agent) and poly(vinylidene fluoride) (PVDF) (binder) with the mass ratio of 8![[thin space (1/6-em)]](https://www.rsc.org/images/entities/char_2009.gif) :
:![[thin space (1/6-em)]](https://www.rsc.org/images/entities/char_2009.gif) 1
1![[thin space (1/6-em)]](https://www.rsc.org/images/entities/char_2009.gif) :
:![[thin space (1/6-em)]](https://www.rsc.org/images/entities/char_2009.gif) 1 in NMP (solvent). The coated electrodes need to be dried in vacuum at 110 °C for 12 h and pressed with a pressure of 3 MPa. The assembled supercapacitors are named as PGPE supercapacitor (PGPE SC) and PDPA supercapacitor (PDPA SC).
1 in NMP (solvent). The coated electrodes need to be dried in vacuum at 110 °C for 12 h and pressed with a pressure of 3 MPa. The assembled supercapacitors are named as PGPE supercapacitor (PGPE SC) and PDPA supercapacitor (PDPA SC).
2.5 Characterization techniques
Scanning electron microscope (SEM, Phenom Prox) is used to observe the microscopic morphology of PGPE matrix. Fourier transform infrared spectrometer (FT-IR, Nicolet IS 10) is utilized for researching the molecular structure of samples. The chemical structure of cationic monomer is characterized by nuclear magnetic resonance spectroscopy (NMR, Bruker 500 MHz) in D2O (solvent). The crystalline state of polymer membrane is measured by the X-ray diffractometer (XRD, D2 PHASER). The TGA curves are obtained by the thermal gravimetric analyzer (TGA, TA Q500) to evaluate the thermal stability of samples. Electrochemical characterization is carried out by the electrochemical workstation (CHI 660E).3. Results and discussion
3.1 NMR analysis
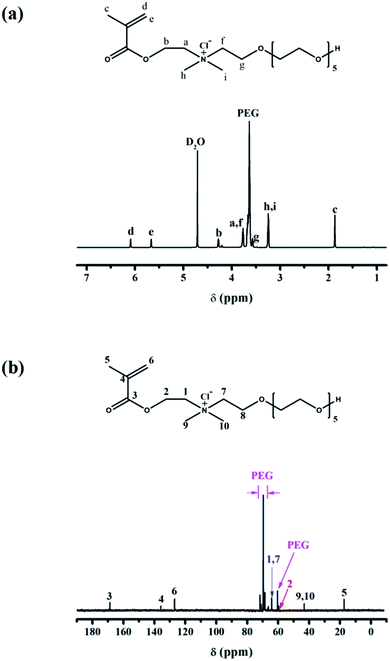
NMR spectrum is used to certify the successful synthesis of the cationic monomer (EO)6(Cl)DMAEMA. Its chemical structure is confirmed by analyzing the 1H NMR and 13C NMR (Fig. 1).1H NMR: δ (ppm) 1.86 (H-c, 3H, Me), 3.24 (H-h and H-i, 6H, Me2N), 3.57 (H-g, 2H, –CH2–), 3.61–3.70 (PEG), 3.77 (H-a and H-f, 4H, –CH2–), 4.27 (H-b, 2H, –CH2–), 5.66 (H-e, 1H, –C![[double bond, length as m-dash]](https://www.rsc.org/images/entities/char_e001.gif) C–H), 6.08 (H-d, 1H, –C
C–H), 6.08 (H-d, 1H, –C![[double bond, length as m-dash]](https://www.rsc.org/images/entities/char_e001.gif) C–H).
C–H).
13C NMR: δ (ppm) 17.3 (C-5, Me), 42.8 (C-9 and C-10, Me2N), 59.6 (C-2, –CH2–), 60.7 (PEG), 63.9 (C-1 and C-7, –CH2–), 66.9–71.9 (PEG), 126.9 (C-6, ![[double bond, length as m-dash]](https://www.rsc.org/images/entities/char_e001.gif) CH2), 136.1 (C-4), 168.9 (C-3, C
CH2), 136.1 (C-4), 168.9 (C-3, C![[double bond, length as m-dash]](https://www.rsc.org/images/entities/char_e001.gif) O).
O).
3.2 FT-IR analysis
FT-IR spectra give much important information of molecular structure (such as chemical bonds, functional groups), therefore, it is an effective method for organic compounds identification.The absorption spectra in Fig. 2a shows the successful quaternization of (EO)6Cl and DMAEMA.43,44 The obvious change at 736 cm−1 (C–Cl, stretching vibration) suggests that the C–Cl bond44 of (EO)6Cl is broken in the reaction and the chloride of (EO)6(Cl)DMAEMA exists in the form of chloride ion (Cl−). The peak at 1301 cm−1 ((EO)6(Cl)DMAEMA) and 1295 cm−1 (DMAEMA) is affiliated to the stretching vibration of C–N bond.44 The slightly shift shows the steric hindrance around C–N bond is increased after the formation of quaternary ammonium salt. The peaks at 1135 cm−1 (C–O–C, stretching vibration), 1637 cm−1 (C![[double bond, length as m-dash]](https://www.rsc.org/images/entities/char_e001.gif) C, stretching vibration), 1717 cm−1 (C
C, stretching vibration), 1717 cm−1 (C![[double bond, length as m-dash]](https://www.rsc.org/images/entities/char_e001.gif) O, stretching vibration), 2770–2970 cm−1 (C–H bond in –CH3–, –CH2– and
O, stretching vibration), 2770–2970 cm−1 (C–H bond in –CH3–, –CH2– and ![[double bond, length as m-dash]](https://www.rsc.org/images/entities/char_e001.gif) C–H, stretching vibration) in the spectrum of (EO)6(Cl)DMAEMA represent its molecular structure.
C–H, stretching vibration) in the spectrum of (EO)6(Cl)DMAEMA represent its molecular structure.
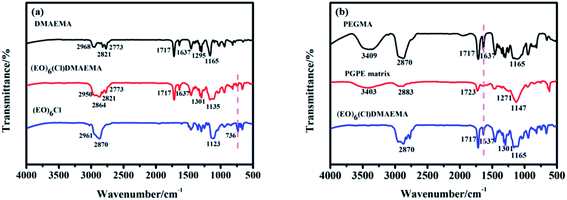 | ||
| Fig. 2 (a) FT-IR spectra of DMAEMA, (EO)6Cl and (EO)6(Cl)DMAEMA. (b) FT-IR spectra of PEGMA, (EO)6(Cl)DMAEMA and PGPE matrix. | ||
The absorption spectra in Fig. 2b manifests the successful copolymerization of (EO)6(Cl)DMAEMA and PEGMA.44–46 The disappearance of the peak at 1637 cm−1 (C![[double bond, length as m-dash]](https://www.rsc.org/images/entities/char_e001.gif) C, stretching vibration) in the spectrum of PGPE matrix indicates that there is no C
C, stretching vibration) in the spectrum of PGPE matrix indicates that there is no C![[double bond, length as m-dash]](https://www.rsc.org/images/entities/char_e001.gif) C bond in the matrix, which means the copolymerization reaction is completely. The characteristic peaks for PGPE matrix is found at 1147 cm−1 (C–O–C, stretching vibration), 1271 cm−1 (C–N, stretching vibration), 1723 cm−1 (C
C bond in the matrix, which means the copolymerization reaction is completely. The characteristic peaks for PGPE matrix is found at 1147 cm−1 (C–O–C, stretching vibration), 1271 cm−1 (C–N, stretching vibration), 1723 cm−1 (C![[double bond, length as m-dash]](https://www.rsc.org/images/entities/char_e001.gif) C, stretching vibration), 2883 cm−1 (C–H bond in –CH3–, –CH2– and
C, stretching vibration), 2883 cm−1 (C–H bond in –CH3–, –CH2– and ![[double bond, length as m-dash]](https://www.rsc.org/images/entities/char_e001.gif) C–H, stretching vibration) and 3403 cm−1 (O–H, stretching vibration).
C–H, stretching vibration) and 3403 cm−1 (O–H, stretching vibration).
3.3 SEM analysis
Fig. 3a is a macro picture of the PGPE matrix, it shows that the surface of the transparent polymer film is smooth and uniform. Fig. 3b–d is the SEM image of the PGPE matrix at 50 μm, 20 μm and 10 μm, respectively. As shown in these figures, there are considerable grooves on the surface of PGPE matrix, which is distributed evenly. The grooves play an important role in storing liquid electrolyte, therefore, the polymer film has a good performance in terms of liquid retention and ionic conductivity. Fig. 3e shows the element (C, O, N, Cl) mapping of the PGPE matrix (each element is arranged according to its content). It indicates that the prepared polymer films are homogeneous.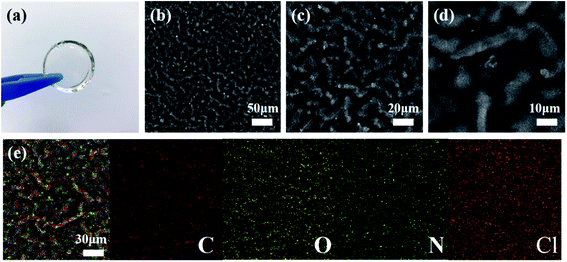 | ||
| Fig. 3 (a) Photograph of the PGPE matrix. (b–d) SEM images of PGPE matrix at 50 μm, 20 μm and 10 μm. (e) Element mapping images of the PGPE matrix. | ||
3.4 XRD analysis
The ionic conduction behavior mainly occurs in the amorphous region of polymer electrolytes according to current researches.47–50 The XRD patterns in Fig. 4a illustrate the typical amorphous structure of PGPE matrix and PGPE. The broad characteristic peaks observed in the 2θ range of 15°–25° attributed to their amorphous nature, which is closely related to the ionic conductivity of electrolytes. As shown in Fig. 4a, the diffraction peak intensity of PGPE is clearly lower than PGPE matrix, it implies that the crystallinity of PGPE is reduced after soaking in liquid electrolytes. The crystalline peak of Li2SO4 is not found in the XRD pattern of PGPE, indicating that the lithium salt is highly dissociated and dispersed in the system.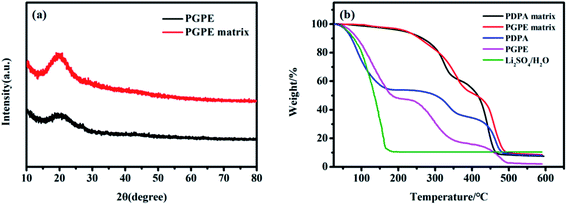 | ||
| Fig. 4 (a) XRD patterns of PGPE and PGPE matrix. (b) TGA traces of PDPA matrix, PGPE matrix, PDPA, PGPE and 1 mol L−1 Li2SO4/H2O solution. | ||
3.5 TGA analysis
The TGA traces of PDPA matrix, PGPE matrix, PDPA, PGPE and 1 mol L−1 Li2SO4/H2O solution are depicted in Fig. 4b to evaluate their thermal stability (from 25 °C to 600 °C). The PDPA matrix and PGPE matrix exhibit similar thermal stability which involves two thermal events. Their first weight loss is assigned to the decomposition of low molecular weight components and the second decay is attributed to the degradation of the main polymer chain.51,52 The weight decay of PGPE exhibits three thermal events: the first weight loss of 52% due to the evaporation of water (from 50 °C to 200 °C), the second decay of 36.35% owing to the decomposition of low molecular weight components (from 250 °C to 380 °C) and the third decay of 13.23% is attributed to the degradation of the main polymer chain (from 420 °C to 500 °C). Compared with PGPE system, the PDPA performs a worse thermal stability: the first step weight loss of 45.55% from 40 °C to 170 °C (evaporation of water), the second step decay of 19.33% from 250 °C to 370 °C (the decomposition of low molecular weight components) and the last step decay of 22.78% from 410 °C to 490 °C (the degradation of the main polymer chain). And the weight loss rate of PDPA is slower (the first step weight loss). Furthermore, the significant weight decay of PGPE and PDPA occurs at the first step weight loss, it demonstrates that the thermal stability of PGPE and PDPA are limited by the evaporation of liquid electrolytes. The liquid conversation ability of PGPE is better than that of PDPA (Fig. S1†), because the strong solvation between the charged group and the water molecule enhances its liquid retention capability, hence, the thermal stability of PGPE is better.3.6 Ionic conductivity
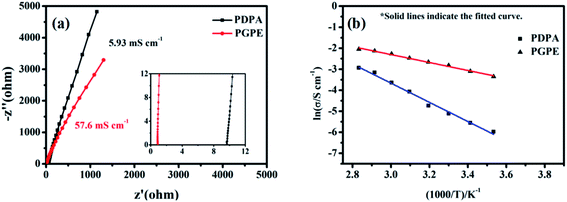
The ionic conductivity of PGPE and PDPA are measured by AC impedance analysis,53,54 and the Nyquist plots of them at 25 °C are shown in Fig. 5a. As observed, the ionic conductivity of PGPE and PDPA is 57.6 mS cm−1 and 5.93 mS cm−1, respectively. It suggests that the addition of charged groups can significantly improves the ionic conductivity of polymer system. Because the anions in the PGPE system are attracted by the positive charge of polymer skeleton, which promotes the dissociation of lithium salts and the migration of lithium ions.Fig. 5b describes the relationship between temperature and the ionic conductivity of PGPE and PDPA from 10 °C to 80 °C. According to the Arrhenius law,41,48 the ionic conductivity of the polymer system increases with the exaltation of temperature, which is consistent with the fitted curves in Fig. 5b. For the polymer electrolyte system, the elevation of temperature is conducive to enhancing the movement of polymer segments and the transport of lithium ions. The ionic conductivity of polymer films and temperature correspond to the linear relationship of formula (1) (ln![[thin space (1/6-em)]](https://www.rsc.org/images/entities/char_2009.gif) σ vs. 1000/T).
σ vs. 1000/T).
 | (1) |
The slope of the fitted curve corresponds to the activation energy of ion transport in the polymer system from formula (1). The activation energy of PGPE and PDPA are calculated as 17.38 kJ mol−1 and 38.16 kJ mol−1, respectively. Therefore, the ion migration in PGPE system is easier than that of PDPA, which proves that the charged groups promote the migration of lithium ions in the polymer system.30
The curves of ionic conductivity of PGPE and PDPA within 30 days are shown in Fig. S2.† After 30 days, the ionic conductivity of PGPE is 44.41 mS cm−1 (retention rate is 77.1%), while the ionic conductivity of PDPA is 4.23 mS cm−1 (retention rate is 71.3%), the results is constant with the liquid retention performance. It demonstrates that the ionic conductivity of polymer electrolytes is directly related to the liquid retention capability.
3.7 Electrochemical characterization of supercapacitor
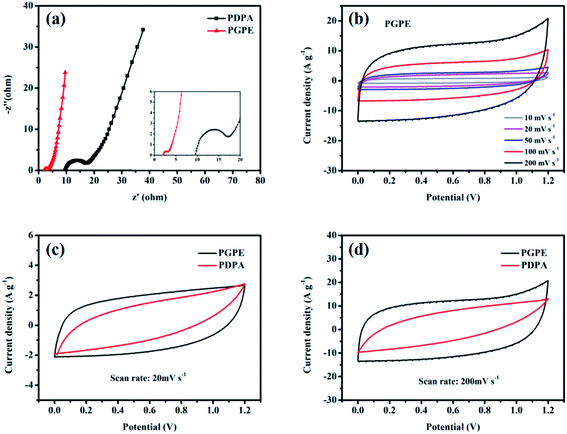
The electrochemical properties of PGPE is studied by the methods of electrochemical impedance spectroscopy (EIS), cyclic voltammetry (CV) and galvanostatic charge/discharge (GCD) when it was assembled in a supercapacitor with two symmetrical AC electrodes. Fig. 6a shows the EIS of PGPE supercapacitor (PGPE SC) and PDPA supercapacitor (PDPA SC). The plots in Fig. 6a exhibit a combined high-frequency depressed semicircle and low-frequency line due to the interface resistance. EIS curves give the bulk resistance (the intercept point on the real axis) and boundary resistance (the diameter of the depressed semicircle) of the supercapacitor clearly. Obviously, the body resistance of PGPE SC (2.01 Ω) is much smaller than that of PDPA SC (9.6 Ω), which corresponding to the high ionic conductivity of PGPE. And the interface resistance of PGPE SC (1.09 Ω) is also lower than that of PDPA SC (7.63 Ω), ascribing to the great contact between the electrode and electrolyte in PGPE SC. Furthermore, the slope of the straight line represents the ion diffusion impedance in the system, which decreases with the increase of the line slope. In brief, the bulk resistance, interface resistance and diffusion resistance of PGPE SC is significantly reduced thanks to the introduction of the charged groups, which shows its great electrochemical performance.The potential window of PGPE SC is assessed between 0 and 1.2 V (Fig. S3†), which is limited by the aqueous electrolytes. Fig. 6b illustrates the CV curves of PGPE SC at the scan rate of 10, 20, 50, 100 and 200 mV s−1 from 0 to 1.2 V. Clearly, the performance of the PGPE SC device is predominant at the high scan rate as its CV curves maintain a regular shape close to the rectangular, while the CV curves of PDPA SC is seriously deformed at the high scan rate (Fig. S4a†). The deformation of the CV curves at the high scan rate indicates that the ion transmission rate in the device is reduced. From Fig. 6c and d, it is observed that the deformation of the PDPA SC is more significant than that of PGPE SC, suggesting that it cannot maintain high-efficiency ion transmission at the high scan rate. The results are in agreement with the findings of Yan et al.,42 who put forward the charge transport resistance of PDPA SC is enhanced with the increase of the scan rates, so it behaves inferior capacitance characteristic, while the PGPE SC exhibits a typical double-layer capacitance feature. It proves that the addition of the charged groups in PGPE powerfully influences its electrochemical properties.
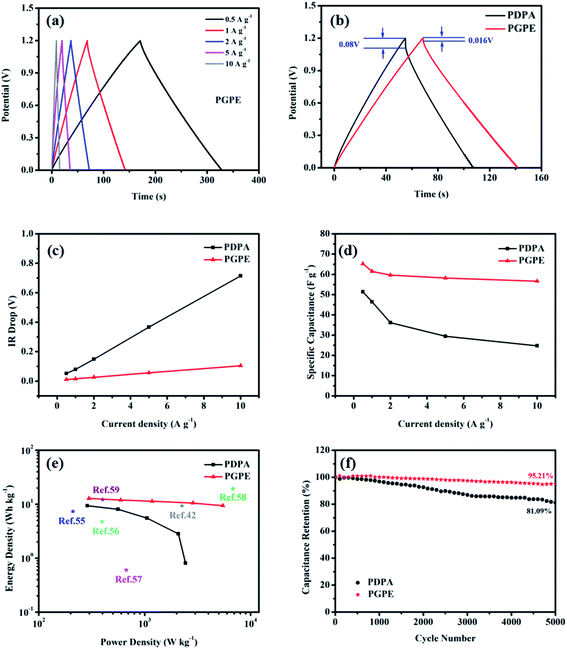
Fig. 7a displays the GCD curves of PGPE SC and PDPA SC at the current densities of 0.5, 1, 2, 5 and 10 A g−1. The GCD curve should be a symmetrical isosceles triangle for an ideal supercapacitor. As shown in Fig. 7a, the GCD curves of PGPE SC exhibit high symmetry at the high current density, while the GCD curves of PDPA SC deformed at the same condition (Fig. S4b†). The phenomenon declares that the PGPE SC performs a high cycle reversibility under the high current density, but the PDPA SC cannot work normally. Compared with PDPA SC, the PGPE SC exhibits a better charge–discharge performance due to its low impedance, great interface property and liquid retention capacity.
Fig. 7b describes a comparison of the GCD curves between PGPE SC and PDPA SC when the current density is 1 A g−1. According to formula (2), the mass-specific capacitance of PGPE SC (61.4 F g−1) is much higher than that of PDPA SC (46.42 F g−1) when the current density is 1 A g−1. The difference between the specified working voltage and the actual discharge voltage is defined as IR drop of the supercapacitors. Clearly, the IR drop of the PGPE SC (0.016 V) is smaller than that of PDPA SC (0.08 V), which is mainly associated with the overall resistance of the supercapacitor.
The mass-specific capacitance of supercapacitor is calculated by the formula (2).
| Cs = (I × Δt)/(m × ΔV) | (2) |
Fig. 7c shows the IR drop curve of PGPE SC and PDPA SC at different current densities (from 0.5 to10 A g−1). First, the IR drops of PGPE SC and PDPA SC both increase linearly with the elevation of current densities. Second, the slope of the curve represents the overall impedance of the device, which is closely related to its electrochemical performance. Obviously, the slope of the IR drop curve of PGPE SC is much smaller than that of PDPA SC, implying that the overall impedance of the former is smaller (which is same as the analysis of Fig. 7a).
Fig. 7d depicts the mass-specific capacitance values of PGPE SC and PDPA SC at different current densities (from 0.5 to 10 A g−1). With the raise of current densities, the mass-specific capacitance value of PGPE SC decreases from 65.18 to 56.62 F g−1 (retention rate is 86.9%), while the specific capacitance retention rate of PDPA SC is 48.1% (from 51.39 to 24.74 F g−1). It means that the PGPE SC can maintain fast ion transmission even under high current density while the PDPA SC cannot. For PGPE SC, the superior capacitance retention rate of the device perhaps thanks to its low overall resistance.
Fig. 7e is the Ragone diagram of PGPE SC, PDPA SC and several current researches.42,55–59 Compared with PDPA SC, the energy density and power density of PGPE SC have been significantly improved, which proves the superiority of the PGPE system. The calculation of energy density (E, W h kg−1) and power density (P, kW kg−1) are shown in formulas (3) and (4).
 | (3) |
| P = E/Δt | (4) |
The maximum energy density of PGPE SC is 12.8 W h kg−1 and its maximum power density is 5.475 kW kg−1. The maximum energy density of PDPA SC is 9.41 W h kg−1 and its maximum power density is 2.43 kW kg−1. The improvements of PGPE SC is attributed to its high discharge voltage (the energy density and power density are both related to the actual discharge voltage). When compared with current researches, the PGPE SC exhibits certain advantages in terms of energy density and power density.
Fig. 7f shows the cycle performance of PGPE SC and PDPA SC at a current density of 2 A g−1. The PGPE SC performs a excellent cycle stability because its mass-specific capacitance retention rate of the device is 95.21% after 5000 cycles. It reflects the superiority of the PGPE system compared with PDPA SC (the mass-specific capacitance retention rate is 81.09%). The superior cycle stability of PGPE SC is attributed to its great charge–discharge performance.
In summary, the electrochemical properties of PGPE SC is effectively enhanced by introducing the charged groups into the polymer skeleton. The existence of charged groups in PGPE improves the ion conductivity and liquid retention capacity of the electrolyte film, thus, the PGPE SC exhibits enhanced electrochemical behavior. The research results promote the development of multifunctional flexible electrolytes for light-weight and flexible energy-storage devices.
However, the prepared PGPE exhibits narrow potential window and low energy density when it is applied in supercapacitor. Then we try to improve the properties of PGPE by doping the CNTs, the prepared film is called as CNTs-doped PGPE (CNTs-PGPE). The ionic conductivity of 1%-CNTs-PGPE (the contents of CNTs is 1%) reaches a maximum value of 66.8 mS cm−1, thus, we choose this system for further research (Fig. S5a†). The potential window of the 1%-CNTs-PGPE SC is 0–1.5 V (Fig. S5b†), and its maximum energy density and power density is 21.64 W h kg−1 and 7.039 kW kg−1, respectively (Fig. S5c and d†). The CNTs inhibit crystallization of the polymer and absorb the lithium ion, which promotes the ion migration and improves the ionic conductivity of the CNTs-PGPE.21 The oxygen-containing functional groups on the surface of the CNTs will interact with the water molecules in the system (such as hydrogen bonding), which increases the potential window because the decomposition voltage of liquid electrolytes in CNTs-PGPE is lifted. Moreover, the energy density and power density of the supercapacitor are enhanced as well.
4. Conclusions
In this research, we have developed a novel polycation GPE (PGPE) by the thermal copolymerization of the cationic polymer monomer ((EO)6(Cl)DMAEMA) and PEGMA at the mass ratio of 8![[thin space (1/6-em)]](https://www.rsc.org/images/entities/char_2009.gif) :
:![[thin space (1/6-em)]](https://www.rsc.org/images/entities/char_2009.gif) 2. The introduction of charged group inhibits the crystallization of the polymer skeleton will enhance its electrolyte uptake ability and, consequently, the ionic conductivity. The prepared PGPE exhibits significant improvements on its ionic conductivity, thermal stability and electrochemical performances when compared with PDPA (without charged groups). These advantages provide superior cycle stability, high specific capacitance for supercapacitor based PGPE. While the potential window, energy density and power density of the device is unsatisfactory, so that we add the CNTs into the PGPE system, which improves these shortcomings effectively. The inspiring results could contribute new insights into the design of the polymer structure and the prepare of GPE with enhanced electrochemical performance for supercapacitors.
2. The introduction of charged group inhibits the crystallization of the polymer skeleton will enhance its electrolyte uptake ability and, consequently, the ionic conductivity. The prepared PGPE exhibits significant improvements on its ionic conductivity, thermal stability and electrochemical performances when compared with PDPA (without charged groups). These advantages provide superior cycle stability, high specific capacitance for supercapacitor based PGPE. While the potential window, energy density and power density of the device is unsatisfactory, so that we add the CNTs into the PGPE system, which improves these shortcomings effectively. The inspiring results could contribute new insights into the design of the polymer structure and the prepare of GPE with enhanced electrochemical performance for supercapacitors.
Conflicts of interest
There are no conflicts to declare.Acknowledgements
We acknowledge the financial support from the National Science and Technology Major Project (52027809).References
- Y. Hou, L. Y. Chen, L. Zhang, J. L. Kang, T. Fujita, J. H. Jiang and M. W. Chen, J. Power Sources, 2013, 225, 304–310 CrossRef CAS.
- X. Y. Luo, Y. H. Liao, H. L. Xie, Y. M. Zhu, Q. M. Huang and W. S. Li, Electrochim. Acta, 2016, 220, 47–56 CrossRef CAS.
- X. Chu, H. T. Zhang, H. Su, F. Y. Liu, B. N. Gu, H. C. Huang, H. P. Zhang, W. Deng, X. T. Zheng and W. Q. Yang, Chem. Eng. J., 2018, 349, 168–175 CrossRef CAS.
- Z. F. Zhang, P. Zhang, D. S. Zhang, H. Lin and Y. Y. Chen, Mater. Des., 2018, 157, 170–178 CrossRef CAS.
- C. A. Amamath, C. E. Hong, N. H. Kim, B. C. Ku, T. Kuila and J. H. Lee, Carbon, 2011, 49, 3497–3502 CrossRef.
- J. Chang, S. Lee, T. Ganesh, R. S. Mane, S. Min, W. Lee and S. H. Han, J. Electroanal. Chem., 2008, 624, 167–173 CrossRef CAS.
- T. Wang, F. Yu, X. X. Wang, S. B. Xi, K. J. Chen and H. X. Wang, Electrochim. Acta, 2020, 334, 13 Search PubMed.
- V. Etacheri, R. Marom, R. Elazari, G. Salitra and D. Aurbach, Energy Environ. Sci., 2011, 4, 3243–3262 RSC.
- G. P. Wang, L. Zhang and J. J. Zhang, Chem. Soc. Rev., 2012, 41, 797–828 RSC.
- L. Dong, C. Xu, L. Yang, Z. H. Huang, F. Kang, Q. H. Yang and X. Zhao, J. Mater. Chem. A, 2016, 4, 4659–4685 RSC.
- Z. S. Zhang, T. Zhai, X. H. Lu, M. H. Yu, Y. X. Tong and K. C. Mai, J. Mater. Chem. A, 2013, 1, 505–509 RSC.
- T. G. Yun, B. Hwang, D. Kim, S. Hyun and S. M. J. Han, ACS Appl. Mater. Interfaces, 2015, 7, 9228–9234 CrossRef CAS PubMed.
- S. Hong, Y. Yuan, C. Z. Liu, W. M. Chen, L. Chen, H. L. Lian and H. Liimatainen, J. Mater. Chem. C, 2020, 8, 550–560 RSC.
- J. F. Tie, L. D. Rong, H. C. Liu, B. J. Wang, Z. P. Mao, L. P. Zhang, Y. Zhong, X. L. Feng, X. F. Sui and H. Xu, Polym. Chem., 2020, 11, 1327–1336 RSC.
- V. D. Noto, S. Lavina, G. A. Giffin, E. Negro and B. Scrosati, Electrochim. Acta, 2011, 57, 4–13 CrossRef.
- D. T. Hallinan and N. P. Balsara, Annu. Rev. Mater. Res., 2013, 43, 503–525 CrossRef CAS.
- D. Ostrovskii, M. L. Torell and G. B. Appetecchi, Solid State Ionics, 1998, 106, 16–24 CrossRef.
- M. Ghelichi, N. T. Qazvini, S. H. Jafari, H. A. Khonakdar, Y. Farajollahi and C. Scheffler, J. Appl. Polym. Sci., 2013, 129, 1868–1874 CrossRef CAS.
- D. Shanmukaraj, G. X. Wang, R. Murugan and H. K. Liu, J. Phys. Chem. Solids, 2008, 69, 243–248 CrossRef CAS.
- K. Jeddi, N. T. Qazvini, S. H. Jafari and A. K. Hossein, J. Polym. Sci., Part B: Polym. Phys., 2010, 48, 2065–2071 CrossRef CAS.
- M. F. El-kady, V. Strong, S. Dubin and R. B. Kaner, Science, 2012, 335, 1326–1330 CrossRef CAS PubMed.
- K. Arbi, J. M. Rojo and J. Sanz, J. Eur. Ceram. Soc., 2007, 27, 4215–4218 CrossRef CAS.
- P. Knauth, Solid State Ionics, 2009, 180, 911–916 CrossRef CAS.
- X. Zhang, M. Kar, T. C. Mendes, Y. Wu and D. R. Mac Farlane, Adv. Energy Mater., 2018, 8, 1702702 CrossRef.
- D. Z. Zhu, J. X. Jiang, D. M. Sun, X. Y. Qian, Y. W. Wang, L. C. Li, Z. W. Wang, X. L. Chai, L. H. Gan and M. X. Liu, J. Mater. Chem. A, 2018, 6, 12334–12343 RSC.
- Y. Y. Cui, X. M. Liang, J. C. Chai, Z. L. Cui, Q. L. Wang, W. S. He, X. C. Liu, Z. H. Liu, G. L. Cui and J. W. Feng, Adv. Sci., 2017, 4, 1700174–1700181 CrossRef PubMed.
- Q. Zheng, L. Ma, R. Khurana, L. Archer and G. Coates, Chem. Sci., 2016, 7, 6832–6838 RSC.
- H. B. Youcef, O. Garcia-Calvo, N. Lago, D. Shanmukaraj and M. Armand, Electrochim. Acta, 2016, 220, 587–594 CrossRef.
- J. J. R. Stalgren, V. Pamedytyte, R. Makuska, P. M. Claesson, W. Brown and U. Jacobsson, Polym. Int., 2003, 52, 399–405 CrossRef CAS.
- X. Peng, H. L. Liu, Q. Yin, J. C. Wu, P. Z. Chen, G. Z. Zhang, G. M. Liu, C. Z. Wu and Y. Xie, Nat. Commun., 2016, 7, 8 Search PubMed.
- R. Lalani and L. Y. Liu, Biomacromolecules, 2012, 13, 1853–1863 CrossRef CAS PubMed.
- J. Wang, M. D. Deng, Y. H. Xiao, W. T. Hao and C. F. Zhu, New J. Chem., 2019, 43, 4815–4822 RSC.
- J. Cardoso, A. Huanosta and O. Manero, Macromolecules, 1991, 24, 2890–2895 CrossRef CAS.
- C. Tiyapiboonchaiya, J. M. Pringle, J. Z. Sun, N. Byrne, P. C. Howlett, D. R. Macfarlane and M. Forsyth, Nat. Mater., 2004, 3, 29–32 CrossRef CAS PubMed.
- R. H. Brown, A. J. Duncan, J. H. Choi, J. K. Park, T. Wu, D. J. Leo, K. I. Winey, R. B. Moore and T. E. Long, Macromolecules, 2010, 43, 790–796 CrossRef CAS.
- N. Matsumi, K. Sugai, M. Miyake and H. Ohno, Macromolecules, 2006, 39, 6924–6927 CrossRef CAS.
- F. X. Wang, X. W. Wu, X. H. Yuan, Z. C. Liu, Y. Zhang, L. J. Fu, Y. S. Zhu, Q. M. Zhou, Y. P. Wu and W. Huang, Chem. Soc. Rev., 2017, 46, 6816–6854 RSC.
- Y. Huang, M. Zhong, Y. Huang, M. S. Zhu, Z. X. Pei, Z. F. Wang, Q. Xue, X. M. Xie and C. Y. Zhi, Nat. Commun., 2015, 6, 8 Search PubMed.
- Y. H. Yang, B. M. Cao, H. Li and H. T. Liu, Chem. Eng. J., 2017, 330, 753–756 CrossRef CAS.
- J. Wang, M. D. Deng, Y. H. Xiao, W. T. Hao and C. F. Zhu, New J. Chem., 2019, 43, 4815–4822 RSC.
- V. Vidyanand, G. Meena, T. A. T. Arun, M. K. N. Chandran, S. B. Nair, M. V. Badiger and S. Kurungot, ACS Sustainable Chem. Eng., 2018, 6, 12630–12640 CrossRef.
- C. J. Yan, M. Y. Jin, X. X. Pan, L. L. Ma and X. H. Ma, RSC Adv., 2020, 10, 9299 RSC.
- S. Setiadji, Jurnal ISTEK, 2013, 2, 1979–1989 Search PubMed.
- A. Dinari, M. Abdollahi and M. Sadeghizadeh, Sci. Rep., 2021, 11, 1962 CrossRef CAS PubMed.
- Z. Yue, Y. J. Che, Z. W. Jin, S. S. Wang, Q. L. Ma, Q. Zhang, Y. B. Tan and F. J. Meng, J. Biomater. Sci., Polym. Ed., 2019, 30, 1375–1398 CrossRef CAS PubMed.
- Z. L. Zhai, S. F. Ye, X. Y. Yan, Z. Q. Song, S. B. Shang and X. P. Rao, Ind. Crops Prod., 2021, 160, 113093 CrossRef CAS.
- M. Imperiyka, A. Ahmad, S. A. Hanifah, N. S. Mohamed and M. Y. A. Rahman, Int. J. Hydrogen Energy, 2014, 39, 3018–3024 CrossRef CAS.
- A. R. Polu, D. K. Kim and H. W. Rhee, Ionics, 2015, 21, 2771–2780 CrossRef CAS.
- Y. Y. Wang, N. A. Lane, C. N. Sun, F. Fan, T. A. Zawodzinski and A. P. Sokolov, J. Phys. Chem. B, 2013, 117, 8003–8009 CrossRef CAS PubMed.
- Q. Cheng, Z. Y. Cui, J. B. Li, S. H. Qin, F. Yan and J. X. Li, J. Power Sources, 2014, 266, 401–413 CrossRef CAS.
- P. Sivaraj, K. P. Abhilash, B. Nalini, P. Perumal and P. C. Selvin, J. Solid State Electrochem., 2021, 25, 905–917 CrossRef CAS.
- P. Sivaraj, K. P. Abhilash, B. Nalini, P. Perumal and P. C. Selvin, Macromol. Res., 2020, 28, 739–750 CrossRef CAS.
- P. Sivaraj, K. P. Abhilash, B. Nalini, P. Balraju, Y. S. Kumar, S. Jayapandi and S. P. Christopher, Ionics, 2019, 25, 2041–2056 CrossRef CAS.
- P. Sivaraj, K. P. Abhilash, B. Nalini, P. C. Selvin, S. Goel and S. K. Yadav, J. Am. Ceram. Soc., 2020, 103, 1685–1697 CrossRef CAS.
- Y. Yoon, K. Lee, S. Kwon, S. Seo, H. Yoo, S. Kim, Y. Shin, Y. Park, D. Kim, J. Y. Choi and H. Lee, ACS Nano, 2014, 8, 4580–4590 CrossRef CAS PubMed.
- H.-W. Chang, Y. R. Lu, J. L. Chen, C. L. Chen, J. M. Chen, Y. C. Tsai, W. C. Chou and C. L. Dong, J. Phys. Chem. C, 2016, 120, 22134–22141 CrossRef CAS.
- Y. X. Xu, Z. Y. Lin, X. Q. Huang, Y. Liu, Y. Huang and X. F. Duan, ACS Nano, 2013, 7, 4042–4049 CrossRef CAS PubMed.
- B. G. Choi, S. J. Chang, H. W. Kang, C. P. Park, H. J. Kim, W. H. Hong, S. lee and Y. S. Huh, Nanoscale, 2012, 4, 4983–4988 RSC.
- S. L. Huo, M. Q. Liu, L. L. Wu, M. J. Liu, M. Xu, W. Ni and Y. M. Yan, J. Power Sources, 2018, 387, 81–90 CrossRef CAS.
Footnote |
| † Electronic supplementary information (ESI) available. See DOI: 10.1039/d1ra03488j |
| This journal is © The Royal Society of Chemistry 2021 |

