 Open Access Article
Interfacial charge-transfer transitions in SnO2 functionalized with benzoic acid derivatives
Jun-ichi Fujisawa * and
Minoru Hanaya
Graduate School of Science and Technology, Gunma University, 1-5-1 Tenjin-cho, Kiryu, Gunma 376-8515, Japan. E-mail: jfujisawa@gunma-u.ac.jp
First published on 9th June 2021
Abstract
Interfacial charge-transfer transitions (ICTTs) between organic compounds and inorganic semiconductors have recently attracted increasing attention for their potential applications in solar energy conversions and chemical sensing due to the unique functions of visible-light absorption with colourless organic molecules and direct charge separation. However, inorganic semiconductors available for ICTT are quite limited to a few kinds of metal-oxide semiconductors (TiO2, ZnO, etc.). Particularly, the exploration of ICTT in inorganic semiconductors with a lower-energy conduction band such as SnO2 is an important issue for realizing a wide range of visible-light absorption for organic adsorbates with the deep highest occupied molecular orbital (HOMO) such as benzoic acid derivatives. Here, we report the first observation of ICTT in SnO2. SnO2 nanoparticles show a broad absorption band in the visible region by chemisorption of 4-dimethylaminobenzoic acid (4-DMABA) and 4-aminobenzoic acid (4-ABA)) via the carboxylate group. The wavelength range of the ICTT band significantly changes depending on the kind of substituent group. The ionization potential measurement and density functional theory (DFT) analysis reveal that the absorption band is attributed to ICTT from the HOMO of the adsorbed benzoic acid derivatives to the conduction band of SnO2. In addition, we clarify the mechanism of ICTT in SnO2 computationally. Our research opens up a way to the fundamental research on ICTT in SnO2 and applications in solar energy conversions and chemical sensing.
Introduction
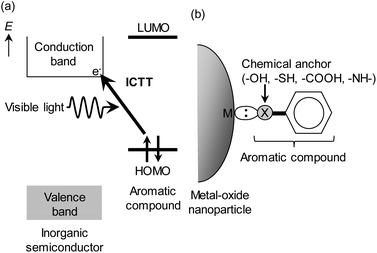
Organic–inorganic hybrid nanomaterials hold great promise for developing new functional materials. Surface coordination complexes of inorganic semiconductor nanomaterials such as TiO2 nanoparticles with organic compounds characteristically show interfacial charge-transfer transitions across organic–inorganic interfaces, which enable the absorption of visible light with colourless organic compounds and direct photoinduced charge separation, as shown in Fig. 1(a).1–16 Due to these key features, ICTT have recently attracted increasing interest because of their potential applications in solar energy conversions such as photovoltaic conversion10,17,18 and photocatalysis19–29 and chemical sensing (direct visualization,2,3,30–33 surface enhanced Raman scattering (SERS),34,35 and visible-light circular dichroism (CD)36). So far, ICTT has been studied in TiO2 nanoparticles chemisorbed with various organic compounds (phenol, catechol, benzenedithiol, aromatic carboxylic acids, aromatic amines, etc.), as shown in Fig. 1(b). However, inorganic semiconductors available for ICTT are quite limited to a few kinds of wide band-gap semiconductors (TiO2, SrTiO3, BaTiO3, ZnO).37–40 Particularly, the exploration of ICTT in inorganic semiconductors with a lower-energy conduction band such as SnO2 is a high-priority issue to realize the absorption of visible light with organic adsorbates possessing the deep highest occupied molecular orbital (HOMO) such as benzoic acid derivatives. In addition, SnO2 is an important semiconductor for electronic and optoelectronic devices and chemical sensors due to the high electron mobility.41 For these reasons, the observation of ICTT in SnO2 is a crucial issue for the fundamental research and applications of ICTT. To our best knowledge, however, there are no reports on ICTT in SnO2. Here, we report the first observation of ICTT in SnO2 nanoparticles adsrobed with benzoic acid derivatives, 4-dimethylaminobenzoic acid (4-DMABA) and 4-aminobenozic acid (4-ABA), which have a strong electron-donating group.Experimental
SnO2 nanoparticles adsorbed with 4-DMABA were prepared by immersing crystalline SnO2 nanoparticles (Wako Pure Chemical Industries) with an average particle size of ca. 30 nm and a tetragonal crystal structure into the acetonitrile solution of 10 mM 4-DMABA (Tokyo Chemical Industry) for 24 hours at room temperature, filtering and washing well SnO2 nanoparticles with acetonitrile to remove unadsorbed 4-DMABA, and then vacuum-drying them. SnO2 nanoparticles adsorbed with 4-ABA were prepared in a similar way with 4-ABA (Tokyo Chemical Industry). The adsorption densities of 4-DMABA and 4-ABA were estimated to be ca. 0.20 and 0.22 mmol g−1, respectively, by elementary analysis. Diffuse reflectance spectra were measured by means of a UV-VIS-NIR spectrophotometer (V-670, JASCO). The measured diffuse reflectance (Rdiff) spectra were converted to the spectra of Kubelka–Munk (KM) function that is defined as the ratio (K/S) of the absorption coefficient (K) to the scattering coefficient (S) by using the following equation, KM function = (1 − Rdiff)2/(2Rdiff). FT-IR spectra were measured by means of an FT-IR spectrometer (iS10, Nicolet) with a diamond ATR crystal. SnO2 nanoparticles for IR measurements were prepared via immersion in acetonitrile. Photoelectron yield measurements were performed by means of an ionization energy measurement system (BIP-KV201, Bunkoukeiki).Computational details
For DFT analysis, we built a SnO2-cluster based model complex [Sn9O12H4(OH)15–OOC–Bz–N(CH3)2] and [Sn9O12H4(OH)15–OOC–Bz–NH2] (total charge: 0) using the reported X-ray crystallographic data of bulk tetragonal SnO2 crystals. Structural optimization of the model complexes was performed with the B3LYP functional and def2-TZVP basis set.42,43 During the geometrical optimization, the Cartesian coordinates of tin and oxygen atoms in the SnO2 nanocluster were frozen to maintain the crystal structure, while all other atoms (carbon, hydrogen, nitrogen, and oxygen atoms in the adsorbed 4-DMBABA and 4-ABA and hydrogen atoms in the surface hydroxy groups) were relaxed. The vibrational spectrum was calculated with the same functional and basis set. The electronic excitation spectrum was calculated at the same level of theory. All the calculations were performed by using a Gaussian 09 software.44Results and discussion
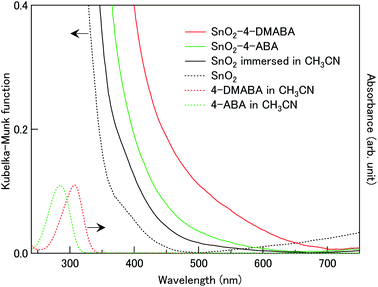
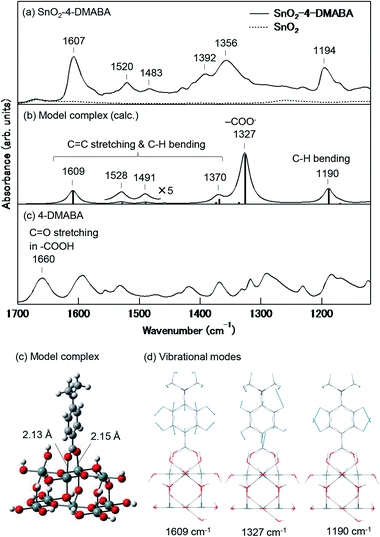
Crystalline SnO2 nanoparticles (average size: ca. 30 nm) were coloured dark orange by immersion in the acetonitrile solution of 4-DMABA (10 mM). As shown in Fig. 2, SnO2 nanoparticles treated with 4-DMABA showed a broad absorption band in the visible region with an absorption onset at ca. 700 nm, in contrast to the inter-band absorption of SnO2 (Eg = 3.6 eV)41 and intra-molecular absorption of 4-DMABA in the UV region. For comparison, we measured the Kubelka–Munk spectrum of SnO2 nanoparticles immersed in the acetonitrile solution of 4-ABA (10 mM). 4-ABA-treated SnO2 nanoparticles showed a broad absorption band in a narrower visible range with an absorption onset around 600 nm. This result clearly indicates that the wavelength range of the absorption band depends on the kind of substituent group introduced in the benzoic acid derivatives with the red-shift of the absorption onset from ca. 600 (4-ABA) to ca. 700 nm (4-DMABA) by 0.30 eV. On the other hand, we observed that a weak and broad absorption band appeared in the visible region by only immersion into acetonitrile solvent, as shown by the black solid curve in Fig. 2. This absorption band is presumably related to intra-gap surface levels in the solvent-treated SnO2 nanoparticles. Although the detail of the electronic transitions remains unknown, this solvent-induced absorption band prevented us from observing ICTT in SnO2 with other benzoic acid derivatives. By introducing the strong electron-donating groups (–N(CH3)2 and –NH2) into benzoic acid, we could observe new absorption bands at the longer wavelengths than the solvent-induced absorption.Fig. 3(a) and (c) show the FT-IR spectra of SnO2 nanoparticles adsorbed with and without 4-DMABA and that of 4-DMABA, respectively. The SnO2–4-DMABA complex showed several intramolecular vibrational peaks of the adsorbed 4-DMABA at 1194 (strong), 1356 (strong and broad), 1392 (weak), 1483 (weak), 1520 (weak), and 1607 cm−1 (strong). By comparison to the FT-IR spectrum of free 4-DMABA, it is seen that the vibrational mode of the carboxy group at 1660 cm−1 disappeared and the strong and broad vibrational peak assigned to the carboxylate group (–COO−) appeared at 1356 cm−1 upon adsorption on SnO2. This result indicates that 4-DMABA chemisorbs on the SnO2 surface via the carboxylate group though the dehydration condensation reaction of the carboxy group with a surface hydroxy group. In order to confirm this assignment, we analyzed the vibrational structure with density functional theory (DFT) calculations using a model complex [Sn9O12H4(OH)15–OOC–Bz–N(CH3)2]. Fig. 3(d) shows the DFT-optimized structure of the model complex. The Sn–Obridge bond lengths are estimated to be 2.13 and 2.15 Å. The calculated vibrational spectrum of the model complex exhibits intramolecular vibrational peaks of the adsorbed 4-DMABA at 1190 (strong), 1327 (very strong), 1370 (weak), 1491 (weak), 1528 (weak), and 1609 cm−1 (strong), which well correspond to the observed vibrational peaks, as shown in Fig. 3(b). Fig. 3(e) shows dominant vibrational modes at 1190, 1327, and 1609 cm−1. As the vibrational mode at 1327 cm−1 includes displacement vectors on the carboxylate anchor in contrast to the other vibrations, the vibrational frequency is sensitive to the surface state, which results in inhomogeneous broadening of the vibrational peak. This is the reason why the vibrational peak at 1356 cm−1 is broader than the others and the observed relative intensity is much lower than the calculated one. Therefore, the DFT calculation well reproduces the vibrational structure of the SnO2–4-DMABA surface complex, supporting the chemisorption of 4-DMABA via the carboxylate group.
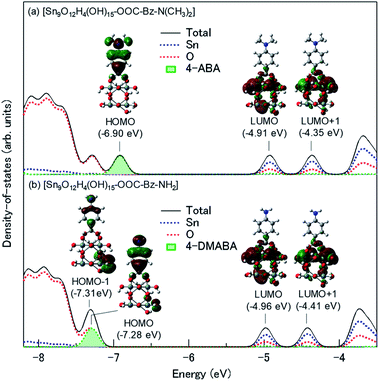
Fig. 4(a) shows photoelectron yield spectra of SnO2 nanoparticles adsorbed with and without 4-DMABA. SnO2 nanoparticles showed photoelectrons at photon energies higher than ca. 7.9 eV, which are assigned to the valence-band electrons. Accordingly, the ionization potential of SnO2 nanoparticles is estimated to be ca. 7.9 eV. By contrast, SnO2 nanoparticles adsorbed with 4-DMABA showed photoelectrons at much lower photon energies with an onset energy at ca. 6.0 eV. This photoelectron signal is attributable to electrons in HOMO of the adsorbed 4-DMABA. In order to confirm this assignment, we calculated total and partial densities-of-states (DOSs) of the model complex. As shown in Fig. 5(a), the HOMO of the adsorbed 4-DMABA lies within the band gap of the SnO2 nanocluster, which indicates that the photoelectron signal is assigned to the HOMO level of the adsorbed 4-DMABA. Note that the calculated HOMO energy (−6.90 eV) is lower than the ionization potential. This difference might be due to the negative surface charge of SnO2 nanoparticles, as reported in the previous literature.45 The negative surface charge elevates the HOMO level of the adsorbed 4-DMABA via coulombic interactions.
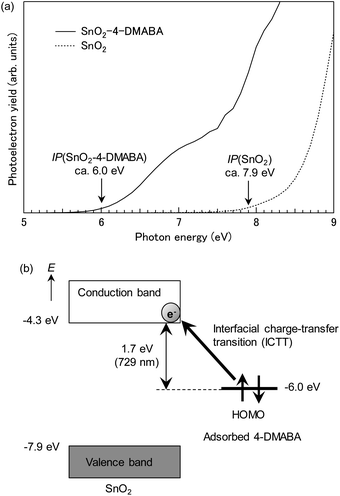 | ||
| Fig. 4 (a) Photoelectron yield spectra of SnO2 nanoparticles adsorbed with and without 4-DMABA and (b) energy level diagram of the SnO2–4-DMABA surface complex. | ||
Based on the estimated ionization potentials, the energy level diagram of the SnO2–4-DMABA surface complex is depicted, as shown in Fig. 4(b). The energy of the conduction-band bottom of SnO2 is estimated to be −4.3 eV vs. vacuum level from the reported band gap (Eg = ca. 3.6 eV).41 The estimated conduction-band edge is lower by 0.25 eV than that (−4.05 eV)46 of anatase TiO2, which is consistent with the reported result in the literature.47 The energy difference of 1.7 eV between the conduction-band bottom of SnO2 and HOMO of the adsorbed 4-DMABA approximately agrees with the onset energy (1.77 eV) of the broad absorption band of the SnO2–4-DMABA complex. This result indicates that the absorption band is attributed to ICTT from the HOMO of the adsorbed 4-DMABA to the conduction band of SnO2 nanoparticles.
Fig. 6(a) shows the electronic excitation spectrum of the model complex calculated by time-dependent DFT (TD-DFT) calculations. The model complex shows relatively strong electronic excitation at 796 and 587 nm in the visible region. These excitations are assigned to the HOMO → LUMO and HOMO → LUMO+1 electronic transitions, respectively, as shown in Table 1. LUMO+1 denotes the second lowest unoccupied molecular orbital. The LUMO and LUMO+1 correspond to the conduction band of SnO2, as shown in Fig. 5(a). Therefore, these excitations are attributed to ICTTs from the HOMO of the adsorbed 4-DMABA to the conduction band of SnO2, supporting the above-mentioned ICTT assignment. As shown by the isosurface plots in the inset of Fig. 5(a), the LUMO and LUMO+1 are significantly delocalized on the carboxylate anchor moiety of the adsorbed 4-DMABA. The delocalization of the unoccupied orbitals on the carboxylate group increases the transition dipole moments of ICTTs in SnO2. This is the main mechanism for ICTT in the SnO2 surface coordination complexes with the benzoic acid derivatives.
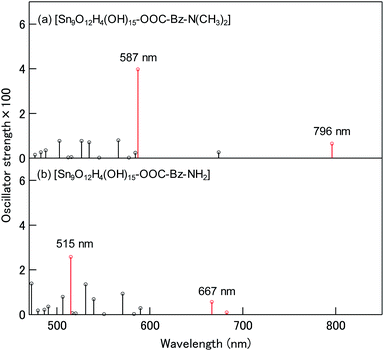 | ||
| Fig. 6 Calculated electronic excitation spectra of (a) [Sn9O12H4(OH)15–OOC–Bz–N(CH3)2] and (b) [Sn9O12H4(OH)15–OOC–Bz–NH2]. ICTTs are shown red. | ||
| Adsorbate | λ (nm) | f | Electronic configuration |
|---|---|---|---|
| 4-DMABA | 587 | 0.0398 | HOMO → LUMO+1 (98%) |
| 796 | 0.0065 | HOMO → LUMO (99%) | |
| 4-ABA | 515 | 0.0258 | HOMO → LUMO+1 (67%) |
| HOMO−1 → LUMO+1 (31%) | |||
| 667 | 0.0057 | HOMO → LUMO (52%) | |
| HOMO−1 → LUMO (47%) |
Fig. 6(b) shows the electronic excitation spectrum of the model complex with 4-ABA, [Sn9O12H4(OH)15–OOC–Bz–NH2]. The model complex shows two dominant ICTT excitations at 667 and 515 nm. The lower energy ICTT is the mixed electronic excitation of HOMO → LUMO and HOMO−1 → LUMO and the higher energy ICTT is the mixed electronic excitation of HOMO → LUMO+1 and HOMO−1 → LUMO+1. HOMO−1 denotes the second highest occupied molecular orbital. Fig. 5(b) indicates that the HOMO at −7.28 eV in the SnO2–4-ABA model complex is predominantly distributed on the adsorbed molecule (87%) with weak delocalization on surface hydroxy groups. In contrast, the HOMO−1 at −7.31 eV is mainly distributed on surface hydroxy groups and slightly delocalized onto the adsorbate (12%). Therefore, these excitations have ICTT character. The lower energy ICTT red-shifts from 667 (4-ABA) to 796 nm (4-DMABA) by 0.30 eV and the higher energy ICTT red-shifts from 515 (4-ABA) to 587 nm (4-DMABA) by 0.30 eV. This calculation result quantitatively agrees with the above-mentioned experimental result of the red-shift (0.30 eV) of the ICTT band by changing the substituent group from the amino group to dimethylamino group. Thus, the red-shift originates from the increase in the HOMO energy from −7.28 (4-ABA) to −6.90 eV (4-ABA), as shown in Fig. 5.
Conclusion
In summary, we demonstrated ICTT in SnO2 nanoparticles for the first time. SnO2 nanoparticles show a broad ICTT band in the visible region upon chemisorption of 4-DMABA and 4-ABA via the carboxylate group. The wavelength range of ICTT absorption significantly changes depending on the kind of substituent group in the benzoic acid derivatives. We can control the ICTT absorption range by adjusting the electron-donating ability of substituent group. Our research opens up a way to the fundamental research of ICTT in SnO2 and its wide applications in solar energy conversions and chemical sensing.Conflicts of interest
There are no conflicts to declare.Acknowledgements
We thank Mr T. Amano and Mr K. Nakajima of Bunkoukeiki for their kind cooperation in photoelectron yield measurements. The elementary analysis was performed using the instrument at the Center for Instrumental Analysis of Gunma University.Notes and references
- J. Moser, S. Punchihewa, P. P. Infelta and M. Grätzel, Langmuir, 1991, 7, 3012 Search PubMed.
- T. Rajh, J. M. Nedeljkovic, L. X. Chen, O. Poluektov and M. C. Thurnauer, J. Phys. Chem. B, 1999, 103, 3515 CrossRef CAS.
- T. Rajh, L. X. Chen, K. Lukas, T. Liu, M. C. Thurnauer and D. M. Tiede, J. Phys. Chem. B, 2002, 106, 10543 CrossRef CAS.
- J. Fujisawa, S. Matsumura and M. Hanaya, Chem. Phys. Lett., 2016, 657, 172 CrossRef CAS.
- J. Fujisawa, T. Eda, G. Giorgi and M. Hanaya, J. Phys. Chem. C, 2017, 121, 18710 CrossRef CAS.
- D. N. Sredojević, T. Kovač, E. Džunuzović, V. Ðorđević, B. N. Grgur and J. M. Nedeljković, Chem. Phys. Lett., 2017, 686, 167 CrossRef.
- J. Fujisawa, R. Muroga and M. Hanaya, Phys. Chem. Chem. Phys., 2015, 17, 29867 RSC.
- J. Fujisawa, R. Muroga and M. Hanaya, Phys. Chem. Chem. Phys., 2016, 18, 22286 RSC.
- A. G. Thomas, M. J. Jackman, M. Wagstaffe, H. Radtke, K. Syres, J. Adell, A. Lévy and N. Martsinovich, Langmuir, 2014, 30, 12306 CrossRef CAS PubMed.
- J. Fujisawa and M. Nagata, Chem. Phys. Lett., 2015, 619, 180 CrossRef CAS.
- S. Manzhos and K. Kotsis, Chem. Phys. Lett., 2016, 660, 69 CrossRef CAS.
- J. Fujisawa and M. Hanaya, J. Phys. Chem. C, 2018, 122, 8 CrossRef CAS.
- M. Bledowski, L. Wang, A. Ramakrishnan, O. V. Khavryuchenko, V. D. Khavryuchenko, P. C. Ricci, J. Strunk, T. Cremer, C. Kolbeck and R. Beranek, Phys. Chem. Chem. Phys., 2011, 13, 21511 RSC.
- J. Fujisawa, Chem. Phys. Lett., 2020, 739, 136974 CrossRef CAS.
- R. Jono, J. Fujisawa, H. Segawa and K. Yamashita, J. Phys. Chem. Lett., 2011, 2, 1167 CrossRef CAS PubMed.
- S. Manzhos, R. Jono, K. Yamashita, J. Fujisawa, M. Nagata and H. Segawa, J. Phys. Chem. C, 2011, 115, 21487 CrossRef CAS.
- J. Fujisawa, Phys. Chem. Chem. Phys., 2015, 17, 12228 RSC.
- J. Fujisawa, Energies, 2020, 13, 2521 CrossRef CAS.
- V. H. Houlding and M. Grätzel, J. Am. Chem. Soc., 1983, 105, 5695 CrossRef CAS.
- S. Ikeda, C. Abe, T. Torimoto and B. Ohtani, J. Photochem. Photobiol., A, 2003, 160, 61 CrossRef CAS.
- E. A. Rozhkova, I. Ulasov, B. Lai, N. M. Dimitrijevic, M. S. Lesniak and T. Rajh, Nano Lett., 2009, 9, 3337 CrossRef CAS PubMed.
- N. M. Dimitrijevic, E. Rozhkova and T. Rajh, J. Am. Chem. Soc., 2009, 131, 2893 CrossRef CAS PubMed.
- G. Zhang and W. Choi, Chem. Commun., 2012, 48, 10621 RSC.
- T. Kamegawa, H. Seto, S. Matsuura and H. Yamashita, ACS Appl. Mater. Interfaces, 2012, 4, 6635 CrossRef CAS PubMed.
- M. Bledowski, L. Wang, A. Ramakrishnan, A. Bétard, O. V. Khavryuchenko and R. Beranek, ChemPhysChem, 2012, 13, 3018 CrossRef CAS PubMed.
- S. P. Pitre, T. P. Yoon and J. C. Scaiano, Chem. Commun., 2017, 53, 4335 RSC.
- K. L. Orchard, D. Hojo, K. P. Sokol, M.-J. Chan, N. Asao, T. Adschiri and E. Reisner, Chem. Commun., 2017, 53, 12638 RSC.
- J.-L. Shi, H. Hao, X. Li and X. Lang, Catal. Sci. Technol., 2018, 8, 3910 RSC.
- J.-L. Shi, H. Hao and X. Lang, Sustainable Energy Fuels, 2019, 3, 488 RSC.
- J. Fujisawa, N. Kikuchi and M. Hanaya, Chem. Phys. Lett., 2016, 664, 178 CrossRef CAS.
- J. Fujisawa, S. Matsumura and M. Hanaya, ChemistrySelect, 2016, 1, 5590 CrossRef CAS.
- J. Fujisawa, T. Eda and M. Hanaya, Chem. Phys. Lett., 2017, 684, 328 CrossRef CAS.
- J. Fujisawa, S. Matsumura and M. Hanaya, ChemistrySelect, 2017, 2, 6097 CrossRef CAS.
- A. Musumeci, D. Gosztola, T. Schiller, N. M. Dimitrijevic, V. Mujica, D. Martin and T. Rajh, J. Am. Chem. Soc., 2009, 131, 6040 CrossRef CAS PubMed.
- S. J. Hurst, H. C. Fry, D. J. Gosztola and T. Rajh, J. Phys. Chem. C, 2011, 115, 620 CrossRef CAS.
- J. Fujisawa, N. Kaneko, T. Eda and M. Hanaya, Chem. Commun., 2018, 54, 8490 RSC.
- J. Fujisawa, T. Eda and M. Hanaya, J. Phys. Chem. C, 2016, 120, 21162 CrossRef CAS.
- T. Eda, J. Fujisawa and M. Hanaya, J. Phys. Chem. C, 2018, 122, 16216 CrossRef CAS.
- J. Fujisawa, N. Kaneko and M. Hanaya, Chem. Commun., 2020, 56, 4090 RSC.
- J. Fujisawa, Chem. Phys. Lett., 2021, 778, 138774 CrossRef CAS.
- M. Batzill and U. Diebold, Prog. Surf. Sci., 2005, 79, 47 CrossRef CAS.
- F. Weigend and R. Ahlrichs, Phys. Chem. Chem. Phys., 2005, 7, 3297 RSC.
- F. Weigend, Phys. Chem. Chem. Phys., 2006, 8, 1057 RSC.
- M. J. Frisch, Gaussian 09, revision D.01, Gaussian Inc, Wallingford, CT, 2009 Search PubMed.
- X. Li, Q. Yu, C. Yu, Y. Huang, R. Li, J. Wang, F. Guo, Y. Zhang, S. Gao and L. Zhao, J. Mater. Chem. A, 2015, 3, 8076 RSC.
- J. Fujisawa, T. Eda and M. Hanaya, Chem. Phys. Lett., 2017, 685, 23 CrossRef CAS.
- J. M. Bolts and M. S. Wrighton, J. Phys. Chem., 1976, 80, 2641 CrossRef CAS.
| This journal is © The Royal Society of Chemistry 2021 |

