
 Open Access Article
 This Open Access Article is licensed under a Creative Commons Attribution-Non Commercial 3.0 Unported Licence
Projection to latent correlative structures, a dimension reduction strategy for spectral-based classification†
Guillaume Laurent Erny *a,
Elsa Britob,
Ana Bárbara Pereirac,
Andreia Bento-Silvabde,
Maria Carlota Vaz Pattob and
Maria Rosario Bronzebcd
*a,
Elsa Britob,
Ana Bárbara Pereirac,
Andreia Bento-Silvabde,
Maria Carlota Vaz Pattob and
Maria Rosario Bronzebcd
aLEPABE – Laboratory for Process Engineering, Environment, Biotechnology and Energy, Faculdade de Engenharia da Universidade do Porto, Rua Dr Roberto Frias, 4200-465 Porto, Portugal. E-mail: guillaume@fe.up.pt
bITQB NOVA, Instituto de Tecnologia Química e Biológica António Xavier, Universidade Nova de Lisboa, Avenida da República, 2780-157 Oeiras, Portugal
ciBET, Instituto de Biologia Experimental e Tecnológica, Avenida da República, Quinta-do-Marquês, Estação Agronómica Nacional, Apartado 12, 2780-901 Oeiras, Portugal
dFCT NOVA, School of Science and Technology, New University of Lisbon, Caparica, Portugal
eFFULisboa, Faculdade de Farmácia da Universidade de Lisboa, Av. das Forças Armadas, 1649-019, Lisboa, Portugal
First published on 1st September 2021
Abstract
Latent variables are used in chemometrics to reduce the dimension of the data. It is a crucial step with spectroscopic data where the number of explanatory variables can be very high. Principal component analysis (PCA) and partial least squares (PLS) are the most common. However, the resulting latent variables are mathematical constructs that do not always have a physicochemical interpretation. A new data reduction strategy, named projection to latent correlative structures (PLCS), is introduced in this manuscript. This approach requires a set of model spectra that will be used as references. Each latent variable is the relative similarity of a given spectrum to a pair of reference spectra. The latent structure is obtained using every possible combination of reference pairing. The approach has been validated using more than 500 FTIR-ATR spectra from cool-season culinary grain legumes assembled from germplasm banks and breeders' working collections. PLCS has been combined with soft discriminant analysis to detect outliers that could be particularly suitable for a deeper analysis.
Introduction
The term chemometrics was defined in 1971 by Svante Wold as “The science of relating measurements made on a chemical system or process to the state of the system via application of mathematical or statistical methods”.1,2 While many algorithms are not new, it is only in the past decade that numerical-analysis software (Python, R, MATLAB, Excel…) started to incorporate easy to use chemometrics and machine learning algorithms. Thus, there is growing interest from chemists to apply advanced chemometrics tools in their daily work to extract as much knowledge as possible from their data.3,4Spectroscopic data are particularly interesting for chemometrics techniques. Multiple applications have been developed, either for multilinear calibrations that allow qualitative analysis of the principal elements,5 or to identify samples via clustering (unsupervised) or classification (supervised) methods. One of the key issues when working with spectral data is the high number of predictor variables (intensities as a function of wavelengths, for example) with many multicollinearities. A variable selection method (Lasso or elastic net, for example),6 or dimension reductions are therefore necessary.7,8
Dimension reductions use latent variables (LV) to represent the original data in a more compact form with minimal information loss. The most common approaches are linear discriminant analysis (LDA), principal component analysis (PCA) and partial least squares (PLS). Each latent variable is a combination of all original variables while fulfilling a specific criterium. They are mathematical constructs and are not always sensical in a spectroscopic way. Dimension reduction is often used in conjunction with clustering or classification, allowing predicting the nature of unknown samples. In chemometrics, Partial Least-Squares Discriminant Analysis (PLS-DA) is the method of choice.9 However, as recently pointed out by Rodionova and co-workers, discriminant analysis (DA) and PLS-DA is not an appropriate authentication method.10 The main drawback is the inability of classical (or hard) DA to classify a sample that does not belong to one of the predefined classes. However, in chemical analysis, samples are often contaminated (willingly or not), resulting in many potential classes. In recent works, Pomerantsev and co-workers introduced soft discriminant analysis (softDA) to classify a sample to one, multiple or no classes using the Mahalanobis distances.11,12
This manuscript aims to introduce a new data reduction strategy that makes use of model spectra. The latent structure is built as the relative correlation of the spectra with every pairing of model spectra and was named Projection to Latent Correlative Structures (PLCS). The latent structure is then used with a soft discriminant analysis to classify samples. The approach is validated with a large dataset of grains analysed by FTIR-ATR. 500 accessions of the most important European cool season culinary grain legumes, assembled from germplasm banks and breeders working collections, were analysed (LEGATO project germplasm collections). Pea (Pisum sativum), grass pea (Lathyrus sativus), chickpea (Cicer arietinum), lentil (Lens culinaris) and faba bean (Vicia faba) accessions spectroscopic relationships (or diversity) were cleared out.
Theory
Projection to latent correlative structures
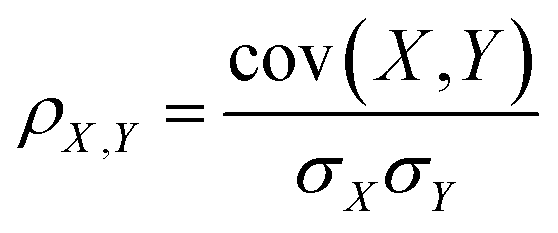
PLCS axes aim to compare the relative similarities between an unknown spectrum and a series of pairs of reference spectra. The similarity between spectra is measured using the Pearson correlation coefficient, defined as
 | (1) |
Selecting two references spectra, the dissimilarity indexes, measured as 1 − ρX,Y, between those references and all spectra are measured. An example is shown in Fig. 1(A) with the data that will be described below. The first axis is the dissimilarity 1 − ρ(Xi, Ylentil) between the intensity at each wavelength for each sample (Xi) and the reference lentil spectrum (Ylentil). The second axis is the dissimilarity 1 − ρ(Xi, Yfababean) between the intensity at each wavelength for each sample (Xi) and the reference faba bean spectrum (Yfababean). Additional information about the reference spectra can be found in the Experimental section. We inferred the latent axis as the line passing through the dissimilarity indexes of the two models spectra (black line in Fig. 1A). Spectra are projected to this axis (Fig. 1B).
 | ||
| Fig. 1 (A) Projection of all spectra on the latent plane obtain by measuring the dissimilarity with the reference spectra of lentil and faba bean; (B) projection to the latent axis lentil <=> faba bean. The black line in (A) is the vector passing through the dissimilarity indexes of the two models spectra that is the latent axis faba bean <=> lentil. | ||
One latent axis is built for every possible pairing of reference spectrum. With five model spectra, ten latent axes are extrapolated. An example of a two-dimensional representation is presented in Fig. 2.
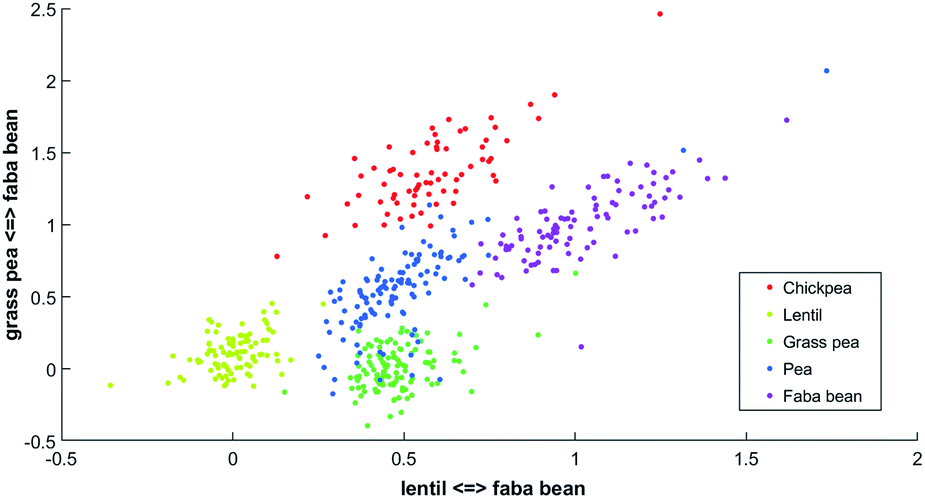 | ||
| Fig. 2 Two-dimensional PLCS of the beans FTIR-ATR spectra with the lentil <=> faba bean axis and the grass pea <=> faba bean axis. | ||
In this new representation, each spectrum is described by its relative similarity between a set of reference spectra. This representation is easy to understand; points in the bottom left correspond to spectra that will be more similar to lentil than faba bean and more similar to grass pea than faba bean.
Properties of PLCS
Unlike PCA and PLS, in PLCS there is neither ranking of the LV nor constraint of orthogonality. It is therefore important to test for every possible combination of axes. However, the number of latent variables obtained with PLCS is low. For example, with 5 model spectra, the total number of LV will be 10, whereas, with 10 model spectra, the total number of LV will be 45.The Pearson correlation coefficient (eqn (1)) is used to measure the similarity between spectra. This is particularly suitable for spectral-based applications as it is invariant under constant shift or multiplicative factor:
| corr(X,Y) = corr(a + bX,c + dY) | (2) |
Thus, there is no need to normalise the spectra for variation of intensities nor to correct for constant baseline drift,13 removing potential source of error or bias.
Experimental section
Samples preparation and characterisation
The different seeds from LEGATO project (grass pea (Lathyrus sativus n = 116), chickpea (Cicer arietinum n = 87), pea (Pisum sativus n = 119), faba bean (Vicia faba n = 93) and lentil (Lens culinaris n = 93)) were dried at 40 °C and milled using a miller Retsch cyclone mill with particle size under 0.8 mm. The different flours were stored at −20 °C.FTIR-ATR spectroscopy
The equipment used was a Thermo Scientific FTIR spectrometer (San Jose, USA) Class 1 Laser Product Nicolet 6100 using an ATR accessory with a diamond crystal. This crystal provided an angle of incidence of 42°. The acquisition of the spectra was performed using the software OMNIC version 7.3 (Thermo Electron Corporation). The background spectrum of the air was collected before each sample spectrum acquisition. The crystal was cleaned using water and acetone and dried with a soft tissue. For the sample spectrum acquisition, the different flours were placed in the ATR crystal and the spectra were recorded with 32 scans between 4000–650 cm−1 and with a resolution of 4 cm−1. All data used in this work are available in the Zenodo repository at the address: https://zenodo.org/record/5075052#.YOVp_OhKiUl.14Programming and software
Matlab R2021a (Mathworks) was used for this work; functions were programmed and run using a PC equipped with an Intel Core i7 CPU (2.80 GHz) and 18.0 GB RAM. The functions fitcdiscr, plsregress, pca, cvpartition from the Statistics and Machine Learning toolbox (Mathworks) were used for the discriminant analysis, Partial Least Squares, principal component analysis, and cross-validation, respectively. The functions sgolay and isoutlier from the Signal Processing Toolbox (Mathworks) were used to smooth and derivate the spectra and find outliers.Data analysis
For PCA, the Matlab function pca and the training set (Xtraining) were used to calculate the matrix of loadings (XpcL) and the score matrix of the training set (XPCS_training). Score matrix of the test data (XPCS_test) was calculated using
| XPCS_test = (Xtest − μ)XPCL | (3) |
For multi-class PLS, the Matlab function plsregress, the training set (Xtraining), and the dummy variable Y were used to calculate the predictor training score (XPLS_training) and the matrix of PLS weight W. The dummy matrix Y is inferred from the classes membership.11 The predictor scores for the test set (XPLS_test) were calculated using:15
| XPLS_test = (Xtest − μ)W | (4) |
For PLCS, the five references spectra were obtained by averaging all spectra in the training set belonging to the same class (pea, faba bean, grass pea, chickpea, and lentil). Then, the Pearson correlation coefficients between the averaged spectrum and labelled spectra were calculated. The outliers were detected and removed using the isoutlier function from Matlab with the median absolute deviation (MAD).16 The final references spectra were obtained by averaging all spectra with the same label after removing the outliers. The function PLCS_proj was used to measure the PLCS score, α_training and α_test. α is a mxn matrix with, m the number of samples, and n the number of possible combinations of two reference spectra. The line j in α corresponds to the relative Pearson correlation of the spectra j to all combinations of two references spectra. With the beans data, the original matrix was reduced from 1734 × 491 (1734 intensities measured at different wavelength with 491 samples) to 10 × 491 (ten possible combination of reference spectra measured with 491 samples).
 | (5) |
While in hard discriminant analysis (hardDA) and unknown sample is assigned to the closest group, with soft discriminant analysis (softDA),12 sample i belongs to class k when the distance dik is less than the threshold dcrit = χ−2(1 − α, K − 1).11χ−2 is the quantile of the chi-squared distribution, with K − 1 degree of freedom. Value α stands for a given type I error (in this work, α has been set to 0.05). By this rule, a sample can be simultaneously attributed to one, several or no classes depending on its Mahalanobis distances to the centres of each class.
| MAD = c × median(|Ai − median(A)|) | (6) |
 | ||
| Fig. 3 (A) PLCS and superimposed soft discriminant analysis using all the data with the axis lentil <=> grass pea and chickpea <=> grass pea, (B) PLCS and superimposed discriminant analysis after removal of the outliers. The coloured surfaces represent, for each cluster, the zone where d ≤ dcrit. Crosses in (A) indicate outliers. | ||
In Fig. 3A all data are used, while in Fig. 3B, the Mahalanobis distances have been recalculated after removing the outliers. In this representation, the position of the samples is the relative similarity of their spectrum to the reference spectra of chickpea and grass pea (axis 1) and the relative similarity of their spectrum to the reference spectra of lentil and grass pea. The coloured zones indicate the soft-classification zones where samples can be classified to one of the classes (d < dcrit). Zone in grey indicates multinomial classification. Samples that do not belong to any soft-classification zones may be outliers, adulterated samples or samples that do not belong to any classes. It is evident that the soft classification areas obtained after the DA is highly dependent on the outliers detected and the value of dcrit. Two-dimensional projections allow confirming the outlier's selection and the soft classifications zones visually (see Fig. 3). While DA can use a high number of variables, visual validation is only possible with up to three variables.
 | (7) |
 | (8) |
Results and discussion
Spectra pre-treatment
Recorded spectra are transformed from admittance to transmittance, and triplicates recordings are averaged to obtain a single spectrum. Further data transformations were assessed by their ability to classify the data better.Savitzky–Golay (SG) smoothing and derivation filters were tested,13 and the best combination of axes for classification were chosen as the one that provides the highest accurate prediction (number of true positives with the test set). For each model, with five reference spectra, ten PLCS axis were obtained. Thus 45 possible combinations of axes for a two-dimensional representation (120 combinations for a three-dimensional representation) were assessed. Results with underivatised, first, second and third derivatives of the spectra are given in Table 1. Only results with the optimal Savitzky–Golay parameters are reported. However, the order of the polynomial has been varied from 1 to 3, and the frame length from 3 to 25.
| Derivative of the spectra | ||||
|---|---|---|---|---|
| Nonea | 1stb | 2ndc | 3rdd | |
| a No derivative, no smoothing. b SG 1st derivative with polynomial order of 2 and frame length of 9. c SG 2nd derivative with polynomial order of 2 and frame length of 9. d SG 3rd derivative with polynomial order of 3 and frame length of 15. Ms, nm, ns and no are the number of samples assigned at d ≤ dcrit (ms: false positives, nm: multinomial classification, ns: true positives and no: unclassified). | ||||
| ms | 3 | 3 | 0 | 3 |
| nm | 60 | 34 | 7 | 6 |
| ns | 53 | 81 | 109 | 104 |
| no | 6 | 4 | 6 | 9 |
While in all cases, a reasonable separation was observed, the 2nd derivative of the spectra gave the clearest representations.
Comparison with PCA and PLS
PCA-softDA and PLS-softDA were compared with PLCS-softDA. With each model, the number of true positive (ns), false positive (ms), multinomial classification (nm) and unclassified (no) were measured. Usually with PCA and PLS, variables are selected in order of explained variance or covariance. However, to be consistent with PLCS, the first ten LV (90.9% of explained variance in PCA) were selected, and all combinations were tested in the soft-DA model. The best combination was chosen as the one with the highest single and correct classification (ns). For PCA, best softDA model was obtained when using the first and second principal components (explaining 70.0% of the variance), and for PLS the first and third LV gave best predictability. Results are summarised in Table 2; the two-dimensional PCA, PLS and PLCS projections with the selected latent variables by softDA can be appraised in Fig. 4.| PCA-softDA | PLS-softDA | PLCS-softDA | |
|---|---|---|---|
| ms | 2 | 1 | 0 |
| nm | 84 | 57 | 7 |
| ns | 32 | 63 | 109 |
| no | 4 | 1 | 6 |
 | ||
| Fig. 4 (A) PCA, (B) PLS and (C) PLCS two-dimensional representations of the second derivative of the FTIR-ATR spectra. | ||
Using the second derivatives of the spectra gave the best accuracy of predictive class membership with the softDA models with any data reduction strategy. All pre-treatments described in Spectra pre-treatment were tested. For the classification of the flours, PLS performs better than PCA (32 and 63 true positives, respectively). However, PLCS is superior to both (109 true positives).
Model complexity
As final validation, the model's complexity was increased from 2 LV to 4 LV with PLCS and from 2 LV to 15 LV with PLS.Table 3, bellow, summarised key results with 2 to 5 latent variables (LV). While with hardDA, the sum of true and false positives will always be equal to the number of samples, with softDA, some samples will be unclassified. As a general observation, with hard classification, the number of true positive increases as the complexity increases; however, with soft classification, the number of true positive reaches a maximum then decreases. At equivalent complexity, while a higher number of true positives is obtained with hard classification, a lower number of false positives is obtained with soft classification.
| PLCS 2 LV | PLCS 3 LV | PLCS 4 LV | PLS 2 LV | PLS 3 LV | PLS 4 LV | PLS 5 LV | ||
|---|---|---|---|---|---|---|---|---|
| a Number of true positives in hard and soft classification. b Number of false positives with hard and soft classifications. | ||||||||
| Hard | Truea | 117 | 116 | 118 | 98 | 116 | 118 | 121 |
| Falseb | 5 | 6 | 4 | 24 | 6 | 4 | 1 | |
| Soft | Truea | 109 | 111 | 107 | 56 | 101 | 103 | 101 |
| Falseb | 4 | 1 | 1 | 2 | 3 | 2 | 0 | |
PLSC-softDA allows higher true positive and lower false positive at low complexity (91.0% true positive, 0.8% false positive, 8.2% unclassified with 3 LV). However, the complexity with PLCS is limited due to the collinearity of the LV (the correlation matrix of the latent variables obtained with PLCS are in ESI, Fig SI1.tif†). Consequently, models could not be built with more than four LV. On the other end, complexity with PLS and PCA can be much higher as each LV retain unique information. For example, with this data, best results using PLS were obtained with five LV (82.8% true positive, 0% false positive, 17.2% unclassified). Furthermore, with ten variable, the true positive rate of hardDA is 100%, however, while with softDA false positive rate is 0%, the true positive rate decrease to 52.2% (15.6% with 15 variables).
PCA-softDA shows the same trend as with PLS-softDA, with an increase in predictivity as the complexity increase. Best results were obtained with five LVs (73.0% true positive, 0.8% false positive and 26.2 unclassified).
Conclusions
In this manuscript, a new dimension reduction algorithm has been described. Spectra are represented in the latent structure based on their relative similarity between a series of pairs of model spectra. While results with a complete dataset of flours analysed using FTIR-ATR were extremely promising, this approach will have to be tested with other data. However, this approach is believed to be particularly interesting for spectral-based classification or clustering. The combination of PLCS with soft discriminant analysis is particularly attractive when different or contaminated samples are to be expected. While with hard classification, those samples will be assigned to a group without any warnings. With soft classification, the sample will be unclassified and thus marked for further analysis if needed.The European grain legume germplasm has great potential for quality improvement. Spectroscopic techniques offer a reliable, cost-effective alternative approach for rapid and easy analysis of outlier genotypes with different spectroscopic fingerprints. They require few sample preparations, therefore, are very appealing for breeders to handle large numbers of samples. The PLCS classification approach differentiated among the 5-grain legume species allowing the identification of outliers in all the species. These accessions might in the future be associated with a specific biochemical composition after further analysis and may represent interesting sources of traits to introduce in breeding programs.
Author contributions
G. E, M. P and M. B. designed the research. G. E. programmed the Matlab functions. A. P., E. B. and A. S. analysed the samples. G. E. wrote the manuscript, all authors contributed to the redaction and revision of the manuscript.Conflicts of interest
There are no conflicts to declare.Acknowledgements
This work was financially supported by the projects: (i) UIDB/00511/2020 of the Laboratory for Process Engineering, Environment, Biotechnology and Energy – LEPABE - funded by national funds through the FCT/MCTES (PIDDAC); (ii) POCI-01-0145-FEDER-029702 funded by FEDER funds through COMPETE2020 – Programa Operacional Competitividade e Internacionalização (POCI) and by national funds (PIDDAC) through FCT/MCTES; (iii) UID/04551/2020 - the GREEN-IT funded by FCT; (iv) LEGATO project (grant agreement no. FP7-613551) funded by FP7 EU. This article is based upon work from COST Action CA 16215, supported by COST (European Cooperation in Science and Technology) https://www.cost.eu.Notes and references
- D. B. Hibbert, Pure Appl. Chem., 2016, 88, 407–443 CrossRef CAS.
- R. G. Brereton, J. Chemom., 2014, 28, 749–760 CrossRef CAS.
- A. Biancolillo, F. Marini, C. Ruckebusch and R. Vitale, Appl. Sci., 2020, 18, 6544–6578 CrossRef.
- A. Biancolillo and F. Marini, Front. Chem., 2018, 6, 1–14 Search PubMed.
- R. Bro, Anal. Chim. Acta, 2003, 500, 185–194 CrossRef CAS.
- A. P. Craig, A. S. Franca, L. S. Oliveira, J. Irudayaraj and K. Ileleji, Talanta, 2014, 128, 393–400 CrossRef CAS PubMed.
- S. Wold, M. Sjöström and L. Eriksson, Chemom. Intell. Lab. Syst., 2001, 58, 109–130 CrossRef CAS.
- H. Messai, M. Farman, A. Sarraj-Laabidi, A. Hammami-Semmar and N. Semmar, Foods, 2016, 5, 77 CrossRef PubMed.
- D. Ruiz-Perez, H. Guan, P. Madhivanan, K. Mathee and G. Narasimhan, BMC Bioinf., 2020, 21, 2 CrossRef PubMed.
- O. Y. Rodionova, A. V. Titova and A. L. Pomerantsev, TrAC, Trends Anal. Chem., 2016, 78, 17–22 CrossRef CAS.
- A. L. Pomerantsev and O. Y. Rodionova, J. Chemom., 2018, 32, e3030 CrossRef.
- Y. V. Zontov, O. Y. Rodionova, S. V. Kucheryavskiy and A. L. Pomerantsev, Chemom. Intell. Lab. Syst., 2020, 203, 104064 CrossRef CAS.
- Å. Rinnan, F. van den Berg and S. B. Engelsen, TrAC, Trends Anal. Chem., 2009, 28, 1201–1222 CrossRef.
- G. L. Erny, E. Brito, A. B. Pereira, A. Bento-Silva, M. C. V. Patto and M. R. Bronze, FTIR-ATR spectra of culinary grain legumes (pulse) flours, Version 1.0.0 [Data set] Search PubMed.
- Partial least-squares (PLS) regression – MATLAB plsregress, https://www.mathworks.com/help/stats/plsregress.html, accessed 6 July 2021 Search PubMed.
- C. Leys, C. Ley, O. Klein, P. Bernard and L. Licata, J. Exp. Soc. Psychol., 2013, 49, 764–766 CrossRef.
- Mahalanobis distance – MATLAB mahal, https://www.mathworks.com/help/stats/mahal.html, accessed 11 February 2021 Search PubMed.
- R. G. Brereton, J. Chemom., 2015, 29, 143–145 CrossRef CAS.
- P. J. Rousseeuw and C. Croux, J. Am. Stat. Assoc., 1993, 88, 1273–1283 CrossRef.
- G. Erny, Glerny/Projection-Latent-Correlative-Structure: Matlab functions for Projection to Latent Correlative Structures, a Dimension Reduction Strategy for Spectral-Based Classification, https://doi.org/10.5281/zenodo.5078461, accessed 7 July 2021 Search PubMed.
Footnote |
| † Electronic supplementary information (ESI) available: Fig. SI1.tif. Correlation matrix. See DOI: 10.1039/d1ra03359j |
| This journal is © The Royal Society of Chemistry 2021 |