 Open Access Article
Exploring the performance of a functionalized CNT-based sensor array for breathomics through clustering and classification algorithms: from gas sensing of selective biomarkers to discrimination of chronic obstructive pulmonary disease†
Giovanni Dreraab,
Sonia Freddi abc,
Aleksei V. Emelianov
 de,
Ivan I. Bobrinetskiydf,
Maria Chiesa
 a,
Michele Zanotti
 ab,
Stefania Pagliara
 ab,
Fedor S. Fedorov
 g,
Albert G. Nasibulin
 gh,
Paolo Montuschii and
Luigi Sangaletti
 *ab
*ab
aDepartment of Mathematics and Physics, Università Cattolica del Sacro Cuore, via dei Musei 41, 25121 Brescia, Italy. E-mail: luigi.sangaletti@unicatt.it
bSurface Science and Spectroscopy Lab @ I-Lamp, Università Cattolica del Sacro Cuore, Brescia Campus, Italy
cDepartment of Chemistry, Division of Molecular Imaging and Photonics, KU Leuven, Celestijnenlaan 200F, 3001 Leuven, Belgium
dNational Research University of Electronic Technology, Zelenograd, Moscow, 124498, Russia
eP. N. Lebedev Physical Institute of the Russian Academy of Sciences, Moscow, 119991, Russia
fBioSense Institute – Research and Development Institute for Information Technologies in Biosystems, University of Novi Sad, Dr Zorana Djindjica 1a, 21000 Novi Sad, Serbia
gSkolkovo Institute of Science and Technology, Moscow 121205, Russia
hAalto University, Department of Chemistry and Materials Science, FI-00076, Espoo, Finland
iDepartment of Pharmacology, Faculty of Medicine, Catholic University of the Sacred Heart, Largo Francesco Vito, 1, 00168 Roma, Italy
First published on 10th September 2021
Abstract
An array of carbon nanotube (CNT)-based sensors was produced for sensing selective biomarkers and evaluating breathomics applications with the aid of clustering and classification algorithms. We assessed the sensor array performance in identifying target volatiles and we explored the combination of various classification algorithms to analyse the results obtained from a limited dataset of exhaled breath samples. The sensor array was exposed to ammonia (NH3), nitrogen dioxide (NO2), hydrogen sulphide (H2S), and benzene (C6H6). Among them, ammonia (NH3) and nitrogen dioxide (NO2) are known biomarkers of chronic obstructive pulmonary disease (COPD). Calibration curves for individual sensors in the array were obtained following exposure to the four target molecules. A remarkable response to ammonia (NH3) and nitrogen dioxide (NO2), according to benchmarking with available data in the literature, was observed. Sensor array responses were analyzed through principal component analysis (PCA), thus assessing the array selectivity and its capability to discriminate the four different target volatile molecules. The sensor array was then exposed to exhaled breath samples from patients affected by COPD and healthy control volunteers. A combination of PCA, supported vector machine (SVM), and linear discrimination analysis (LDA) shows that the sensor array can be trained to accurately discriminate healthy from COPD subjects, in spite of the limited dataset.
Introduction
Pristine and functionalized carbon nanotube (CNT) layers are largely used to develop gas sensors.1 Indeed, CNT-based sensors display a remarkable stability over time and can operate at room temperature. Furthermore, their virtually one-dimensional nature is at the origin of the high surface to volume ratio and the remarkable charge transport properties, which are both required for highly sensitive gas/volatile sensors.Functionalization and decoration of CNTs offer manifold solutions that can be exploited to develop multiplexed systems for volatile organic compound (VOC) profiling in exhaled breath, a non-invasive, real-time, potential diagnostic tool of many diseases.2–4 For these reasons, electronic noses may become an important tool in diagnostics and in health screening programs.
Since each sensor in the electronic nose can respond to several different volatiles, thus reducing the selectivity towards specific analytes, suitable data processing from the whole set of sensors is required to obtain relevant information on exhaled breath VOC patterns. In this context, chemometrics and classification machine learning methods such as linear discriminant analysis (LDA), support vector machine (SVM), and principal component analysis (PCA) represent effective tools to analyse electronic nose data.5 Along with the sensitivity of properly functionalized CNTs, this statistical approach can, therefore, be quite helpful to cope with a fundamental challenge of gas/volatile sensing, i.e. the capability to monitor environments where a manifold of target molecules is present, providing a response that is able to discriminate the desired property, even though the sensors can be individually poorly selective.
Despite CNT-based sensors are largely used as single gas sensors, studies on electronic noses completely based on CNT and exposed to human breath samples are still few.6–10 Usually, these arrays are exposed to simulated (synthetic) human breath, consisting of a mixture of gas/volatile molecules11–13 or to single target gases/volatiles that are known biomarkers of specific diseases.14–31 For example, exhaled breath C6H6 is found elevated in lung cancer patients,21 whereas high exhaled breath NH3 concentrations are related to liver or kidney disease.2,32–34 Low ammonia concentrations35 and high NO2 concentrations are related to COPD;14,36,37 finally, H2S has been proposed as a biomarker of asthma.38,39
The use of CNT-based arrays in breath analysis applications is detailed in Table 1, where the different CNT-based sensing layers, data analysis strategy, and analysed samples (human breath, synthetic breath, biomarkers) are listed. Studies using CNT-based sensor arrays to analyse exhaled breath from sick individuals, are relatively few,6–10 mainly focused on cancer, particularly lung cancer.8,10,19,21–26 Most of these studies used PCA for data analysis. Only one study has been reported in patients affected by a chronic lung pathology other than cancer, i.e., chronic obstructive pulmonary disease (COPD).6 However, the recent COVID 19 pandemic has pointed out the importance of developing a rapid and reliable diagnostic test for respiratory diseases such as pneumonia and seasonal flu,40 along with the possibility to deploy screening test for the detection of COVID-19 infections.41 In this frame, e-noses might play a major role in the screening of respiratory diseases.
| Sensors material | Disease | Testing gas/volatiles | Data analysis | Ref. |
|---|---|---|---|---|
| SWCNT-organic semiconductors layers | COPD | Exhaled breath + 9 biomarkers | PCA, SVM | 6 |
| Bilayers of polycyclic aromatic hydrocarbons and SWCNT | Multiple sclerosis | Exhaled breath | DFA | 7 |
| Organically stabilized spherical gold NPs and SWCNTs capped with polycyclic aromatic hydrocarbons | Lung cancer | Exhaled breath | DFA | 8 |
| CNT and gold NPs | Precancerous gastric lesions and gastric cancer | Exhaled breath | DFA | 9 |
| Polymer and functionalized SWCNTs | Liver cancer | Exhaled breath + 5 biomarkers | PCA | 10 |
| CNT coated with nonpolymeric organic materials | Lung cancer | Simulated breath | PCA | 11 |
| CNT | Chronic renal failure | Simulated breath | PCA | 12 |
| Ionic liquid-CNT | — | Simulated breath and 8 biomarkers | PCA | 13 |
| Nanoparticle decorated SWCNT | — | 9 biomarkers | PCA | 16 |
| Transition metal decorated SWCNT | Lung cancer | 1 biomarker | 17 | |
| CNT/Hexa-peri-hexabenzocoronene bilayers | Cancer | 5 biomarkers | PCA | 18 |
| CNT-conductive polymer nanocomposites | Lung diseases | 9 biomarkers | PCA | 19 |
| MWCNT and gold NPs | — | 7 biomarkers | PCA | 20 |
| CNT-conductive polymer nanocomposite | Lung cancer | 19 biomarkers | PCA | 21 |
| COOH-MWCNT functionalized with polyhedral oligomeric silsesquioxanes (POSS) | Lung cancer, diabetes, malignant pleural mesothelioma | 9 biomarkers | PCA | 22 |
| Sulfonated poly(ether ketone) (SPEEK) nanocomposites based on hybrid nanocarbons | Lung cancer | 7 biomarkers | PCA | 23 |
| Surfactant-CNT | Lung cancer | 15 biomarkers | PCA | 24 |
| Polymer coated CNT | Lung cancer | 8 biomarkers | PCA | 25 |
| Carbon nanorods | Lung diseases | 19 biomarkers | PCA | 26 |
| DNA-CNT | Skin cancer | 18 biomarkers | 27 | |
| SWCNT and metallic NPs | — | 4 biomarkers | PCA | 28 |
| DNA-functionalized SWCNT | Lung cancer, excessive drinking and diabetes | 7 biomarkers | 29 | |
| SWCNT, SWCNT + NPs, polymer coated SWCNT | — | 6 biomarkers | PCA | 30 |
| Metal decorated MWCNT | — | 1 biomarker | LDA | 31 |
In the present study, the overall sensing behaviour of an 8-element array of CNT-based sensors, each with different functionalization, is investigated. In a previous study,6 we presented the general physical properties and behaviour of the array; in this study, we focus on a more comprehensive data analysis at all stages of the array testing: exposure to selected biomarkers, extraction of calibration curves of individual sensors, and exposure to a limited number of samples from COPD. Finally, we assess various multivariate analysis strategies to optimize the chemical sensor array classification capability.
According to this scheme, a set of NH3, NO2, C6H6, H2S exposures was carried out and the calibration curves for each of the 8 sensors in the array exposed to the 4 volatiles were built. Data were analysed by PCA, to assess the array selectivity and its capability to discriminate the four different target volatile molecules.
Next, the sensor array was exposed to exhaled breath samples from COPD patients and healthy control volunteers. The array ability to discriminate breathprints of sick and healthy volunteers was assessed by three different algorithms: PCA, SVM and LDA. In particular, we explored the classification ability of the present device in a limited number of individuals, including repeated measurements taken from the same individual and collected in different conditions (such as ambient relative humidity and temperature, different days). The sample collection was defined by a minimal set of rules, mostly based on the use of disposable materials. This approach might have applications in harsh environments where control over strict sample collection protocols may not be feasible.
Experimental
Sample preparation and characterization
To synthesise single-walled carbon nanotubes (SWCNTs) we utilised an aerosol chemical vapor deposition (CVD) method.42 Namely, SWCNTs were grown by gas-phase formation based on the thermal decomposition of ferrocene in the presence of carbon monoxide and deposited onto low-adhesive filter in the same process. SWCNT films with the thickness of about 30 nm were collected on the filter from the gas phase downstream of the reactor and subsequently dry-transferred43 on a polyethylene terephthalate (PET) substrate with a dimension of the sample of 1.5 × 1.0 cm2.The array of sensors was composed of 8 SWCNT films: one was made of pristine SWCNTs, the other one was UV-functionalized (hereafter called COOH), while the rest 6 films were functionalized with selected organic molecules, namely by DNA oligonucleotide (hereafter called DNA), α,α′-dihexylquaterthiophene (hereafter called Hex-4T-Hex), polyaniline (hereafter called PANI), perylene-3,4,9,10-tetracarboxylic-dianhydride (hereafter called PTCDA), tris(4-carbazoyl-9-ylphenyl)amine (hereafter called TCTA) and 4,4′-cyclohexylidenebis [N,N bis(4-methylphenyl) benzene-amine] (hereafter called TAPC).
DNA and PANI layers were deposited from an aqueous solution with a concentration of 0.5 mM and 0.1 μM, respectively, forming the monolayer on the top of nanotubes. Film of Hex-4T-Hex molecules was deposited via thermal evaporation at 70 °C and speed of 0.01 nm s−1 to form an average thickness of 5 nm. PTCDA molecules were evaporated at 120 °C and 0.025 nm s−1 and form a porous 4 nm film. TCTA film with the average thickness of 6 nm was formed via thermal evaporation at 105 °C and 0.012 nm s−1 speed. Film of TAPC with the thickness of 10–20 nm was deposited by the same technique at 77 °C and 0.1 nm s−1 speed.
The structural and optical properties of the samples were characterized by atomic force microscopy (AFM), transmission electron microscopy (TEM), UV-Vis and Raman spectroscopy.6 Cr/Pd (5 nm/150 nm) electrodes were sputtered through a paper mask on the opposite sides of the 1.5 × 1.0 cm2 sample.
Sensing properties
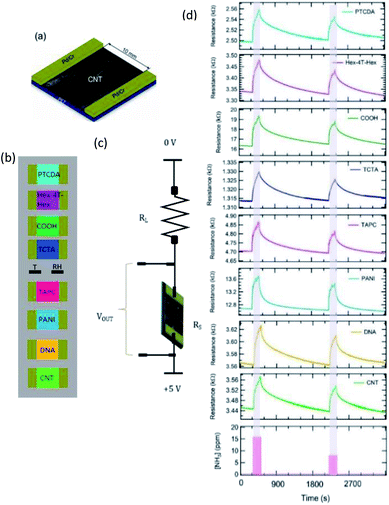
A schematic view of the SWCNT-based sensor is shown in Fig. 1a. The 8 sensors were set on a properly designed board (Fig. 1b), with 8 independent channels (single read out scheme is shown in Fig. 1c) for the simultaneous detection of each sensor's response. Relative humidity (RH) (humidity sensor HIH-4000 series – Honeywell sensing) and temperature (Thermistor NTC PCB 5K – Murata) were also collected by placing these sensors at the centre of the board (R and T in Fig. 1b). The sensor signal was acquired using a script written in the LabVIEW environment.The sensing properties of the array upon gas/volatile exposures were analysed in the chemo-resistive configuration, where the presence of gases/volatiles is detected monitoring the change in the resistance value of the sensitive element, i.e. bundles of SWCNTs (pristine or functionalized).
The chemiresistor basic electronic circuit includes a load resistor (RL) in series with the sensor, to which a constant voltage (V = 5 V) is applied. The resistance RS of the sensor is tracked by monitoring the voltage VOUT across the sample. The response, defined as ΔR/R0 = (R − R0)/R0, where R0 is the baseline resistance of the sensor measured without the gas/volatile and ΔR is the resistance change during the gas/volatile exposure, was then measured. Following a set of multiple exposures, calibration curves for each sensor were obtained by plotting the sensor response ΔR/R0 versus the gas/volatile concentration.
In order to probe the capability of the sensors array to discriminate different target molecules, the sensors array was exposed to 4 gases/volatiles: ammonia, benzene, hydrogen sulphide and nitrogen dioxide.
The exposure to ammonia has been carried out in laboratory air and NH3 concentration was measured with a properly calibrated sensor. Responses to benzene, hydrogen sulfide, and nitrogen dioxide were carried out in a sealed test chamber. In this case gas concentration was controlled by properly mixing dry air with analyte molecules through mass flow controllers. In all cases, humidity was constantly monitored through the RH sensor placed in the middle of the board. All measurements were performed at room temperature.
Breath analysis
Breath samples were collected (after signed consent) from 11 volunteers aged 22–88 years. Among them, 7 volunteers suffer from COPD, while 4 were healthy control volunteers. All volunteers were recruited within a research project funded by the Università Cattolica del Sacro Cuore in the frame of the 2016–2018 D 3.2 Strategic Program “Anapnoi”. For each volunteer, several samples were collected on different days. An overall number of 52 samples were analysed. Subject characteristics including age, gender, COPD category as well as the number of tests carried out for each subject are shown in Table S1 (in the ESI†). Breath sampling was carried out in a disposable bag (volume = 0.6 liters), containing the sensor array, and inflated by breath through a disposable plastic straw. This procedure took around 10–15 seconds until the bag was fully inflated. We did not record significant differences among volunteers during the bag inflation phase, likely due to the reduced volume to fill and to the lack of any filter along the collection pipeline, which could hinder the bag inflation step. The overall sensor exposure time inside the bag was set to 3 minutes, to let all sensors fully interact with the breath sample.Data analysis algorithms
Data obtained from gas/volatile exposures and exhaled breath samples are shown in ‘Sensing of selected biomarkers’ and ‘Breath analysis’ sections. Column mean-centring was used for data pre-treatment. PCA was used to analyse a set of 26 exposures from 4 gases/volatiles. PCA, LDA, and SVM were used to analyse 52 exhaled breath samples obtained from 11 subjects.Results and discussion
Sensing of selected biomarkers
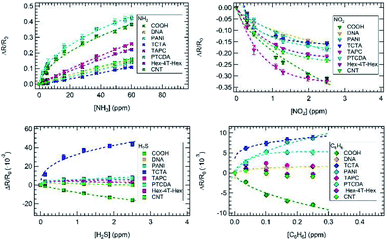
Fig. 1d shows an example of sensor array resistance variation during 3 min exposure to ammonia at 8.1 ppm and 15.9 ppm concentrations. All sensors show increased resistance due to the presence of ammonia, suggesting a p-type doping of CNTs.44 For all sensors, the resistance increase depends on ammonia concentration and the recovery is always reached in about 20 minutes.Calibration curves obtained by sensor array exposures at various ammonia concentrations are shown in Fig. 2. The same y-axis scale was used to plot all the sensor responses; the error bars, estimated on the basis of the signal-to-noise ratio, are basically negligible. COOH and PANI sensors displayed the greatest responses to ammonia.
All calibration curves shown in Fig. 2 display a linear behaviour, except PANI and COOH curves, which show a clear sublinear behaviour across the ammonia concentration range; all data were interpolated by the Freundlich isotherm (ΔR/R0 = A[NH3]pow, dashed line in Fig. 2), with an exponential factor (pow) that resulted to be virtually 1 for the six sensors that display a linear behaviour (see also Fig. S1 in the ESI†).
Similar data was obtained exposing the sensor array to different nitrogen dioxide, hydrogen sulphide and benzene concentrations as shown in Fig. 2.
All curves display a sub-linear behaviour. As expected, the ΔR/R0 value decreased upon NO2 exposure, as NO2 is known as an oxidizing molecule. In particular, COOH and TAPC sensors displayed the highest responses to nitrogen dioxide exposure, while DNA and TCTA sensors displayed the lowest ones. Hex-4T-Hex and CNT responses to hydrogen sulphide and benzene were quite low as compared to the noise and their evaluation was difficult; thus, we did not proceed with the dataset fitting. The same holds for the TAPC response to benzene.
Finally, it is worth noticing that the lowest volatile concentrations used to build the calibration curves were in the sub-ppm range (0.3 ppm for nitrogen dioxide, 0.12 ppm for hydrogen sulphide, and 50 ppb for benzene).
Following the analysis of the calibration curves, nitrogen dioxide (NO2) and ammonia (NH3) were selected to carry out a benchmarking with literature results based on CNT sensors and published since 2000. These volatiles are among the most used compounds to test chemical sensors, due to their oxidizing and reducing properties, respectively; in particular, testing of CNT-based sensors to evaluate their performances is often carried out with nitrogen dioxide (NO2) and ammonia (NH3).44
For these reasons, ammonia (NH3) and nitrogen dioxide (NO2) exposure datasets available in literature are much larger than hydrogen sulphide (H2S) and benzene exposure datasets, making a benchmarking statistically more significant.16,45–101
Fig. 3 shows this benchmarking, carried out by considering the sensitivity, S, defined as S = 100 × (ΔR/R0)/[gas/volatile], where [gas/volatile] is the gas/volatile (ammonia, NH3 or nitrogen dioxide, NO2) concentration. The comparison shows that the present results, with testing mainly in the low gas/volatile concentration range (1–10 ppm) are quite remarkable in terms of sensitivity for all sensors in the case of NO2 (Fig. 3 upper panel), and especially for PANI and COOH sensors in the case of NH3 (Fig. 3 lower panel).
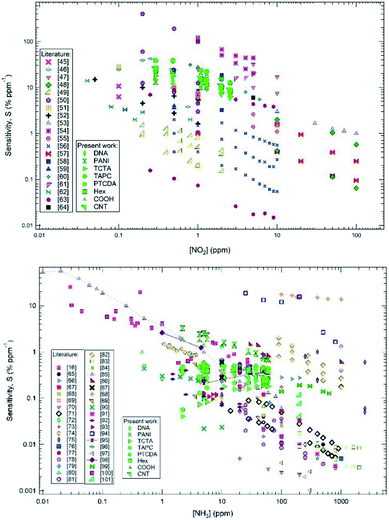 | ||
| Fig. 3 Benchmarking of the sensor array with respect to CNT-based chemiresistor performances for nitrogen dioxide (NO2) (upper panel) and ammonia (NH3) (lower panel) exposures. | ||
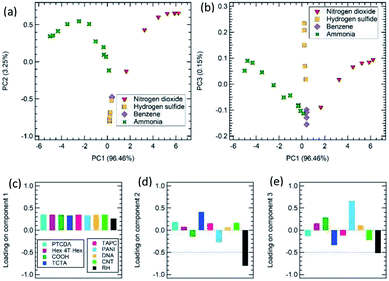
Sensor responses obtained following exposures to the 4 gases/volatiles and used to draw the calibration curves have been analyzed with PCA as shown in Fig. 4a and b. The resulting variance in the PCA space is 99.71% by considering the first and second components (PC1–PC2 plot, Fig. 4a) and 96.61% for the first and the third components (PC1–PC3 plot, Fig. 4b).
The contribution of ammonia and nitrogen dioxide are well separated in the PC1 vs. PC2 space (Fig. 4a), while benzene and hydrogen sulphide exposure data are overlapped. However, benzene and hydrogen sulphide can clearly be discriminated considering a 2D space generated by PC1 and PC3 (Fig. 4b). As expected, all 4 gases/volatiles follow a clear trend, which goes from the edges to the plot center as gas/volatile concentrations decrease. Furthermore, ammonia and nitrogen dioxide, which are a reducing and an oxidizing gas/volatile, respectively, span the opposite side of the space generated by both PC1–PC2, and PC1–PC3 component couples.
Loading plots for PC1, PC2, and PC3 help clarify the role of each individual sensor into the discrimination of target gas/volatile molecules. As shown in Fig. 4c, all sensors equally contribute to PC1 loadings, resulting in the capability to separate nitrogen dioxide (NO2) and ammonia (NH3) measurements along the PC1 axis of the PC1–PC2 space. Benzene and hydrogen sulphide (H2S) exposure data are not separated from each other and are found nearly superposed on a vertical line in the bottom part of the PC2 range. Thus, PC2 separates the ammonia (NH3) and nitrogen dioxide (NO2) pair couple from the benzene and hydrogen sulphide (H2S) pairs. The loading plots (Fig. 4d) show that RH sensor, and TCTA to a lesser extent, provide the major contribution to PC2. As shown by loading plots for PC3 (Fig. 4e), the discrimination between hydrogen sulphide (H2S) and benzene, provided by the PC3 component in the PC1–PC3 plot, can be related to the contribution of the PANI sensor and, to a lesser extent, to TCTA and RH sensors.
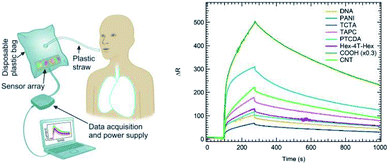
Breath analysis
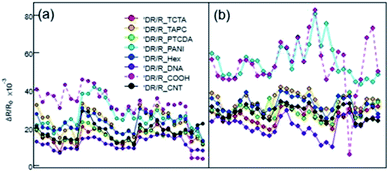
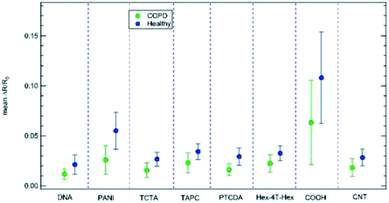
We exposed the sensors array to breath samples obtained from 4 healthy volunteers and 7 subjects with COPD. To avoid systematic bias in breath sampling, samples were collected on different days and environmental conditions. Subject characteristics and number of samples collected from each person are presented in Table S1† (in the ESI). Samples were collected asking the participants to fully exhale through a plastic straw into a disposable plastic bag where the sensor array was placed. After breath collection, the bags were sealed, and the sensor array exposed to breath sample for 180 seconds. Then, bags were opened, and the sensor array was flushed with dry air until recovery to baseline signal before exposing to the next breath sample. Fig. 5 shows a schematic representation of the breath sampling setup (left panel), along with an example of the 8-sensors array responses to an exhaled breath sample from a healthy subject (right panel). Sensors responses were analysed by PCA.An overview of the data collected from the 52 exposures considered in this study (Fig. 6) shows that a lower response of each sensor in the array is clearly detectable in sick patients with respect to healthy patients. The average and standard deviation for these values is reported in Fig. 7 for each sensor of the array. This finding is rather appealing and can be rationalized by relating the array response to the specific sensitivity to NO2 and NH3. Qualitatively, on the basis of literature (ref. 14, 36, 37 and 35, respectively) we know that COPD patients display a higher NO2 concentration and a lower NH3 concentration in the exhaled breath. Both facts are expected to decrease the overall resistance of the p-doped CNT layers upon exposure to exhaled breath. Indeed, NO2 is known to act as an electron acceptor when interacting with CNTs while NH3 behaves as an electron donor (see, e.g. ref. 44). Therefore, a high NO2 concentration increases the density of carriers (holes) in p-type CNTs thus decreasing their resistivity, while a decrease of NH3 concentration decreases the resistivity, as NH3 decreases the density of holes in p-type CNTs.
Apparently, the difference in signal intensity between healthy and sick patients could be regarded as a method for classification, as the mean value for healthy patients is always higher than the corresponding value for sick patients, but standard deviation, displayed in Fig. 7 is still too large, and superposition between the two classes (sick and healthy) can still occur. For this reason, PCA with SVM or LDA can provide more robust classification schemes, which are indeed explored in detail in the following.
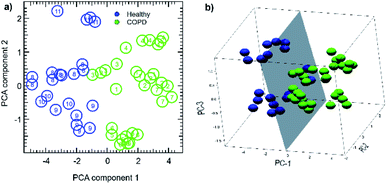
Fig. 8a shows the 2D-PC spaces obtained carrying out the analysis on the full sensors data set. An overall good cluster separation between healthy and COPD subjects can be detected on the first principal components, and classes can be well separated by a linear border with the inclusion of the second (Fig. 8a) and third (Fig. 8b) PCs. These are very promising results, since they were obtained with an unsupervised, simple data reduction algorithm such as PCA. The maximal data variance, related to the first PC and to its specific sensor linear combination, can then be used to discriminate between healthy and COPD subjects.
For this analysis, an additional humidity sensor was also considered. In fact, several studies report on the importance of taking into account humidity when performing gas/volatile sensing measurements.11,12,16,100 In our study, we found a small influence of RH in the data clustering. Finally, in Fig. 8a, each dot representing a breath sample has been labelled with the study number of the individual from whom it was obtained, as shown in Table S1 (in the ESI†); it is worth noticing that each subject contribution, collected at different times and on different days, tends to cluster in the same spatial region, especially healthy subjects data. These results confirm the reproducibility and reliability of our method.
In order to explore the accuracy of COPD classification, our dataset was further analysed by three algorithms: PCA, LDA, and SVM. In a practical application, the discriminating algorithm should be trained with a well-characterized initial dataset, which should provide the optimal linear combination of sensor results and the best boundary definition between the two data cluster. In this context, LDA can be used to better separate the two clusters, since it is specifically designed to maximize the variance of each subgroups with respect to their average distance; moreover, LDA results can be used to directly classify unknown data. We used SVM approach to find the optimal cluster separation plane for PCA.
The graphs of the two first principal components projections for both techniques are shown in Fig. 9a and b for PCA and LDA, respectively.
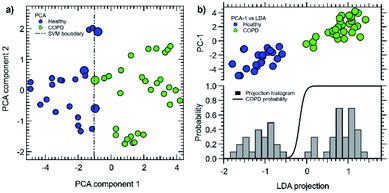 | ||
| Fig. 9 (a) PCA first and second principal components with optimal linear cluster boundaries (dashed lines). The corresponding support vectors are highlighted with larger dots. Please, note that the two data clusters can also be resolved by considering the first three PCA component (Fig. 6b). (b) first PCA component vs. LDA projection (top), with LDA projection histogram (bottom) and predicted probability for COPD identification (black line). | ||
Data have been standardized in the usual way, i.e. by removing each sensor average response and by normalizing by the corresponding standard deviation. As already shown, despite being an unsupervised method, the PCA principal component (PCA-1, horizontal axis in Fig. 9a) shows a remarkable separation of the two data classes; however, the class separation is not observed for the PCA-2 component.
LDA (Fig. 9b) leads to a C-1 dimensional data projection, where C is the class number. In this case, it defines a single direction in the feature space with the best cluster separation. We then represented the data by showing the PC-1 vs. LDA subspace; the cluster separation is clearly better for LDA. However, being a supervised method, it requires the a priori knowledge of each individual class, making it less suitable for prediction models. A good metric for LDA performance is the ratio between the internal class averages and the sum of the standard deviations of each class; we then obtained 1.7 for PC-1 and 2.9 for the LDA projection. The data distribution histogram is shown in the lower panel of Fig. 9b, together with the calculated probability function for COPD identification (black line). For LDA we defined the overall accuracy as the average of the identified probabilities associated to the projected data.
In order to better quantify the performances of PCA, we resorted to SVM analysis, as implemented in the LibSVM package.102 Such method allows defining a cluster boundary, by finding a data subgroup (the support vectors, larger dots in Fig. 9a) with the minimal interclass distance. Even if the two classes are formally perfectly separable, for this work we applied a standard linear kernel with a soft margin, thus trading the “perfect” boundary identification for a better reliability of the prediction model on possible additional unclassified data. The related cost function was calculated through cross-correlation methods. Due to the clear class separation and the relatively small number of measurements, in SVM we avoided the use of more complex kernel, such as Gaussian or polynomial ones. Furthermore, in addition to the identification of the best class border, SVM also allows for the calculation of identification probability, i.e. for the definition of a continuous function, which assigns a likelihood for each data point to belong to a certain class.
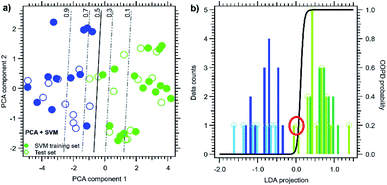
An example of probability functions for PCA is shown in Fig. 10a with contour lines. For each dataset, we can then evaluate an identification performance index (the ratio of the correctly labelled data) and an overall accuracy index, which represent the average probability. In a best-case scenario, both these values should be close to 1, since we expect to assign each data point to each class with the highest possible accuracy.
For the full dataset both methods show a perfect identification score, since the SVM boundary perfectly separates the two classes, but LDA shows a much better accuracy index (0.99) than PCA (0.91), due to the better class separation with respect to the boundary.
We then investigated the capability of these methods to actually classify unknown data. We carried out this analysis by removing a random section of the dataset to be used as an unlabelled test subset for SVM results and LDA. We removed up to Nt = 24 test patients from the N = 52 total group, by picking 4000 random subsets for each case.
For the PCA it is possible to actually perform data reduction with the full data set (thus with both classified and unclassified data), and then perform the SVM classification on its results. We choose to work with three principal components (as for LDA), since they describe 95% of the data variance. An example of PCA-SVM analysis with a reduced set (Nt = 24) is given in Fig. 10a. SVM probability function and boundary are calculated only considering the training set (filled circles) and then applied on a test subset (open circles). In this particular case, one COPD case (empty green circle) falls outside the p = 0.5 threshold and thus is wrongly labelled. It should be noticed that the data point position in Fig. 10a is identical to Fig. 9a, since the PCA is carried out on the whole dataset.
For the LDA case, it is not possible to actually perform the data reduction with the full data set because of the lack of classification for the unknown data. After normalizing the whole dataset (as in PCA), we then directly split the sensor data into a training and a test set, and we perform LDA on the training set only. The test set is then projected on the LDA direction. An example of LDA analysis with a reduced set is given in Fig. 10b. In this case, the point distribution of the LDA plot is different from Fig. 9b results, since the data reduction is evaluated on a different set. In the example of Fig. 10, two COPD case studies appeared as outliners among the test data (red circle).
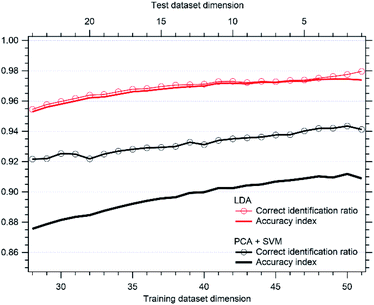
The results for the classification and accuracy index are shown in Fig. 11. PCA-SVM performs well, with an identification ratio larger than 92% and an accuracy index greater than 86% even after the removal of nearly half of the dataset. However, the removal of just one data point in PCA can lead to detection errors, dropping the identification ratio to 94% for the N = 51 dataset. On the contrary, LDA discrimination performances are extremely good, being greater than 95% even with the reduced dataset. Accuracy and identification ratios are very similar, due to the wide separation between classes and to the steepness of the probability functions in the inter-clusters region.
In the present approach SVM with a linear kernel turned out to be enough to separate the two expected clusters. This means that data are linearly separable, i.e. the dataset can be classified into two classes by using a single straight line (in the PC1–PC2 2-dimensional plot) or by a single plane (in the PC1–PC2–PC3 3-dimensional plot). With the aim to explore non-linear kernels, that can in principle be expected for larger data set, we added new experimental data to enlarge the dataset up to 130 measurements, collected from 50 (30 COPD + 20 healthy) patients. As shown in the ESI file (Fig. S2†), a cluster separation with a straight line (in the PC1–PC2 2-dimensional plot) or plane (in the PC1–PC2–PC3 3-dimensional plot) still works with this enlarged dataset, for this reason we did not further proceed in classification with non-linear kernels.
The present results then support the application potential for this sensor array, even with a relatively small training dataset such as the one shown in this study. While PCA still performs remarkably well and is computationally lighter, for a practical application LDA should be preferred, depending on the desired accuracy.
Conclusions
In conclusion, the overall sensing behaviour of an 8-element array of CNT-based sensors was investigated by exposing the array to a set of volatile biomarkers. Several exposures to ammonia (NH3), nitrogen dioxide (NO2), benzene (C6H6), and hydrogen sulphide (H2S) were carried out and calibration curves for each of the 8 sensors in the array exposed to the 4 volatiles were built. Data were analyzed by PCA, assessing the selectivity of the array, as well as its capability to discriminate the four different target gas/volatile molecules. The sensors performances have been evaluated through a benchmarking with CNT-based sensors in the case of NH3 and NO2 detection, while the main characteristics of the e-nose are compared with an updated list of e-noses equipped with CNT-based sensors.Following this phase, the sensors array was exposed to the exhaled breath samples obtained from COPD patients and healthy control volunteers. A combination of PCA, SVM, and LDA methods shows that the present sensor array can be trained to clearly discriminate healthy from COPD subjects, in spite of the relatively limited dataset. Accuracy indexes above 0.90 and 0.97 were obtained for PCA and LDA respectively.
Thus, the robustness of this approach supports its potential applications in harsh environments where control over strict sample collection protocols may not be feasible. Overall, further developments in the field are expected with the use of graphene-based sensors103,104 that, as the case of CNT, can operate at RT, a requirement that is drawing attention also in the case of metal-oxide based chemiresistors.105
Author contributions
G. Drera: formal analysis, methodology, software, writing – original draft; S. Freddi: formal analysis, writing – original draft, visualization, investigation; A. V. Emelianov: investigation, visualization; I. I. Bobrinetskiy: investigation, resources, writing – review & editing; M. Chiesa: resources, writing – review & editing; M. Zanotti: formal analysis, methodology, software; S. Pagliara: investigation; writing – review & editing F. S. Fedorov: investigation, writing – review & editing; A. G. Nasibulin: funding, investigation, resources, writing – review & editing; P. Montuschi: conceptualization, funding, writing – review & editing: L. Sangaletti: conceptualization, funding, writing – original draft.Conflicts of interest
There are no conflicts to declare.Acknowledgements
G. D., S. P., M. C., S. F., P. M., and L. S. acknowledge funding by the Università Cattolica del Sacro Cuore in the frame of the 2016–2018 D 3.2 Strategic Program “Anapnoi”. L. S. and S. P. acknowledge funding by the Italian Ministry of Education, Universities, and Research (MIUR) through the PRIN 2017-N. 2017NYPHN8 (MADAM) program. F. S. F. and A. G. N. acknowledge Russian Foundation of Basic Research project no. 20-03-00804. I. I. B. acknowledges funding from the European Union's Horizon 2020 research and innovation programme under grant agreement No. 739570 (ANTARES).References
- A. Goldoni, V. Alijani, L. Sangaletti and L. D'Arsiè, Advanced promising routes of carbon/metal oxides hybrids in sensors: a review, Electrochim. Acta, 2018, 266, 139–150 CrossRef CAS.
- C. Di Natale, R. Paolesse, E. Martinelli and R. Capuano, Solid-state gas sensors for breath analysis: a review, Anal. Chim. Acta, 2014, 824, 1–17 CrossRef CAS PubMed.
- R. Vishinkin and H. Haick, Nanoscale Sensor Technologies for Disease Detection via Volatolomics, Small, 2015, 11, 6142 CrossRef CAS PubMed.
- A. H. Jalal, F. Alam, S. Roychoudhury, Y. Umasankar and N. P. S. Bhansali, Prospects and Challenges of Volatile Organic Compound Sensors in Human Healthcare, ACS Sens., 2018, 3, 1246–1263 CrossRef CAS PubMed.
- P. Reimann and A. Schutze, Sensor Arrays, Virtual Multisensors, Data Fusion, and Gas Sensor Data Evaluation, in Gas Sensing Fundamentals Volume, Kohl C.-D. and Wagner T., Springer, Heidelberg, 2014, vol. 15, p. 67 Search PubMed.
- S. Freddi, A. V. Emelianov, I. I. Bobrinetskiy, G. Drera, S. Pagliara, D. S. Kopylova, M. Chiesa, G. Santini, N. Mores, U. Moscato, A. G. Nasibulin, P. Montuschi and L. Sangaletti, Development of a Sensing Array for Human Breath Analysis Based on SWCNT Layers Functionalized with Semiconductor Organic Molecules, Adv. Healthcare Mater., 2020, 9, 2000377 CrossRef CAS PubMed.
- R. Ionescu, Y. Broza, H. Shaltieli, D. Sadeh, Y. Zilberman, X. Feng, L. Glass-Marmor, I. Lejbkowicz, K. Müllen, A. Miller and H. Haick, Detection of Multiple Sclerosis from Exhaled Breath Using Bilayers of Polycyclic Aromatic Hydrocarbons and Single-Wall Carbon Nanotubes, ACS Chem. Neurosci., 2011, 2, 687–693 CrossRef CAS PubMed.
- I. Nardi-Agmon, M. Abud-Hawa, O. Liran, N. Gai-Mor, M. Ilouze, A. Onn, J. Bar, D. Shlomi, H. Haick and N. Peled, Exhaled Breath Analysis for Monitoring Response to Treatment in Advanced Lung Cancer, J. Thorac. Oncol., 2016, 11(6), 827–837 CrossRef PubMed.
- H. Amal, M. Leja, K. Funka, R. Skapars, A. Sivins, G. Ancans, I. Liepniece-Karele, I. Kikuste, I. Lasina and H. Haick, Detection of precancerous gastric lesions and gastric cancer through exhaled breath, Gut, 2016, 65, 400–407 CrossRef CAS PubMed.
- T. Eamsa-ard, T. Seesaard, T. Kitiyakara and T. Kerdcharoen, Screening and discrimination of Hepatocellular carcinoma patients by testing exhaled breath with smart devices using composite polymer/carbon nanotube gas sensors, 2016 9th Biomedical Engineering International Conference (BMEiCON), Laung Prabang, 2016, pp. 1–5, DOI:10.1109/BMEiCON.2016.7859609.
- G. Peng, E. Trock and H. Haick, Detecting Simulated Patterns of Lung Cancer Biomarkers by Random Network of Single-Walled Carbon Nanotubes Coated with Nonpolymeric Organic Materials, Nano Lett., 2008, 8(11), 3631–3635 CrossRef CAS PubMed.
- G. Peng, U. Tisch and H. Haick, Detection of Nonpolar Molecules by Means of Carrier Scattering in Random Networks of Carbon Nanotubes: Toward Diagnosis of Diseases via Breath Samples, Nano Lett., 2009, 9(4), 669–673 Search PubMed.
- C. H. Park, V. Schroeder, B. J. Kim and T. M. Swager, Ionic Liquid-Carbon Nanotube Sensor Arrays for Human Breath Related Volatile Organic Compounds, ACS Sens., 2018, 3, 2432–2437 CrossRef CAS PubMed.
- J. E. Ellis and A. Star, Carbon Nanotube Based Gas Sensors toward Breath Analysis, ChemPlusChem, 2016, 81, 1248 CrossRef CAS PubMed.
- Y. Zhang, M. Xu, B. R. Bunes, N. Wu, D. E. Gross, J. S. Moore and L. Zang, Oligomer-coated carbon nanotube chemiresistive sensors for selective detection of nitroaromatic explosives, ACS Appl. Mater. Interfaces, 2015, 7(14), 7471–7475 CrossRef CAS PubMed.
- S. Freddi, G. Drera, S. Pagliara, A. Goldoni and L. Sangaletti, Enhanced selectivity of target gas molecules through a minimal array of gas sensors based on nanoparticle-decorated SWCNTs, Analyst, 2019, 144(13), 4100–4110 RSC.
- A. Aasi, S. M. Aghaei and B. Panchapakesan, A density functional theory study on the interaction of toluene with transition metal decorated carbon nanotubes: a promising platform for early detection of lung cancer from human breath, Nanotechnology, 2020, 31, 415707 CrossRef CAS PubMed (17pp)..
- Y. Zilberman, U. Tisch, G. Shuster, W. Pisula, X. Feng, K. Müllen and H. Haick, Carbon nanotube/hexa-peri-hexabenzocoronene bilayers for discrimination between nonpolar volatile organic compounds of cancer and humid atmospheres, Adv. Mater., 2010, 22, 4317–4320 CrossRef CAS PubMed.
- M. Castro, B. Kumar, J. F. Feller, Z. Haddi, A. Amari and B. Bouchikhi, Novel e-nose for the discrimination of volatile organic biomarkers with an array of carbon nanotubes (CNT) conductive polymer nanocomposites (CPC) sensors, Sens. Actuators, B, 2011, 159, 213–219 CrossRef CAS.
- C. Tasaltin and F. Basarir, Preparation of flexible VOC sensor based on carbon nanotubes and gold nanoparticles, Sens. Actuators, B, 2014, 194, 173–179 CrossRef CAS.
- S. Chatterjee, M. Castro and J. F. Feller, An e-nose made of carbon nanotube based quantum resistive sensors for the detection of eighteen polar/nonpolar VOC biomarkers of lung cancer, J. Mater. Chem. B, 2013, 1, 4563–4575 RSC.
- S. Nag, A. Sachan, M. Castro, V. Choudhary and J. F. Feller, Spray layer-by-layer assembly of POSS functionalized CNT quantumchemo-resistive sensors with tuneable selectivity and ppm resolution to VOC biomarkers, Sens. Actuators, B, 2016, 222, 362–373 CrossRef CAS.
- S. Nag, A. Sachan, M. Castro, V. Choudhary and J. F. Feller, Sulfonated poly(ether ether ketone) [SPEEK] nanocomposites based on hybrid nanocarbons for the detection and discrimination of some lung cancer VOC biomarkers, J. Mater. Chem. B, 2017, 5, 348–359 RSC.
- S. Chatterjee, M. Castro and J. F. Feller, Tailoring selectivity of sprayed carbon nanotube sensors (CNT) towards volatile organic compounds (VOC) with surfactants, Sens. Actuators, B, 2015, 220, 840–849 CrossRef CAS.
- B. Kumar, M. Castro and J. F. Feller, Quantum resistive vapour sensors made of polymer coated carbon nanotubes random networks for biomarkers detection, Chem. Senses, 2013, 3, 20 Search PubMed 7pp..
- K. M. Tripathi, A. Sachana, M. Castro, V. Choudhary, S. K. Sonkarc and J. F. Feller, Green carbon nanostructured quantum resistive sensors to detect volatile Biomarkers, Sustainable Mater. Technol., 2018, 16, 1–11 CrossRef CAS.
- N. J. Kybert, M. B. Lerner, J. S. Yodh, G. Preti and A. T. C. Johnson, Differentiation of Complex Vapor Mixtures Using Versatile DNA-Carbon Nanotube Chemical Sensor Arrays, ACS Nano, 2013, 7, 2800 CrossRef CAS.
- A. Abdelhalim, M. Winkler, F. Loghin, C. Zeiser, P. Lugli and A. Abdellah, Highly sensitive and selective carbon nanotube-based gas sensor arrays functionalized with different metallic nanoparticles, Sens. Actuators, B, 2015, 220, 1288–1296 CrossRef CAS.
- W. Zhang and M. L. Wang, DNA-Functionalized Single-Walled Carbon Nanotube-Based Sensor Array for Breath Analysis, Int. J. Electron. Electr. Eng., 2016, 4(2), 177–180 CrossRef.
- Y. Lu, C. Partridge, M. Meyyappan and J. Li, A carbon nanotube sensor array for sensitive gas discrimination using principal component analysis, J. Electroanal. Chem., 2006, 593, 105–110 CrossRef CAS.
- R. Leghrib, A. Felten, F. Demoisson, F. Reiniers, J. J. Pireaux and E. Llobet, Selective detection of benzene traces at room temperature using metal decorated carbon nanotubes, Procedia Eng., 2010, 5, 385–388 CrossRef CAS.
- M.-Y. Chuang, C. C. Chen, H.-W. Zan, H.-F. Meng and C.-J. Lu, Organic Gas Sensor with an Improved Lifetime for Detecting Breath Ammonia in Hemodialysis Patients, ACS Sens., 2017, 2, 1788–1795 CrossRef CAS PubMed.
- L. R. Narasimhan, W. Goodman, C. Kumar and N. Patel, Correlation of breath ammonia with blood urea nitrogen and creatinine during hemodialysis, Proc. Natl. Acad. Sci. U. S. A., 2001, 98(8), 4617–4621 CrossRef CAS.
- C. Popa, D. C. Dutu, R. Cernat, C. Matei, A. M. Bratu, S. Banita and D. C. Dumitras, Ethylene and ammonia traces measurements from the patients' breath with renal failure via LPAS method, Appl. Phys. B, 2011, 105, 669–674 CrossRef CAS.
- M. M. Tomasiak-Lozowska, Z. Zietkowski, K. Przeslaw, M. Tomasiak, R. Skiepko and A. Bodzenta-Lukaszyk, Inflammatory Markers and Acid-Base Equilibrium in Exhaled Breath Condensate of Stable and Unstable Asthma Patients, Int. Arch. Allergy Immunol., 2012, 159, 121–129 CrossRef CAS PubMed.
- S. A. Kharitonov and P. J. Barnes, Biomarkers of some pulmonary diseases in exhaled breath, Biomarkers, 2002, 7(1), 1–32 Search PubMed.
- A. Van Der Vliet, J. P. Eiserich, M. K. Shigenaga and C. E. Cross, Reactive Nitrogen Species and Tyrosine Nitration in the Respiratory Tract Epiphenomena or a Pathobiologic Mechanism of Disease?, Am. J. Respir. Crit. Care Med., 1999, 160, 1–9 Search PubMed.
- P. Wang, G. Zhang, T. Wondimu, B. Ross and R. Wang, Hydrogen sulfide and asthma, Exp. Physiol., 2011, 96(9), 847–852 Search PubMed.
- Y. Suzuki, J. Saito, M. Uematsu, A. Fukuhara, S. Sato, R. Togawa, Y. Sato, K. Misa, T. Nikaido, N. Fukuhara, X. Wang, Y. Tanino and M. Munakata, Clinical application of hydrogen sulfide (H2S) as a marker of asthma management, Eur. Respir. J., 2016, 48, PA3379 Search PubMed.
- K. Lamote, E. Janssens, E. Schillebeeckx, T. S. Lapperre, B. J. De Winter and J. P. Van MeerbeeckJ, The scent of COVID-19: viral (semi-)volatiles as fast diagnostic biomarkers?, J. Breath Res., 2020, 14, 042001 CrossRef CAS.
- B. Shan, Y. Y. Broza, W. Li, Y. Wang, S. Wu, Z. Liu, J. Wang, S. Gui, L. Wang, Z. Zhang, W. Liu, S. Zhou, S. Jin, Q. Zhang, D. Hu, L. Lin, Q. Zhang, W. Li, J. Wang, H. Liu, Y. Pan and H. Haick, Multiplexed Nanomaterial-Based Sensor Array for Detection of COVID-19 in Exhaled Breath, ACS Nano, 2020, 14, 12125–12132 CrossRef CAS PubMed.
- Y. Tian, A. G. Nasibulin, B. Aitchison, T. Nikitin, J. V. Pfaler, H. Jiang, Z. Zhu, L. Khriachtchev, D. P. Brown and E. I. Kauppinen, Controlled Synthesis of Single-Walled Carbon Nanotubes in an Aerosol Reactor, J. Phys. Chem. C, 2011, 115, 7309–7318 CrossRef CAS.
- A. Kaskela, A. G. Nasibulin, M. Zavodchikova, B. Aitchison, A. Papadimitratos, Y. Tian, Z. Zhu, H. Jiang, D. P. Brown, A. Zachidov and E. I. Kauppinen, Aerosol-Synthesized SWCNT Networks with Tunable Conductivity and Transparency by a Dry Transfer Technique, Nano Lett., 2010, 10, 4349–4355 CrossRef CAS PubMed.
- J. Kong, N. R. Franklin, C. Zhou, M. G. Chapline, S. Peng, K. Cho and H. Dai, Nanotube molecular wires as chemical sensors, Science, 2000, 287, 622–625 CrossRef CAS PubMed.
- C. Cantalini, L. Valentini, L. Lozzi, I. Armentano, J. M. Kenny and S. Santucci, NO2 gas sensitivity of carbon nanotubes obtained by plasma enhanced chemical vapor deposition, Sens. Actuators, B, 2003, 93, 333–337 CrossRef CAS.
- L. Valentini, I. Armentano, J. M. Kenny, C. Cantalini, L. Lozzi and S. Santucci, Sensors for sub-ppm NO2 gas detection based on carbon nanotube thin films, Appl. Phys. Lett., 2003, 82, 961 CrossRef CAS.
- J. Suehiro, G. Zhou, H. Imakiire, W. Ding and M. Hara, Controlled fabrication of carbon nanotube NO2 gas sensor using dielectrophoretic impedance measurement, Sens. Actuators, B, 2005, 108, 398–403 CrossRef CAS.
- W. S. Cho, S. I. Moon, K. K. Paek, Y. H. Lee, J. H. Park and B. K. Ju, Patterned multiwall carbon nanotube films as materials of NO2 gas sensors, Sens. Actuators, B, 2006, 119, 180–185 CrossRef CAS.
- M. Penza, R. Rossi, M. Alvisi and E. Serra, Metal-modified and vertically aligned carbon nanotube sensors array for landfill gas monitoring applications, Nanotechnology, 2010, 21, 105501 CrossRef CAS PubMed (14pp)..
- R. Leghrib, R. Pavelko, A. Felten, A. Vasiliev, C. Cané, I. Gràciac, J.-J. Pireaux and E. Llobet, Gas sensors based on multiwall carbon nanotubes decorated with tin oxide nanoclusters, Sens. Actuators, B, 2010, 145, 411–416 CrossRef CAS.
- R. Leghrib, T. Dufour, F. Demoisson, N. Claessens, F. Reniers and E. Llobet, Gas sensing properties of multiwall carbon nanotubes decorated with rhodium nanoparticles, Sens. Actuators, B, 2011, 160, 974–980 CrossRef CAS.
- J. J. Adjizian, R. Leghrib, A. A. Koos, I. Suarez-Martinez, A. Crossley, P. Wagner, N. Grobert, E. Llobet and C. P. Ewels, Boron- and nitrogen-doped multi-wall carbon nanotubes for gas detection, Carbon, 2014, 66, 662–673 CrossRef CAS.
- P. Clément, A. Ramos, A. Lazaro, L. Molina-Luna, C. Bittencourt, D. Girbau and E. Llobet, Oxygen plasma treated carbon nanotubes for the wireless monitoring of nitrogen dioxide levels, Sens. Actuators, B, 2015, 208, 444–449 CrossRef.
- H. Ko, S. Park, S. Park and C. Lee, Enhanced NO2 Gas Sensing Properties of WO3-Coated Multiwall Carbon Nanotube Sensors, J. Nanosci. Nanotechnol., 2015, 15, 5295–5300 CrossRef CAS PubMed.
- U. Yaqoob, D. T. Phan, A. S. M. I. Uddin and G. S. Chung, Highly flexible room temperature NO2 sensor based on MWCNTs-WO3 nanoparticles hybrid on a PET substrate, Sens. Actuators, B, 2015, 221, 760–768 CrossRef CAS.
- E. Dilonardo, M. Penza, M. Alvisi, C. Di Franco, R. Rossi, F. Palmisano, L. Torsi and N. Cioffi, Electrophoretic deposition of AuNPs on MWCNT-based gas sensor for tailored gas detection with enhanced sensing properties, Sens. Actuators, B, 2016, 223, 417–428 CrossRef CAS.
- C. Hua, Y. Shang, Y. Wang, J. Xu, Y. Zhang, X. Li and A. Cao, A flexible gas sensor based on single-walled carbon nanotube-Fe2O3 composite film, Appl. Surf. Sci., 2017, 405, 405–411 CrossRef CAS.
- S. W. Choi, J. Kim and Y. T. Byun, Highly sensitive and selective NO2 detection by Pt nanoparticles-decorated single-walled carbon nanotubes and the underlying sensing mechanism, Sens. Actuators, B, 2017, 238, 1032–1042 CrossRef CAS.
- F. Rigoni, G. Drera, S. Pagliara, E. Perghem, C. Pintossi, A. Goldoni and L. Sangaletti, Gas sensing at the nanoscale: engineering SWCNT-ITO nano-heterojunctions for the selective detection of NH3 and NO2 target molecules, Nanotechnology, 2017, 28, 035502 CrossRef CAS PubMed.
- T. Sarkara and S. Srinives, Single-walled carbon nanotubes-calixarene hybrid for sub-ppm detection of NO2, Microelectron. Eng., 2018, 197, 28–32 CrossRef.
- P. B. Agarwal, P. Alam, D. S. Sharma, S. Sharma, S. Mandal and A. Agarwal, Flexible NO2 gas sensor based on single-walled carbon nanotubes on polytetrafluoroethylene substrates, Flexible Printed Electron., 2018, 3, 035001 CrossRef.
- E. I. Ionete, S. I. Spiridon, B. F. Monea and E. A. Stratulat, Room Temperature Gas Sensor Based on Sulfonated SWCNTs for the Detection of NO and NO2, Sensors, 2019, 19, 1116 CrossRef CAS PubMed.
- B. Liu, X. Liu, Z. Yuan, Y. Jiang, Y. Su, J. Ma and H. Taia, A flexible NO2 gas sensor based on polypyrrole/nitrogen-doped multiwall carbon nanotube operating at room temperature, Sens. Actuators, B, 2019, 295, 86–92 CrossRef CAS.
- S. Park, Y. Byoun, H. Kang, Y. J. Song and S. W. Choi, ZnO Nanocluster-Functionalized Single-Walled Carbon Nanotubes Synthesized by Microwave Irradiation for Highly Sensitive NO2 Detection at Room Temperature, ACS Omega, 2019, 4, 10677–10686 CrossRef CAS PubMed.
- L. Valentini, C. Cantalini, I. Armentano, J. M. Kenny, L. Lozzi and S. Santucci, Highly sensitive and selective sensors based on carbon nanotubes thin films for molecular detection, Diamond Relat. Mater., 2004, 13, 1301–1305 CrossRef CAS.
- H. Y. Jung, S. M. Jung, J. R. Kim and J. S. Suh, Chemical sensors for sensing gas adsorbed on the inner surface of carbon nanotube channels, Appl. Phys. Lett., 2007, 90, 153114 CrossRef.
- Y. Battie, O. Ducloux, P. Thobois, N. Dorval, J. S. Lauret, B. Attal-Tretout and A. Loiseau, Gas sensors based on thick films of semi-conducting single walled carbon nanotubes, Carbon, 2011, 49, 3544 CrossRef CAS.
- L. K. Randeniya, P. J. Martin, A. Bendavid and J. McDonnell, Ammonia sensing characteristics of carbon-nanotube yarns decorated with nanocrystalline gold, Carbon, 2011, 49, 5265 CrossRef CAS.
- H. Lee, S. Lee, D. H. Kim, D. Perello, Y. J. Park, S. H. Hong, M. Yun and S. Kim, Integrating Metal-Oxide-Decorated CNT Networks with a CMOS Readout in a Gas Sensor, Sensor, 2012, 12, 2582–2597 CrossRef CAS PubMed.
- D.-J. Chen, S. Lei, R.-H. Wang, M. Pan and Y.-Q. Chen, Dielectrophoresis Carbon Nanotube and Conductive Polyaniline Nanofiber NH3 Gas Sensor, J. Anal. Chem., 2012, 40, 145 CAS.
- L. Q. Nguyen, P. Q. Phan, H. N. Duong, C. D. Nguyen and L. H. Nguyen, Enhancement of NH3 Gas Sensitivity at Room Temperature by Carbon Nanotube-Based Sensor Coated with Co Nanoparticles, Sensors, 2013, 13, 1754 CrossRef CAS PubMed.
- K. Y. Dong, J. Choi, Y. D. Lee, B. H. Kang, Y. Y. Yu, H. H. Choi and B. K. Ju, Detection of a CO and NH3 gas mixture using carboxylic acid-functionalized single-walled carbon nanotubes, Nanoscale Res. Lett., 2013, 8, 12 CrossRef PubMed.
- J. W. Han, B. Kim, J. Li and M. Meyyappan, A carbon nanotube-based ammonia sensor on cellulose paper, RSC Adv., 2014, 4, 549 RSC.
- F. Rigoni, S. Tognolini, P. Borghetti, G. Drera, S. Pagliara, A. Goldoni and L. Sangaletti, Enhancing the sensitivity of chemiresistor gas sensors based on pristine carbon nanotubes to detect low-ppb ammonia concentrations in the environment, Analyst, 2013, 138, 7392 RSC.
- Z. Liu, G. Liao, S. Li, Y. Pan, X. Wang, Y. Weng, X. Zhang and Z. Yang, Efficient encapsulation of conducting polyaniline chains inside carbon nanotubes: a new strategy to prepare endohedral CNT materials, J. Mater. Chem. A, 2013, 1, 13321–13327 RSC.
- Y. Ling, H. Zhang, G. Gu, X. Lu, V. Kayastha, C. S. Jones, W. S. Shih and D. C. Janzen, A Printable CNT-Based FM Passive Wireless Sensor Tag on a Flexible Substrate with Enhanced Sensitivity, IEEE Sens. J., 2014, 14, 1193 CAS.
- S. Sharma, S. Hussain, S. Singh and S. S. Islam, MWCNT-conducting polymer composite based ammonia gas sensors: A new approach for complete recovery process, Sens. Actuators, B, 2014, 194, 213 CrossRef CAS.
- J. W. Han, B. Kim, J. Li and M. Meyyappan, A carbon nanotube-based ammonia sensor on cotton textile, Appl. Phys. Lett., 2013, 102, 193104 CrossRef.
- H. Guerin, H. L. Poche, R. Pohle, L. S. Bernard, E. Buitrago, R. Ramos, J. Dijon and A. M. Ionescu, High-yield, in situ fabrication and integration of horizontal carbon nanotube arrays at the wafer scale for robust ammonia sensors, Carbon, 2014, 78, 326 CrossRef CAS.
- F. Rigoni, G. Drera, S. Pagliara, A. Goldoni and L. Sangaletti, High sensitivity, moisture selective, ammonia gas sensors based on single-walled carbon nanotubes functionalized with indium tin oxide nanoparticles, Carbon, 2014, 80, 356 CrossRef CAS.
- P. Majzlíková, J. Sedláèek, J. Prášek, J. Pekárek, V. Svatoš, A. G. Bannov, O. Jašek, P. Synek, M. Eliáš, L. Zajíèková and J. Hubálek, Sensing Properties of Multiwalled Carbon Nanotubes Grown in MW Plasma Torch: Electronic and Electrochemical Behavior, Gas Sensing, Field Emission, IR Absorption, Sensors, 2015, 15, 2644 CrossRef PubMed.
- L. R. Shobin and S. Manivannan, Optically transparent, electrically conducting single walled carbon nanotubes random networks for room temperature ammonia vapor sensing, Mater. Sci. Semicond. Process., 2015, 40, 931–938 CrossRef CAS.
- S. G. Bachhav and D. R. Patil, Study of Polypyrrole-Coated MWCNT Nanocomposites for Ammonia Sensing at Room Temperature, J. Mater. Sci. Chem. Eng., 2015, 3, 30–44 CAS.
- Z. D. Lin, S. J. Young and S. J. Chang, Carbon Nanotube Thin Films Functionalized via Loading of Au Nanoclusters for Flexible Gas Sensors Devices, IEEE Trans. Electron Devices, 2016, 63, 476 CAS.
- S. T. Hasnahena and M. Roy, Sensing of low concentration of ammonia at room temperature by cadmium sulphide nanoparticle decorated multiwalled carbon nanotube: fabrication and characterization, J. Phys. D: Appl. Phys., 2017, 50, 505103 CrossRef.
- M. Eising, C. Cavab, R. V. Salvatierra, A. J. Gorgatti Zarbin and L. S. Roman, Doping effect on self-assembled films of polyaniline and carbon nanotube applied as ammonia gas sensor, Sens. Actuators, B, 2017, 245, 25–33 CrossRef CAS.
- L. Xue, L. Wanga, Y. Guo, G. Liu and P. Wan, Flexible polyaniline/carbon nanotube nanocomposite film-based electronic gas sensors, Sens. Actuators, B, 2017, 244, 47–53 CrossRef CAS.
- L. Kumar, I. Rawal, I. Kaur and S. Annapoorni, Flexible room temperature ammonia sensor based on polyaniline, Sens. Actuators, B, 2017, 240, 408–416 CrossRef CAS.
- S. Min, J. Kim, C. Park, J. H. Jin and N. K. Min, Long-term stability of superhydrophilic oxygen plasma-modified single-walled carbon nanotube network surfaces and the influence on ammonia gas detection, Appl. Surf. Sci., 2017, 410, 105–110 CrossRef CAS.
- A. Senocak, C. Göl, T. V. Basova, E. Demirbas, M. Durmus, H. Al-Sagure, B. Kademe and A. Hassane, Preparation of single walled carbon nanotube-pyrene 3D hybrid nanomaterial and its sensor response to ammonia, Sens. Actuators, B, 2018, 256, 853–860 CrossRef CAS.
- S.-J. Young and Z. D. Lin, Ammonia gas sensors with Au-decorated carbon nanotubes, Microsyst. Technol., 2018, 24, 4207–4210 CrossRef CAS.
- L. A. Panes-Ruiz, M. Shaygan, Y. Fu, Y. Liu, V. Khavrus, S. Oswald, T. Gemming, L. Baraban, V. Bezugly and G. Cuniberti, Toward Highly Sensitive and Energy Efficient Ammonia Gas Detection with Modified Single-Walled Carbon Nanotubes at Room Temperature, ACS Sens., 2018, 3, 79–86 CrossRef CAS PubMed.
- M. Y. Lone, A. Kumar, N. Ansari, S. Husain, M. Zulfequar, R. C. Singh and M. Husain, Enhancement of sensor response of as fabricated SWCNT sensor with gold decorated nanoparticles, Sens. Actuators, A, 2018, 274, 85–93 CrossRef CAS.
- X. Chen, X. Chen, X. Ding, X. Yu and X. Yu, Enhanced ammonia sensitive properties and mechanism research of PANI modified with hydroxylated single-walled nanotubes, Mater. Chem. Phys., 2019, 226, 378–386 CrossRef CAS.
- M. Y. Lone, A. Kumar, S. Husain, R. C. Singh, M. Zulfequar and M. Husain, Fabrication of sensitive SWCNT sensor for trace level detection of reducing and oxidizing gases (NH3 and NO2) at room temperature, Phys. E, 2019, 108, 206–214 CrossRef CAS.
- X. V. Le, T. L. A. Luu, H. L. Nguyen and C. T. Nguyen, Synergistic enhancement of ammonia gas-sensing properties at low temperature by compositing carbon nanotubes with tungsten oxide nanobricks, Vacuum, 2019, 168, 108861 CrossRef CAS.
- P. Kaushik, M. Eliáš, J. Michalička, D. Hegemann, Z. Pytlíček, D. Nečas and L. Zajíčková, Atomic layer deposition of titanium dioxide on multi-walled carbon nanotubes for ammonia gas sensing, Surf. Coat. Technol., 2019, 370, 235–243 CrossRef CAS.
- G. Drera, S. Freddi, T. Freddi, A. De Poli, S. Pagliara, M. De Crescenzi, P. Castrucci and L. Sangaletti, Gas Sensing with Solar Cells: The Case of NH3 Detection through Nanocarbon/Silicon Hybrid Heterojunctions, Nanomaterials, 2020, 10, 2303 CrossRef CAS PubMed.
- S. Singh, S. Sharma, R. C. Singh and S. Sharma, Hydrothermally synthesized MoS2-multi-walled carbon nanotube composite as a novel room-temperature ammonia sensing platform, Appl. Surf. Sci., 2020, 532, 147373 CrossRef CAS.
- F. Rigoni, S. Freddi, S. Pagliara, G. Drera, L. Sangaletti, J. M. Suisse, M. Bouvet, A. M. Malavichko, A. V. Emelianov and I. I. Bobrinetskiy, Humidity-enhanced sub-ppm sensitivity to ammonia of covalently functionalized single wall carbon nanotube bundle layers, Nanotechnology, 2017, 28, 255502 CrossRef CAS PubMed.
- K. Timsorn and C. Wongchoosuk, Inkjet printing of room-temperature gas sensors for identification of formalin contamination in squids, J. Mater. Sci.: Mater. Electron., 2019, 30, 4782–4791 CrossRef CAS.
- C. C. Chang and C. J. Lin, LIBSVM: A Library for Support Vector Machines, ACM Trans. Intell. Syst. Technol., 2011, 2, 27:1–27:27 Search PubMed . Software available at http://www.csie.ntu.edu.tw/%7Ecjlin/libsvm.
- S. Arunragsa, Y. Seekaew, W. Pon-On and C. Wongchoosuk, Hydroxyl edge-functionalized graphene quantum dots for gas-sensing applications, Diam. Relat. Mater., 2020, 105, 107790 CrossRef CAS.
- B. Liu, Y. Huang, K. W. L. Kam, W.-F. Cheung, N. Zhao and B. Zheng, Functionalized graphene-based chemiresistive electronic nose for discrimination of disease-related volatile organic compounds, Biosens. Bioelectron.: X, 2019, 1, 100016 CAS.
- G. Chaloeipote, R. Prathumwan, K. Subannajui, A. Wisitsoraat and C. Wongchoosuk, 3D printed CuO semiconducting gas sensor for ammonia detection at room temperature, Mater. Sci. Semicond. Process., 2021, 123, 105546 CrossRef CAS.
Footnote |
| † Electronic supplementary information (ESI) available. See DOI: 10.1039/d1ra03337a |
| This journal is © The Royal Society of Chemistry 2021 |

