
 Open Access Article
 This Open Access Article is licensed under a Creative Commons Attribution-Non Commercial 3.0 Unported Licence
High-performance electrocatalyst based on polyazine derived mesoporous nitrogen-doped carbon for oxygen reduction reaction†
Songlin Zhao ab,
Fushan Chenc,
Qunfeng Zhang*a and
Lingtao Mengb
ab,
Fushan Chenc,
Qunfeng Zhang*a and
Lingtao Mengb
aCollege of Chemical Engineering, Zhejiang University of Technology, Hangzhou, Zhejiang 310014, China. E-mail: zhangqf@zjut.edu.cn
bSchool of Pharmaceutical and Materials Engineering, Taizhou University, Taizhou 318000, China. E-mail: zhaosonglin@tzc.edu.cn
cJiangxi Province Engineering Research Center of Ecological Chemical Industry, Jiujiang University, Jiujiang 332005, China
First published on 2nd September 2021
Abstract
Nitrogen-doped porous carbon materials have high potential in metal-free electrocatalysts, which is essential for several renewable energy conversion systems. Herein, we report a convenient and environment-friendly method to fabricate a nitrogen doped mesoporous carbon (NMC) using a nonionic surfactant of Pluronic F127 micelles as the template and a Schiff-base polymer (polyazine) as the precursor. The synthesized NMCs were of spheric morphology and mesoporous structures with surface area up to 1174 m2 g−1 and high level of nitrogen (2.9–19 at%) and oxygen (4.9–7.4 at%) simultaneously doped. The electrochemical data of NMCs were analyzed in the context of the BET and XPS information. A correlation between ORR activity and the pyridinic-N was found. The NMC-700 demonstrate the highest electrocatalytic activity for ORR among the studied materials, which can be ascribed to the reasonable surface area and mesoporous structure, as well as the most abundant touchable pyridinic-N, thus providing more effective active sites for the oxygen reduction. In comparsion to the control sample, the NMC-700 provides the ORR electrocatalytic activity approximate to that of commercial Pt/C catalyst with a highly long-term stability.
1. Introduction
Fuel cells have received substantial attention as clean energy devices. In these devices, Pt-based materials have long been utilized as the state-of-the-art oxygen reduction reaction (ORR) electrocatalyst.1–3 However, the large-scale applications of these catalysts continue to be precluded due to the expensive and limited supply of Pt. Great efforts have therefore been devoted to search for efficient, low-cost and durable substitutes to Pt-based ORR catalysts.3–6Recently, nitrogen-doped nanostructured carbon materials have been considered as promising candidates to serve as metal-free electrocatalysts for ORRs, owing to their unique electronic properties and structural features.7–15 In particular, nitrogen-doped mesoporous carbons (NMCs) possess structures not only facilitating the reactant transport but also offering a large density of catalytic sites.8,9,16,17 Various methods have been employed for the development of NMCs with higher surface area, larger pore volume and a well-defined mesoporous structure.18–21 One of methods of production is by hard-templating i.e., nano-casting strategy using a sacrificial template.22,23 Furthermore, some successful results have been achieved in improved surface area and pore volume by employing silica templates. For example, Vinu et al.24 synthesized a three-dimensional cage type mesoporous carbon nanotube-based hybrid material with a surface area of up to 910 m2 g−1 by employing a three-dimensional cage type mesoporous silica, SBA-16, as a template. Zhao et al.25 prepared highly ordered mesoporous carbon nitride nanorods with an extremely high specific surface area (971–1124 m2 g−1) and large pore volume (1.31–1.79 cm3 g−1) by using a mesoporous silica of SBA-15 as a template. However, the procedure of hard-templating is a multi-step routine and involves hazardous reagents such as hydrogen fluoride, ammonium bifluoride, or a strong sodium hydroxide solution for template removal.25,26 To overcome these limitations, researchers have recently developed a soft-templating route for the preparation of NMCs, typically via a one-pot assembly of amphiphilic block copolymers poly(ethylene oxide)-block-poly(propylene oxide)-block-poly(ethylene oxide) (EO106PO70EO106), resol and nitrogen sources followed by a carbonization process.27–29 Unfortunately, most of the reported attempts by the soft-templating route resulted in NMCs with low surface area.28,30 Although chemical activation of the resulting NMCs with KOH can obtain increased surface area and total pore volume, a significantly lower nitrogen content has been observed.29,31
Apart from the strategies of increasing pore density, the nitrogen precursors are another key area of consideration regarding the performance of NMCs in various applications. The structure and property of the precursors greatly affect the assembly process and the final physical and chemical properties of the resulting carbon framework.32–34 A series of nitrogen containing compounds such urea,34 azine,35 cyanamide,36 melamine,37 organic salts32,38 and ionic liquids39,40 have been selected as nitrogen precursors.
Schiff-base is a class of organic compounds containing imine characteristic group (–RC![[double bond, length as m-dash]](https://www.rsc.org/images/entities/char_e001.gif) N–),41 which has been one of the most popular choices for constructing of porous covalent organic polymers.42 Recently, Schiff-base polymers have been employed as a nitrogen-rich precursors for the preparation of new nitrogen-doped porous carbon materials own to their rigid molecular backbone and high nitrogen content.43–49 However, most of such porous organic materials only derived microporous carbon materials with low specific areas.45,50 Extra activation process are often needed for the resulting carbons in order to enhance their performances of in many application fields.43 More recently, our group has reported a facile one-pot preparation of fibrous hierarchically porous nitrogen-doped carbon by employing of polyazine (PAZ) and Pluronic F127 as the precursor and soft template, respectively.51 The PAZ was synthesized in situ by condensing hydrazine hydrate and glyoxal in the domains of hydrophilic blocks in the micelle of Pluronic F127 to create a scaffolded composite. By pyrolyzing under elevated temperatures, the composite is readily transformed to carbon with controlled topography and huge specific area. As an extension of the work, we herein demonstrate the preparation of a spheric NMCs with large surface area, high porosity by controlling the dosages ratio of F127 and glyoxal and the pyrolysis temperature (PT). A variety of techniques were used to characterize the structure of the materials. As the electrocatalyst for oxygen reduction reaction in alkaline media, the NMC-700 catalyst exhibited the highest onset potential and kinetic current among the prepared materials. The effect of PT on the structures, nitrogen species as well as the catalytic performances for ORR was discussed.
N–),41 which has been one of the most popular choices for constructing of porous covalent organic polymers.42 Recently, Schiff-base polymers have been employed as a nitrogen-rich precursors for the preparation of new nitrogen-doped porous carbon materials own to their rigid molecular backbone and high nitrogen content.43–49 However, most of such porous organic materials only derived microporous carbon materials with low specific areas.45,50 Extra activation process are often needed for the resulting carbons in order to enhance their performances of in many application fields.43 More recently, our group has reported a facile one-pot preparation of fibrous hierarchically porous nitrogen-doped carbon by employing of polyazine (PAZ) and Pluronic F127 as the precursor and soft template, respectively.51 The PAZ was synthesized in situ by condensing hydrazine hydrate and glyoxal in the domains of hydrophilic blocks in the micelle of Pluronic F127 to create a scaffolded composite. By pyrolyzing under elevated temperatures, the composite is readily transformed to carbon with controlled topography and huge specific area. As an extension of the work, we herein demonstrate the preparation of a spheric NMCs with large surface area, high porosity by controlling the dosages ratio of F127 and glyoxal and the pyrolysis temperature (PT). A variety of techniques were used to characterize the structure of the materials. As the electrocatalyst for oxygen reduction reaction in alkaline media, the NMC-700 catalyst exhibited the highest onset potential and kinetic current among the prepared materials. The effect of PT on the structures, nitrogen species as well as the catalytic performances for ORR was discussed.
2. Experimental methods
2.1. Preparation of NMCs
In a typical preparation, 0.50 g of Pluronic F127 block copolymer (EO106PO70EO106, MWaverage = 12![[thin space (1/6-em)]](https://www.rsc.org/images/entities/char_2009.gif) 600, Aldrich), 0.45 g of glyoxal (GL, 40% aqueous solution, Aladdin) were dissolved in 10.0 g absolute ethanol (analytical grade, Aladdin) and stirred to form a clear solution. A measured amount of 0.20 g of hydrazine hydrate (HH, 80 wt% aqueous solution, Aladdin) was then added drop-wise to the solution under 0.5 h of vigorous stirring while the condensation reaction occurred and a dark yellow mixture was formed. The mixture was stirred for a further 2 h and then transformed to an uncovered Petri dishes to evaporate the solvent and form a F127 scaffold precursor (marked as F127/PAZ). Finally, the dried precursor was subjected to pyrolysis in an N2 atmosphere in a tubular furnace (CVD-05-23, HEFEI AIXIN JIDIAN TECHNOLOGY CO., LTD, Hefei, China). A two-step temperature control was programmed to first enable the calcination of F127/PAZ at 190 °C for 2 h, followed by carbonization at a final temperature for 2 h in N2 gas. To investigate the effect of PT on the nitrogen content and species, the sample was divided into five aliquots which were heated to 600, 700, 800, 900 and 1000 °C, respectively. Afterwards, the oven was slowly cooled down to room temperature (RT). The resulting materials were denoted as NMC-T, where T stands for the final temperature (°C) at the pyrolysis process.
600, Aldrich), 0.45 g of glyoxal (GL, 40% aqueous solution, Aladdin) were dissolved in 10.0 g absolute ethanol (analytical grade, Aladdin) and stirred to form a clear solution. A measured amount of 0.20 g of hydrazine hydrate (HH, 80 wt% aqueous solution, Aladdin) was then added drop-wise to the solution under 0.5 h of vigorous stirring while the condensation reaction occurred and a dark yellow mixture was formed. The mixture was stirred for a further 2 h and then transformed to an uncovered Petri dishes to evaporate the solvent and form a F127 scaffold precursor (marked as F127/PAZ). Finally, the dried precursor was subjected to pyrolysis in an N2 atmosphere in a tubular furnace (CVD-05-23, HEFEI AIXIN JIDIAN TECHNOLOGY CO., LTD, Hefei, China). A two-step temperature control was programmed to first enable the calcination of F127/PAZ at 190 °C for 2 h, followed by carbonization at a final temperature for 2 h in N2 gas. To investigate the effect of PT on the nitrogen content and species, the sample was divided into five aliquots which were heated to 600, 700, 800, 900 and 1000 °C, respectively. Afterwards, the oven was slowly cooled down to room temperature (RT). The resulting materials were denoted as NMC-T, where T stands for the final temperature (°C) at the pyrolysis process.
For comparison purposes, a sample marked as NC-600 was prepared similarly to NMC-T, but without the use of a template.
2.2. Characterization
Transmission electron microscopic (TEM) measurements were performed using a JEOL-JEM2100 transmission electron microscope (JEOL, Japan) at an acceleration voltage of 100 kV. The TEM samples were prepared by drop-casting a material dispersion directly onto a copper grid coated with a porous carbon film. Scanning electron microscopic (SEM) images were acquired on a field-emission scanning electron microscope (S-4800, Hitachi) equipped with an energy dispersive spectrum (EDS) detector. X-ray photoelectron spectra (XPS) analyses were carried out on a VG Microtech 3000 Multilab spectrometer (Perkin-Elmer) using a monochromatic Mg-Kα radiation X-ray beam (1253.6 eV). The energy step and the energy resolution were set as 50 eV and 0.2 eV, respectively. The source analyzer angle was set at 45°. The acquisition parameters for per reading were set to 200 ms dwell time and 4 sweeps. Accurate binding energies were calibrated by the C1s peak at 284.6 eV. The deconvolution of the high-resolution XPS spectra of C1s, N1s and O1s were carried out by using the XPS PEAK-41 program. The Gaussian–Lorentzian method were used for curve fitting after subtracting a Shirley background and constraining the FWHM and energy of the peaks. Powder X-ray diffraction (XRD) patterns were recorded with a Bruker X-ray diffractometer (D8-advance, Bruker AXS GmbH) with the -Kα radiation (λ = 1.54 Å). The diffractograms were recorded in the 2θ range of 0.5°–5° (for small angle XRD patterns) and 10.0°–80° (for higher angle powder XRD patterns) with a 2θ step size of 0.01° and a step time of 1 s. Thermo-gravimetric analysis (TGA) profiles were obtained using a NETZSCH F209C thermo-gravimetric analyzer (Germany). About 20 mg of solid analytes were pyrolyzed in approximately 30 mL min−1 N2 gas flow at a temperature-ramping rate of 3 °C min−1 from RT to 1000 °C. The specific surface area and the porosity were analysed by using nitrogen adsorption measurements on an Autosorb-IC apparatus (Quantachrome Instruments, American). Approximately 0.20 g of sample was used for each measurement. Prior to the analyses, all samples were separately outgassed to 10−4 torr at 120 °C for 6 h. The pore distribution and total pore volume were calculated from the adsorption branch of the isotherm by the density functional theory (DFT) and the final point of the isotherm, respectively. Raman spectra of the samples were acquired on a Thermo Scientific XRD Raman microscope using a laser with an excitation wavelength of 532 nm at RT.2.3. Electrochemistry test
The ORR catalytic activity and kinetics in an O2-saturated 0.1 M KOH solution were evaluated by using cyclic voltammetry (CV), the steady-state polarization techniques at RT. The measurements were performed on a CHI 660E electrochemical workstation (Chenhua, Shanghai, China) equipped with a three-electrode system. The setup consisted of a Pt wire as the counter electrode, a saturated calomel electrode (SCE) as the reference electrode and a catalyst-modified glassy carbon electrode (GCE) as the working electrode. SCE was calibrated to a reversible hydrogen electrode (RHE) in the same electrolyte in a two-electrode system before each measurement. The catalyst ink was prepared by ultrasonic dispersing of 5 mg catalyst in a mixture of water, ethanol, and Nafion (5%, Sigma-Aldrich) with a volume ratio of 4:1:0.025 to form a homogeneous suspension. An aliquot (20 μL, with a catalyst loading of 47.2 μg cm−2 on the GCE) of the suspension was then evenly cast on the clean GCE surface with a pipette and dried in air. The control sample of Pt/C (20 wt% Pt, Johnson Matthey, obtained from Alfa Aesar) on GC was prepared in the same manner.
The Koutecky–Levich (K–L) equations in eqn (1) and (2) were used to analyze the number of electrons (n) transferred in the ORR of the material:52
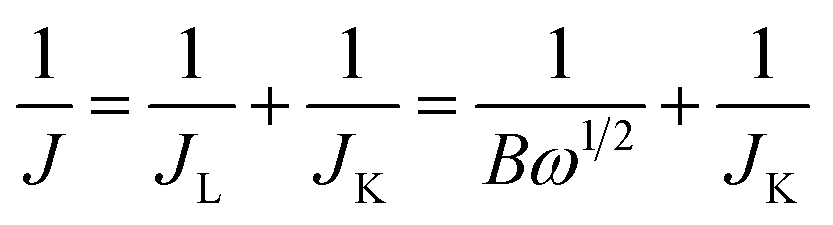 | (1) |
| B = 0.62nFC0(D0)2/3ν−1/6 | (2) |
485 C mol−1), C0 is the bulk concentration of O2 (1.2 × 10⁻⁶ mol cm−3), ν is the kinematic viscosity of the electrolyte (0.01 cm2 s−1) and D0 is the diffusion coefficient of oxygen in 0.1 M KOH (1.9 × 10⁻⁵ cm2 s−1). According to eqn (1) and (2), n and JK can be obtained from the slope and intercept of the K–L plots by linear regression, respectively.
Tafel slope was achieved from the Tafel eqn (3):
|
E = a + blogJK
| (3) |
RRDE (rotating ring-disk electrode, Pine) measurements were also carried out in O2-saturated 0.1 M KOH at a rotation rate of 1600 rpm and a scan rate of 10 mV s−1 to further monitor the formation of the peroxide species (H2O2) during the ORR. The H2O2 yield (% H2O2) during the process was calculated by the following eqn (4):54
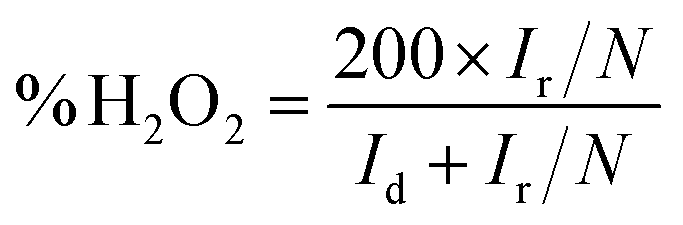 | (4) |
3. Results and discussion
3.1. Materials preparation
The one-pot templating preparation of NMCs is illustrated in Scheme 1. Pluronic F127 was used as a sacrificial pore-forming agent. GL was supplied as a 40% aqueous solution, where it exists primarily as a form of glyoxal oligomerizes (GOs), although it can also react as dialdehyde.51,55 Firstly, the molecule of GO assembled with F127 to form spheric micelles by electrostatic interaction with the hydrophilic parts of the polyethylene oxide blocks in F127. This is similar to the interaction between the phenolic resin monomer and triblock copolymer for the self-assembly behaviours.56 As HH is added, the condensation reaction of HH and GL mainly occur in the domains of F127 micelles to form F127 scaffold PAZ monomicelles, which simultaneously cross-linked and accumulated to form a spherical F127/PAZ composite. The NMC powders can be readily obtained after evaporating the solvent at RT and removing the F127 template by calcination.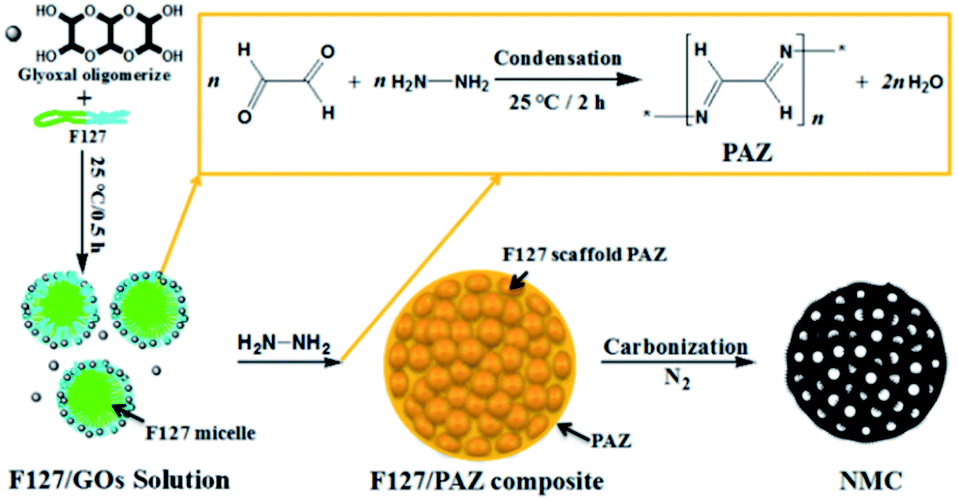 | ||
| Scheme 1 Illustration for the NMC-Ts preparation. | ||
3.2. Morphology, structural and compositional characterization
Fig. 1 shows the typical SEM (a) and TEM (b, c) images for NMC-700. It can be seen that the NMC-700 (Fig. 1a) possesses overall spherical or quasi-spherical morphologies with mild aggregation. The particle size is in the range of 350–550 nm in diameter. TEM characterization of NMC-700 (Fig. 1b) further validates the morphology and mesoporosity of the mild aggregated spheres. A high-resolution TEM image (Fig. 1c) indicates the formation of orientated graphite layers around the pores of the material, demonstrating the feasibility of the present method.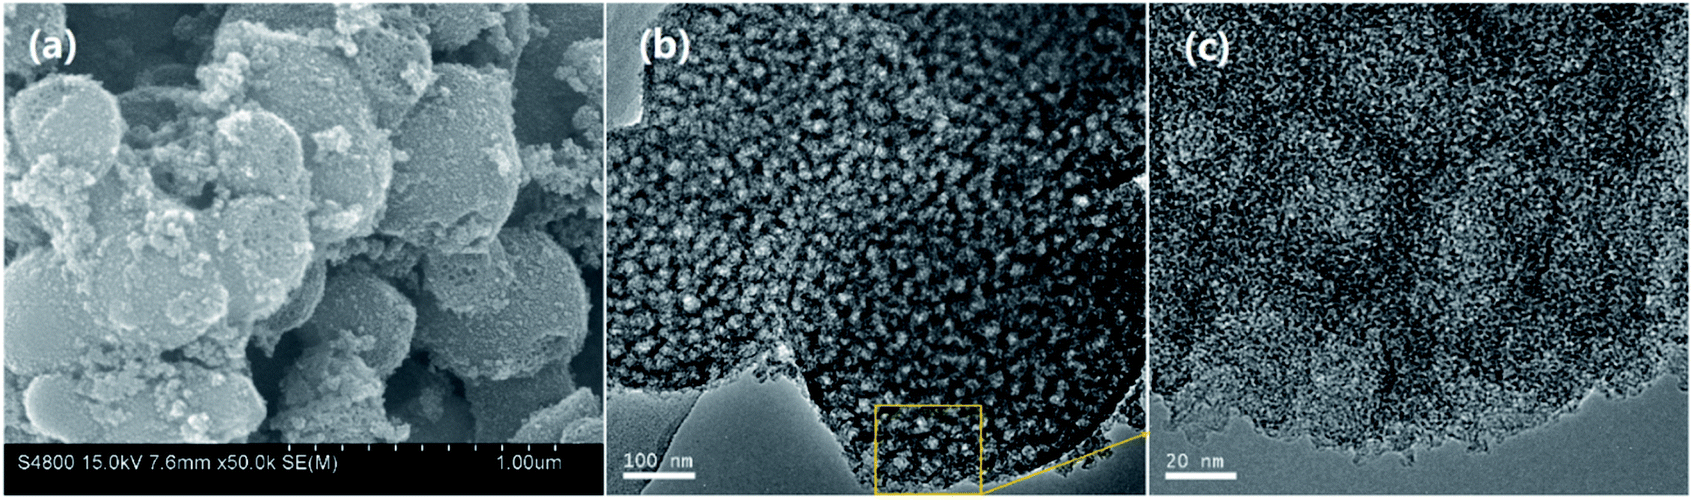 | ||
| Fig. 1 SEM (a) and TEM (b and c) images for NMC-700. | ||
The powder XRD pattern and the first-order Raman spectra of the samples are shown in Fig. 2a and b, respectively. As can be seen in Fig. 2a, two diffraction peaks can be discriminated for all samples at the 2θ values of around 25° and 43°, which can be assigned to the (002) and (101) planes of the hexagonal carbon material (JCPDS, Card No. 75-1621), respectively.57 With a higher PT, the intensities of the two peaks increased correspondingly, suggesting a greater degree of graphite crystallinity within the NMCs. The small angle X-ray scattering pattern of NMC-700 (Fig. 2a, inset) shows only one resolved scattering peak at around 0.88° associated with the mesostructured lattice d100 with a spacing of 10.1 nm.25,38 The Raman spectra (Fig. 2b) exhibit D- and G-bands at around 1350 and 1590 cm−1, respectively, present in all of the prepared materials. The D-band arises from the disordered sp2 hybridized carbon, which is associated with the defects, curved sheets and dangling bonds within the carbon structures; whereas the G-band is associated with the tangential stretching mode of highly ordered pyrolytic graphite.23 The peak intensity ratio of the D- to G-bands (ID/IG) is therefore used as an index for the estimation of the degree of crystallization of carbonaceous materials.23,52 As the PT is increased from 600 to 1000 °C, the D-band peak shifts from 1355 to 1347 cm−1 and G-band peak from 1583 to 1597 cm−1, suggesting a decrease in the nitrogen content in the graphitic carbon matrix.25,57 In addition, the decreases in the full width half maximum of the G-band (sharper line shape) and the ID/IG ratio (as shown in the inset of Fig. 2b) with increasing PT indicates that the carbons at higher temperatures have a higher degree of graphitization.
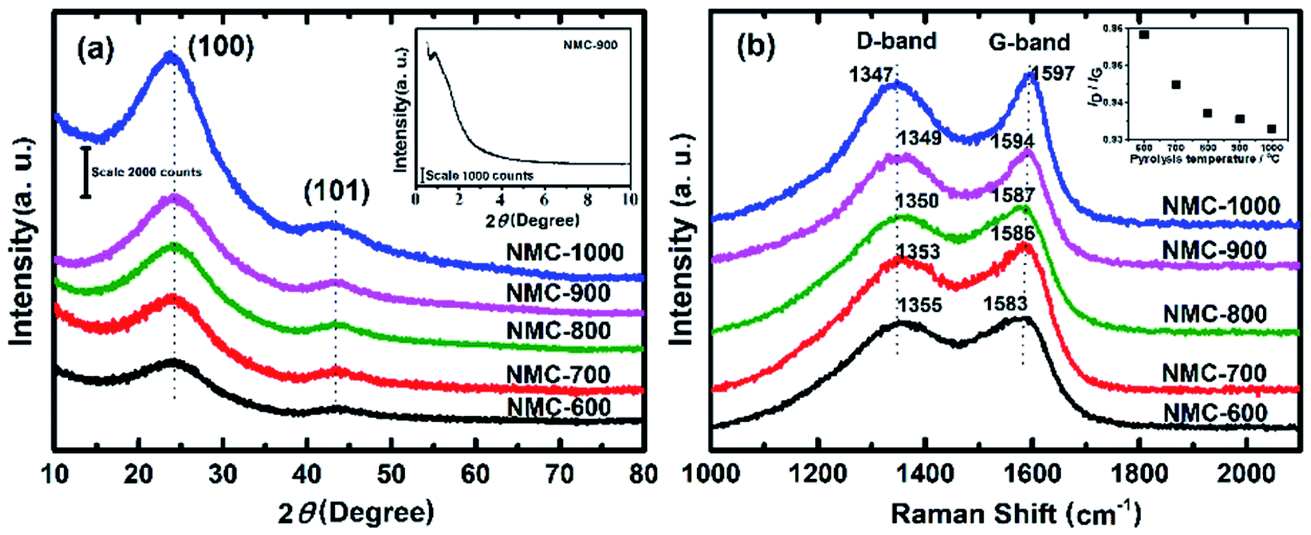 | ||
| Fig. 2 (a) Powder XRD pattern (inset: small angle X-ray scattering (SAXS) pattern of NMC-700) and (b) first-order Raman spectra of NMC-Ts. | ||
The Brunauer–Emmett–Teller (BET) specific surface area (SSA) and porosity of NMC-Ts samples were characterized by N2 adsorption and desorption. The results are displayed in Fig. 3a and b. As demonstrated in Fig. 3a, the volume of N2 adsorbed in NC-600 remained largely unchanged at relative pressures above 0.1, whereas those of NMC-Ts demonstrated intermediate types between type I and type IV adsorption models, which is characteristic of mesopores with a broad distribution.58,59 There is a pronounced desorption step in the desorption branch of each calcined sample, which indicates cage or bottle-like structure within the interconnected pore system.60 Fig. 3b depicts the DFT pore size distribution curves. It can be seen that NMC-Ts possessed a narrow pore size distribution, centered at about 2.5 nm accompanied with multiple-peaked pores in the range (4–18 nm). With the increase in PT, the peaks of pore size distribution grows wider toward a higher mesoporous range (2.5–4 nm), which may result from the decomposition of the labile carbonaceous residues, leading to the formation of new micropores and some larger mesopores in these samples.61 In the PT range of 600–900 °C, a moderate rise in the pore sizes at the range of 5–20 nm can be observed. Whereas, the pore distribution fall into a decline when the PT is 1000 °C. This result may be ascribed as the destruction of the cavities by completely decomposition of the wall of the pores.
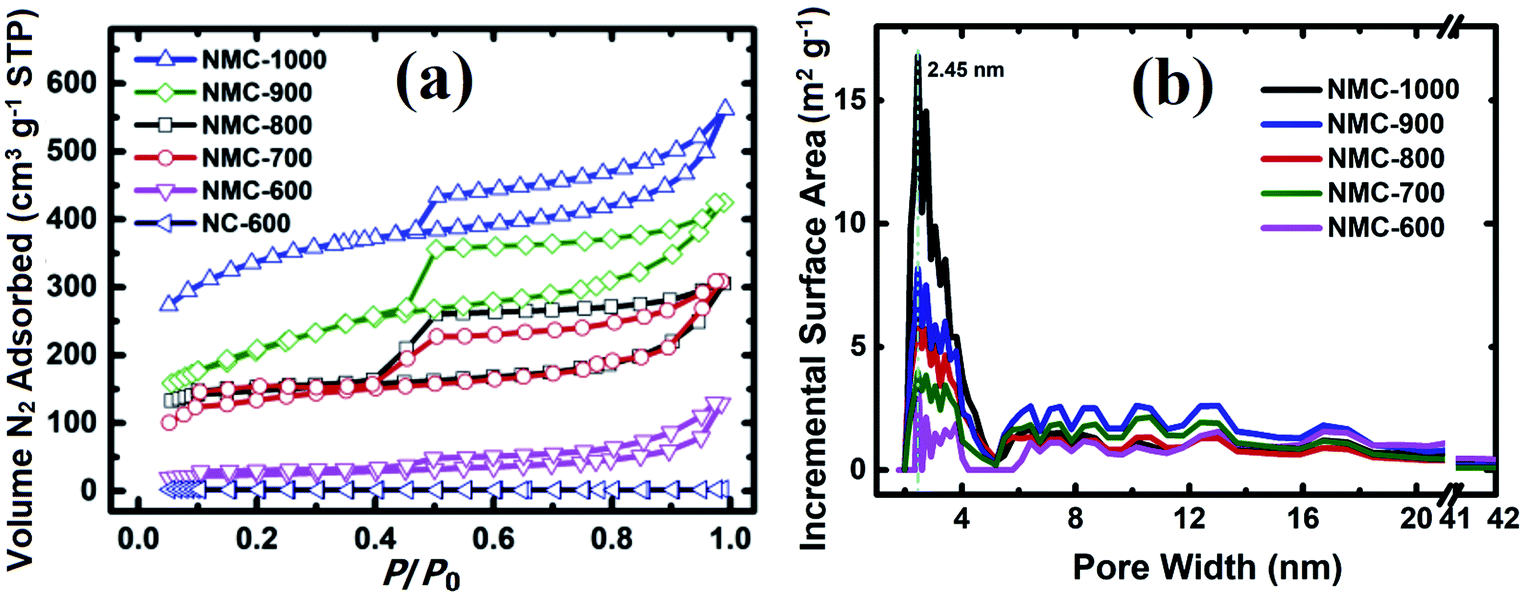 | ||
| Fig. 3 (a) Nitrogen adsorption/desorption isotherms of the NMC-Ts (T = 600, 700, 800, 900 and 1000) and NC-600, (b) the DFT pore size distribution curves derived from the N2 adsorption branch of NMC-Ts. | ||
The BET SSA and the total pore volume were calculated using the adsorption data at a relative pressure range of P/P0 = 0.05–0.35 and 0.99, respectively. As shown in Fig. S1,† the N2 uptake and the estimated BET SSA and pore volume of the samples are increased from 247 to 1174 m2 g−1 and 0.24 to 0.87 cm3 g−1 with the PT increases from 600 °C to 1000 °C, respectively. In particular, there is a significant difference between the sample heated at 600 °C (NMC-600, with an SSA of 247 m2 g−1) and that heated at 700 °C (NMC-700, with an SSA of 673 m2 g−1). This difference is likely due to the significant weight loss at around 672 °C. At this temperature, as can be seen in Fig. S2† (inset), there is a valley in the derivative line from the thermo-gravimetric curve in the range of 450–995 °C.22–26,62
3.3. Surface chemical compositions
The content of oxygen and nitrogen as well as the coordination of nitrogen on the surface of samples were examined by XPS. Fig. 4a presents the wide XPS spectra of the resulting materials. The spectra exhibit three strong signals at around 285 eV, 400 eV, and 532 eV for all tested samples, which can be assigned to C1s, N1s and O1s core levels, respectively.23,63 The atomic content of nitrogen and atoms (shown in Fig. 4a, inset) were calculated by taking the areas of the N1s and O1s peaks. The nitrogen content is seen to decrease sharply from 19.61 at% at 600 °C to 2.88 at% at 1000 °C, suggesting that the carbonization process reduces the content of nitrogen species more quickly relative to carbon because of the de-nitrogenation and aromatization.63 However, the oxygen content presents a moderately increase from 4.89 at% to 7.41 at%.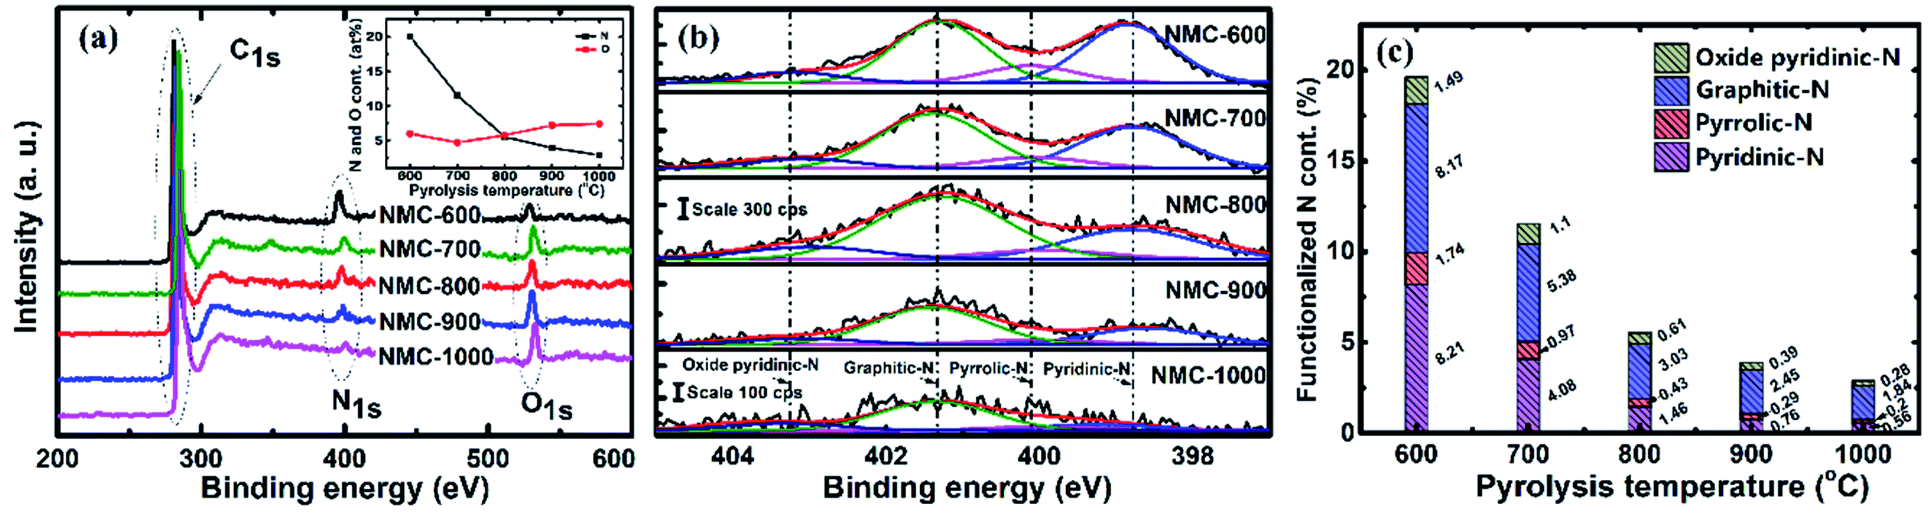 | ||
| Fig. 4 (a) XPS survey spectrum, (b) high-resolution XPS spectra of N1s (the fitted peaks correspond to pyridinic-N, pyrrolic-N, graphitic-N and oxidized pyridinic nitrogen (the scale bar is normalized for all of the samples)) and (c) the calculated percentages of N functionalities in NMC-Ts. | ||
The computer deconvolutions (by Gaussian–Lorentzian method) of the N1s spectra were carried out to estimate the evolution of the functional components of nitrogen at the surface of the materials subjected to pyrolysis. As demonstrated in Fig. 4b, the asymmetric N1s peak in all the samples tested could be fitted into four peaks at 398.6, 400.3, 401.3, and 403.2 eV, corresponding to the nitrogen functionalities of pyridinic-N, pyrrolic-N, graphitic-N and oxidized pyridinic-N, respectively.59,63–65 The areas of these four peaks were integrated to estimate the evolutions in the content of the corresponding nitrogen species, which are presented as atomic percentages of the functionalized nitrogen in relation to total amount of carbon, oxygen and nitrogen atoms and separately plotted in Fig. 4c. As the PT was 600 °C, the proportions of pyridinic-N, pyrrolic-N, graphitic-N and oxidized pyridinic-N were quantified as 8.21%, 1.74%, 8.17% and 1.49%, respectively, which indicates pyridinic-N and graphitic-N are the majority forms of the nitrogen remains in NMC-600. When the PT is increased from 600 to 1000 °C, the corresponding for atomic percentages of these nitrogen species drop to 0.56%, 0.2%, 1.84% and 0.28%, respectively. Obviously, the pyridinic-N content declined more swiftly than that of graphitic-N, suggesting that pyridinic-N has lower thermal stability than graphic-N.66,67 The proportions of pyrrolic-N and oxidized pyridinic-N were at a constantly low level, possibly owing to their lower stability compared to pyridinic-N and graphitic-N.64–67 It should be noted that the content of nitrogen and oxygen and the species composition of nitrogen must be considered as approximates, since the fitting procedure is moderately sensitive to the typical error in the analytical results. To achieve more reliable results, the operations and queries were executed three times to obtain an average of the measurements.
3.4. Electrocatalytic properties
The CV curves were recorded at the scan rate of 10 mV s−1 in N2 or O2-saturated 0.1 M KOH and in the potential range between 1.2 and 0 V (vs. RHE). As shown in Fig. S4,† the CV curve for NMC-700 exhibits a clean capacitive CV background in the N2-saturated electrolyte, whereas a well-resolved cathodic current peak at 0.79 V vs. RHE appears in the voltammogram using the O2-saturated electrolyte, indicating the pronounced electrocatalytic activity of NMC-700 for the ORR.8,16,68RDE (rotating disk electrode, Pine, AFMSRCE 3005) tests were conducted at the scan rate of 10 mV s−1 in the potential interval from 1.1 to 0.2 V (vs. RHE). Capacitive background current was recorded in the N2-saturated 0.1 M KOH before each RDE measurement for allaying the effect of capacitance current. The ORR polarization currents were corrected by subtracting the capacitive background currents.69,70 The ORR polarization curves with NMC-Ts or Pt/C catalysts are shown in Fig. 5a. In a mixed kinetic/diffusion region, the onset potential (defined as the potential at which a current density of −0.10 mA cm−2 is recorded71–73) and the half-wave potential (E1/2) of an ORR polarization curve are often used to evaluate the electrocatalytic activity of a catalyst and the kinetic current of ORR at 0.85–0.9 V RHE is very meaningful for fuel cell applications.74 It can be seen that as the PT is increased from 600 °C to 1000 °C, the onset potential increased from 0.907 V (NMC-600) to 0.969 V (NMC-700) and subsequently decreased to 0.919 V (NMC-900 and NMC-1000). The E1/2 of increased in the order: NMC-600 (0.652 V) < NMC-1000 (0.732 V) < NMC-900 (0.735 V) < NMC-700 (0.762 V) < NMC-800 (0.751 V) < Pt/C (0.852 V). What is worth noting that the onset potential for NMC-700 almost matched the control sample of Pt/C (shows an onset potential at 0.975 V), which is of quite competitive among the reported analogical materials (Table S1†). N content and N species proportions in the carbon materials are believed to play a key role for the improved activity.8,75 NMC-600 possess the highest containing of nitrogen, however provide the lowest onset potential and E1/2 in NMC-Ts. It indicates that nitrogen containing is not the only factor that affects the catalytic activity of NMC-Ts.
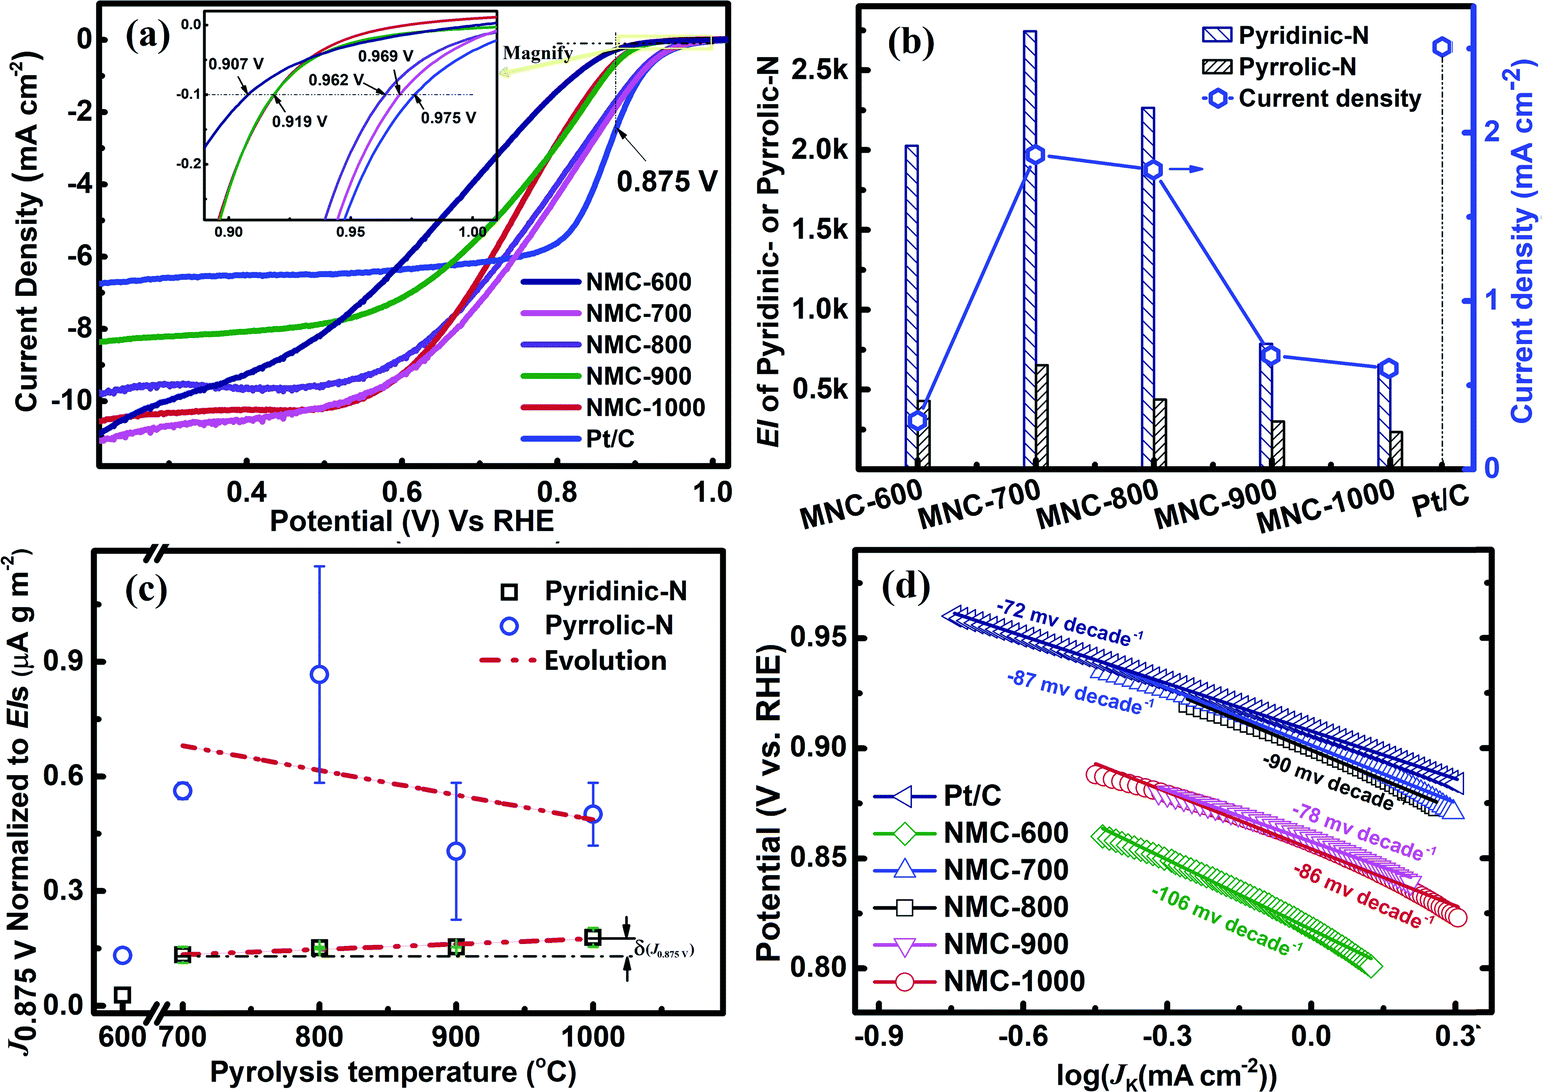 | ||
| Fig. 5 (a) ORR polarization curves of NMC-Ts and Pt/C in O2-saturated 0.1 M KOH at 10 mV s−1 and a rotation rate of 1600 rpm (inset indicating onset potentials), (b) the correlation of the PT, EIs of pyridinic-N and pyrrolic-N with J0.875 V for NMC-Ts, (c) the correlation of PT with the normal J0.875 V of pyridinic-N and pyrrolic-N for NMC-Ts (d) Tafel slopes for the ORR over NMC-Ts. | ||
According to the XPS analysis, there are four types of N atoms present in all samples of the NMC-Ts. However, only the pyridinic-N and/or pyrrolic-N have planar structures, which locate on the edge plane of carbon and can expose to the reactants, serve a catalytic function toward ORR.7,65,71,76–80 Thus, the exposure indexes (EI, defined as the product of the BET SSA and the containing (at%) of the evaluated nitrogen species in the material) of pyridinic-N and pyrrolic-N in each material as a function of PT were calculated and correlated with the kinetic current densities at 0.875 V vs. RHE (J0.875 V). The data associated with the expression are listed in Table S2.† The processing result is shown in Fig. 5b. It is found that the EIs of pyridinic-N and pyrrolic-N in NMC-600 are 430 and 2027, which increase to 652 and 2742 in NMC-700, respectively, and then decrease with the TP continues to rise. As is expected, the J0.875 for NMC-Ts fellow the similar variation tendency as that of EIs. NMC-700 provided a maximal J0.875 V of 1.87 mA cm−2 among the carbons, which is lower than that on Pt/C (2.51 mA cm−2), however, superior to the reported advanced metal-free catalysts.16,68,81
Since the first use of nitrogen-doped carbon nanotubes in catalytic ORR has been reported in 2009,4 considerable efforts have been put into developing various nitrogen-doped carbon-based metal free catalysts and attempting to figure out their chemical structure toward ORR activity.59,82 Although significant progress has been made, the intrinsic structures of the catalytic active sites in this type materials and ORR mechanism remain unclear.82 In order to avoid potentially interfering of EI and get a better understanding of the real structures acting as the promotor in ORR, the normalized J0.875 V (nominal J0.875 V) to the EI of pyridinic-N or pyrrolic-N in each material were calculated as a function of the PT. If any nitrogen species relates to the real active site, its normalized kinetic currents in all materials should be independent of the PT (or EI). The relevant data and calculations are presented in the ESI (Section S3†) and the results are shown in Fig. 5c. It can be seen that the nominal J0.875 V to pyrrolic-N presents a chaos evolution with increasing in PT. However, the nominal J0.875 V to pyridinic-N shows fundamentally independent of the EI of pyridinic-N in the materials apart from NMC-600. These results suggest that only pyridinic-N maybe the truthful representation of active sites.59,82 From Fig. 5c, it can also be observed that nominal J0.875 V to pyridinic-N for the samples are regularly increased (δ(J0.875)) with increasing in PT. This trend may be attributed to the cumulative graphitization accompanied by the thermal decompositions at a higher PT, which has been characterised by Raman.
ORR electrocatalytic behaviour of the NMC-Ts and commercial Pt/C catalysts were further analysed using Tafel plots (Fig. 5d). As shown in Fig. 5d, NMC-600 presented the highest slope (absolute value, 106 mV per decade) indicating the logiest kinetic characteristic toward ORR. The Tafel slopes of NMC-700 and NMC-800 are 87 and 90 mV per decade, which are slightly higher than that of commercial Pt/C (72 mV per decade), in the low overpotential Tafel slope regions (>0.85 V vs. RHE). Lower absolute values Tafel slopes of NMC-900 (78 mV per decade) and NMC-1000 (86 mV per decade) than that of NMC-700 and NMC-800 are observed, however, which occurred in a high overpotential regions (<0.85 V vs. RHE). This result again confirms that the NMC-700 as well as NMC-800 have high ORR kinetic process.
The possible reduction of oxygen to water over a catalyst surface can occur through a two-electron process or a four-electron process, although the four-electron pathway is obviously more efficient and favourable.2,3 We used RDE measurements to investigate the ORR kinetics of NMC-700 (Fig. 6a). In the overpotential range of 0.5–0.7 V vs. RHE, the value of n is above 3.86, however, which is found to be around 2 when the overpotential is above 0.8 V, suggesting the 2-4-electron process for ORR over NMC-700. Thus, the typical ORR process on NMC-700 displays pronounced selectivity (which is defined as 100% × n/4 (ref. 69)) above 90% for an advanced pseudo four-electron dominated ORR process as the overpotential lower than 0.7 V vs. RHE. Fig. S3† displays the RRDE measurement combined with H2O2 yield over NMC-700. Notably, the measured Ir was below 0.5 μA and the calculated % H2O2 was below 5% as the potential lower than 0.8 V vs. RHE. However, when the potential over 0.80 V vs. RHE, the % H2O2 increases significantly, which is approximately consistent with the result obtained from the LSV plots with K–L method mentioned above.
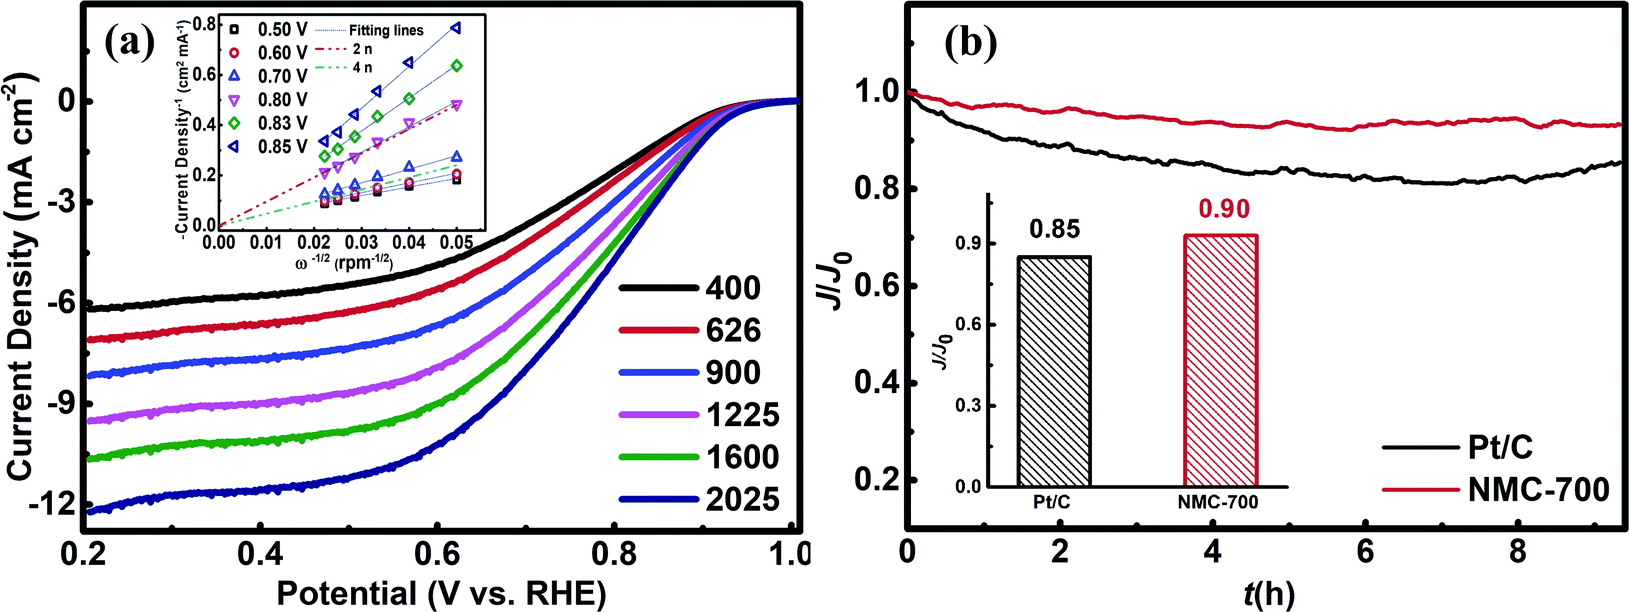 | ||
| Fig. 6 (a) RDE voltammograms of NMC-700 in O2-saturated 0.1 M KOH at a scan rate of 10 mV s−1 and different RDE rotation rates (inset: K–L plots and the derived overall number of electrons transferred in ORR at different electrode potentials vs. RHE) and (b) relative current density in the chronoamperometric test for NMC-700 and Pt/C at 0.875 V (inset the relative ORR current density on the NMC-700 maintained over 8 h). | ||
The long-term catalytic stability of the NMC-700 and Pt/C catalysts tests were performed at a reduced potential of 0.875 V vs. RHE in a 0.1 M KOH electrolyte by chronoamperometric technique. Fig. 6b demonstrated the changes of relative ORR current densities over time on NMC-700 and Pt/C modified GCE, respectively. As can be seen, the ORR current density on the NMC-700 maintained a level of 90% for over 8 h chronoamperometric I–t tests, exceeding that of Pt/C (85%). These results indicate that the NMC-700 catalyst possesses very good structural and chemical stability.8,16,17,68,81
4. Conclusions
In conclusion, this study has successfully prepared a spherical morphology carbon material with high surface area, mesoporous structure and high N contenting from polyazine, via, soft templating combined with pyrolysis technique. The large conjugate structure and riched N atoms in the precursor of PAZ is responsible for high contain of pyridinic, pyrrolic and graphitic N, which is considered vital for high catalytic activity. Electrochemical characterizations show that the catalytic activity for ORR can be more reasonably ascribed to pyridinic-N rather than pyrrolic-N. The NMC-700 possess the most abundant touchable pyridinic-N and demonstrate the highest catalytic activity for ORR close to the commercial Pt/C among the studied materials, but at the same time, NMC-700 exhibit a better ORR electrocatalytic stability. Hence, the NMC-700 can be the potential candidate metal-free catalyst for oxygen reduction reaction.Ethical statement
The authors state that all experiments were performed in compliance with the relevant laws and institutional guidelines.Author contributions
Songlin Zhao: conceptualization, experiment, draft of the manuscript. Fushan Chen: assisted testing and characterization. Qunfeng Zhang: funding acquisition and supervision. Lingtao Meng: assisted testing.Conflicts of interest
There are no conflicts to declare.Acknowledgements
This study was funded by the National Natural Science Foundation of China (No. 21776258, 21501128 and 91534113), Zhejiang Provincial Natural Science Foundation of China (Y19E030012, LY21B010001 and LY18B010002), the Taizhou Science and Technology Plan Project (No. 1803gy02) and the Chemical Engineering & Technology of Zhejiang Province First-Class Discipline, Taizhou University.Notes and references
- B. C. Steele and A. Heinzel, Nature, 2001, 414, 345–352 CrossRef CAS PubMed.
- M. Zhou, H. L. Wang and S. Guo, Chem. Soc. Rev., 2016, 45, 1273–1307 RSC.
- C. Zhu, H. Li, S. Fu, D. Du and Y. Lin, Chem. Soc. Rev., 2016, 45, 517–531 RSC.
- K. Gong, F. Du, Z. Xia, M. Durstock and L. Dai, Science, 2009, 323, 760–764 CrossRef CAS PubMed.
- L. Dai, Curr. Opin. Electrochem., 2017, 4, 18–25 CrossRef CAS.
- C. Xu, Z. Lin, D. Zhao, Y. Sun, Y. Zhong, J. Ning, C. Zheng, Z. Zhang and Y. Hu, J. Mater. Sci., 2019, 54, 5412–5423 CrossRef CAS.
- W. Ding, Z. Wei, S. Chen, X. Qi, T. Yang, J. Hu, D. Wang, L.-J. Wan, S. F. Alvi and L. Li, Angew. Chem., 2013, 125, 11971–11975 CrossRef.
- W. Wei, H. Liang, K. Parvez, X. Zhuang, X. Feng and K. Mullen, Angew. Chem., 2014, 53, 1570–1574 CrossRef CAS PubMed.
- R. Liu, D. Wu, X. Feng and K. Mullen, Angew. Chem., 2010, 49, 2565–2569 CrossRef CAS PubMed.
- M. A. Kanygin, O. V. Sedelnikova, I. P. Asanov, L. G. Bulusheva, A. V. Okotrub, P. P. Kuzhir, A. O. Plyushch, S. A. Maksimenko, K. N. Lapko, A. A. Sokol, O. A. Ivashkevich and P. Lambin, J. Appl. Phys., 2013, 113, 144315 CrossRef.
- L. Dai, Y. Xue, L. Qu, H. J. Choi and J. B. Baek, Chem. Rev., 2015, 115, 4823–4892 CrossRef CAS PubMed.
- Z. Wang, R. Jia, J. Zheng, J. Zhao, L. Li, J. Song and Z. Zhu, ACS Nano, 2011, 5, 1677–1684 CrossRef CAS PubMed.
- X. Bao, X. Nie, D. von Deak, E. J. Biddinger, W. Luo, A. Asthagiri, U. S. Ozkan and C. M. Hadad, Top. Catal., 2013, 56, 1623–1633 CrossRef CAS.
- J. Zeng, Y. Mu, X. Ji, Z. Lin, Y. Lin, Y. Ma, Z. Zhang, S. Wang, Z. Ren and J. Yu, J. Mater. Sci., 2019, 54, 14495–14503 CrossRef CAS.
- A. Ilnicka, P. Kamedulski, M. Skorupska and J. P. Lukaszewicz, J. Mater. Sci., 2019, 54, 14859–14871 CrossRef CAS.
- W. Yang, T. P. Fellinger and M. Antonietti, J. Am. Chem. Soc., 2011, 133, 206–209 CrossRef CAS PubMed.
- J. C. Li, S. Y. Zhao, P. X. Hou, R. P. Fang, C. Liu, J. Liang, J. Luan, X. Y. Shan and H. M. Cheng, Nanoscale, 2015, 7, 19201–19206 RSC.
- H. W. Liang, X. Zhuang, S. Bruller, X. Feng and K. Mullen, Nat. Commun., 2014, 5, 4973 CrossRef CAS PubMed.
- Z. Ma, H. Zhang, Z. Yang, G. Ji, B. Yu, X. Liu and Z. Liu, Green Chem., 2016, 18, 1976–1982 RSC.
- K. N. Wood, R. O'Hayre and S. Pylypenko, Energy Environ. Sci., 2014, 7, 1212–1249 RSC.
- W. Shen and W. Fan, J. Mater. Chem. A, 2013, 1, 999–1013 RSC.
- A. Vinu, Adv. Funct. Mater., 2008, 18, 816–827 CrossRef CAS.
- C. V. Rao, C. R. Cabrera and Y. Ishikawa, J. Phys. Chem. Lett., 2010, 1, 2622–2627 CrossRef CAS.
- A. Vinu, P. Srinivasu, D. P. Sawant, T. Mori, K. Ariga, J.-S. Chang, S.-H. Jhung, V. V. Balasubramanian and Y. K. Hwang, Chem. Mater., 2007, 19, 4367–4372 CrossRef CAS.
- Z. Zhao, Y. Dai, J. Lin and G. Wang, Chem. Mater., 2014, 26, 3151–3161 CrossRef CAS.
- X. Jin, V. V. Balasubramanian, S. T. Selvan, D. P. Sawant, M. A. Chari, G. Q. Lu and A. Vinu, Angew. Chem., 2009, 48, 7884–7887 CrossRef CAS PubMed.
- K. Kailasam, Y.-S. Jun, P. Katekomol, J. D. Epping, W. H. Hong and A. Thomas, Chem. Mater., 2010, 22, 428–434 CrossRef CAS.
- Y. Wang, X. Wang, M. Antonietti and Y. Zhang, ChemSusChem, 2010, 3, 435–439 CrossRef CAS PubMed.
- J. Yu, M. Guo, F. Muhammad, A. Wang, G. Yu, H. Ma and G. Zhu, Microporous Mesoporous Mater., 2014, 190, 117–127 CrossRef CAS.
- M. Peer, M. Lusardi and K. F. Jensen, Chem. Mater., 2017, 29, 1496–1506 CrossRef CAS.
- Y. Wang, X. Wang and M. Antonietti, Angew. Chem., 2012, 51, 68–89 CrossRef CAS PubMed.
- S. Zhang, M. S. Miran, A. Ikoma, K. Dokko and M. Watanabe, J. Am. Chem. Soc., 2014, 136, 1690–1693 CrossRef CAS PubMed.
- R. Liu, S. M. Mahurin, C. Li, R. R. Unocic, J. C. Idrobo, H. Gao, S. J. Pennycook and S. Dai, Angew. Chem., 2011, 123, 6931–6934 CrossRef.
- Y. Meng, D. Gu, F. Zhang, Y. Shi, L. Cheng, D. Feng, Z. Wu, Z. Chen, Y. Wan, A. Stein and D. Zhao, Chem. Mater., 2006, 18, 4447–4464 CrossRef CAS.
- P. Puthiaraj, Y.-R. Lee, S. Zhang and W.-S. Ahn, J. Mater. Chem. A, 2016, 4, 16288–16311 RSC.
- X. Xu, Y. Li, Y. Gong, P. Zhang, H. Li and Y. Wang, J. Am. Chem. Soc., 2012, 134, 16987–16990 CrossRef CAS PubMed.
- M. Li and J. Xue, J. Phys. Chem. C, 2014, 118, 2507–2517 CrossRef CAS.
- S. Zhang, K. Dokko and M. Watanabe, Chem. Mater., 2014, 26, 2915–2926 CrossRef CAS.
- J. S. Lee, X. Wang, H. Luo and S. Dai, Adv. Mater., 2010, 22, 1004–1007 CrossRef CAS PubMed.
- J. P. Paraknowitsch, A. Thomas and M. Antonietti, J. Mater. Chem., 2010, 20, 13 RSC.
- H. Puchtler and S. N. Meloan, Histochemistry, 1981, 72, 321–332 CAS.
- Y. Jin, Y. Zhu and W. Zhang, CrystEngComm, 2013, 15, 1484–1499 RSC.
- J. S. Wei, H. Ding, Y. G. Wang and H. M. Xiong, ACS Appl. Mater. Interfaces, 2015, 7, 5811–5819 CrossRef CAS PubMed.
- X. Yang, X. Zhuang, Y. Huang, J. Jiang, H. Tian, D. Wu, F. Zhang, Y. Mai and X. Feng, Polym. Chem., 2015, 6, 1088–1095 RSC.
- X. Zhuang, F. Zhang, D. Wu and X. Feng, Adv. Mater., 2014, 26, 3081–3086 CrossRef CAS PubMed.
- X. Liu, L. Zhou, Y. Zhao, L. Bian, X. Feng and Q. Pu, ACS Appl. Mater. Interfaces, 2013, 5, 10280–10287 CrossRef CAS PubMed.
- M. G. Schwab, B. Fassbender, H. W. Spiess, A. Thomas, X. Feng and K. Mullen, J. Am. Chem. Soc., 2009, 131, 7216–7217 CrossRef CAS PubMed.
- K. Sakaushi and M. Antonietti, Acc. Chem. Res., 2015, 48, 1591–1600 CrossRef CAS PubMed.
- B. Zhou, L. Liu, P. Cai, G. Zeng, X. Li, Z. Wen and L. Chen, J. Mater. Chem. A, 2017, 5, 7 Search PubMed.
- L. He, W. C. Li, S. Xu and A. H. Lu, Chem.–Eur. J., 2019, 25, 3209–3218 CrossRef CAS PubMed.
- S. Zhao, F. Chen, X. Zhu, W. Liu, C. Wu, J. Zhang, S. Ren, Z. Yan, W. Cao, Q. Zhang and X. Li, J. Hazard. Mater., 2021, 413, 125299 CrossRef CAS PubMed.
- L. Qu, Y. Liu, J. B. Baek and L. Dai, ACS Nano, 2010, 4, 1321–1326 CrossRef CAS PubMed.
- A. L. Ong, D. K. Whelligan, M. L. Fox and J. R. Varcoe, Phys. Chem. Chem. Phys., 2013, 15, 18992–19000 RSC.
- G. Wu, K. L. More, C. M. Johnston and P. Zelenay, Science, 2011, 332, 443–447 CrossRef CAS PubMed.
- B. Chaloner-Gill, C. J. Cheer, J. E. Roberts and W. B. Euler, Macromolecules, 1990, 23, 4597–4603 CrossRef CAS.
- C. Liang and S. Dai, J. Am. Chem. Soc., 2006, 128, 5316–5317 CrossRef CAS PubMed.
- G. Yang, H. Han, T. Li and C. Du, Carbon, 2012, 50, 3753–3765 CrossRef CAS.
- J. Liu, T. Yang, D.-W. Wang, G. Q. Lu, D. Zhao and S. Z. Qiao, Nat. Commun., 2013, 4, 7 Search PubMed.
- J. Zhang, Z. Zhao, Z. Xia and L. Dai, Nat. Nanotechnol., 2015, 10, 444–452 CrossRef CAS PubMed.
- J. C. Groen, L. A. A. Peffer and J. Pérez-Ramírez, Microporous Mesoporous Mater., 2003, 60, 1–17 CrossRef CAS.
- S. Shrestha, S. Asheghi, J. Timbro and W. E. Mustain, Appl. Catal., A, 2013, 464–465, 233–242 CrossRef CAS.
- J. Yang, Y. Zhai, Y. Deng, D. Gu, Q. Li, Q. Wu, Y. Huang, B. Tu and D. Zhao, J. Colloid Interface Sci., 2010, 342, 579–585 CrossRef CAS PubMed.
- F. Su, C. K. Poh, J. S. Chen, G. Xu, D. Wang, Q. Li, J. Lin and X. W. Lou, Energy Environ. Sci., 2011, 4, 717–724 RSC.
- Z. Lin, G. H. Waller, Y. Liu, M. Liu and C.-p. Wong, Nano Energy, 2013, 2, 241–248 CrossRef CAS.
- W. Ding, Z. Wei, S. Chen, X. Qi, T. Yang, J. Hu, D. Wang, L. J. Wan, S. F. Alvi and L. Li, Angew. Chem., 2013, 52, 11755–11759 CrossRef CAS PubMed.
- J. R. Pels, F. Kapteijn, J. A. Moulijn, Q. Zhu and K. M. Thomas, Carbon, 1995, 33, 1641–1653 CrossRef CAS.
- Z. Tian, S. Dai and D.-e. Jiang, Chem. Mater., 2015, 27, 5775–5781 CrossRef CAS.
- D. Yu, Q. Zhang and L. Dai, J. Am. Chem. Soc., 2010, 132, 15127–15129 CrossRef CAS PubMed.
- D. Singh, J. Tian, K. Mamtani, J. King, J. T. Miller and U. S. Ozkan, J. Catal., 2014, 317, 30–43 CrossRef CAS.
- D. Zhao, J. L. Shui, C. Chen, X. Chen, B. M. Reprogle, D. Wang and D. J. Liu, Chem. Sci., 2012, 3, 3200–3205 RSC.
- X. Ge, A. Sumboja, D. Wuu, T. An, B. Li, F. W. T. Goh, T. S. A. Hor, Y. Zong and Z. Liu, ACS Catal., 2015, 5, 4643–4667 CrossRef CAS.
- S. Zhao, H. Yin, L. Du, L. He, K. Zhao, L. Chang, G. Yin, H. Zhao, S. Liu and Z. Tang, ACS Nano, 2014, 8, 12660–12668 CrossRef CAS PubMed.
- M. Chokai, M. Taniguchi, S. Moriya, K. Matsubayashi, T. Shinoda, Y. Nabae, S. Kuroki, T. Hayakawa, M.-a. Kakimoto, J.-i. Ozaki and S. Miyata, J. Power Sources, 2010, 195, 5947–5951 CrossRef CAS.
- J. Chen, Y. Li, N. Lu, C. Tian, Z. Han, L. Zhang, Y. Fang, B. Qian, X. Jiang and R. Cui, J. Mater. Chem. A, 2018, 6, 23560–23568 RSC.
- D. Geng, Y. Chen, Y. Chen, Y. Li, R. Li, X. Sun, S. Ye and S. Knights, Energy Environ. Sci., 2011, 4, 760 RSC.
- P. H. Matter, E. Wang, M. Arias, E. J. Biddinger and U. S. Ozkan, J. Mol. Catal. A: Chem., 2007, 264, 73–81 CrossRef CAS.
- A. K. Díaz-Duran and F. Roncaroli, Electrochim. Acta, 2017, 251, 638–650 CrossRef.
- F. Roncaroli, E. S. Dal Molin, F. A. Viva, M. M. Bruno and E. B. Halac, Electrochim. Acta, 2015, 174, 66–77 CrossRef CAS.
- G. Liu, X. Li and B. Popov, ECS Trans., 2019, 25, 1251–1259 CrossRef.
- R. Silva, D. Voiry, M. Chhowalla and T. Asefa, J. Am. Chem. Soc., 2013, 135, 7823–7826 CrossRef CAS PubMed.
- J. Liang, Y. Jiao, M. Jaroniec and S. Z. Qiao, Angew. Chem., Int. Ed., 2012, 51, 11496–11500 CrossRef CAS PubMed.
- T. Wang, Z.-X. Chen, Y.-G. Chen, L.-J. Yang, X.-D. Yang, J.-Y. Ye, H.-P. Xia, Z.-Y. Zhou and S.-G. Sun, ACS Energy Lett., 2018, 3, 986–991 CrossRef CAS.
Footnote |
| † Electronic supplementary information (ESI) available. See DOI: 10.1039/d1ra03255k |
| This journal is © The Royal Society of Chemistry 2021 |