DOI:
10.1039/D1RA03238K
(Paper)
RSC Adv., 2021,
11, 21332-21342
Validated spectral manipulations for determination of an anti-neoplastic drug and its related impurities including its hazardous degradation product
Received
26th April 2021
, Accepted 7th June 2021
First published on 16th June 2021
Abstract
Innovative and specific double dual wavelength, dual ratio subtraction spectrophotometric methods were carried out along with a successive ratio subtraction spectrophotometric method for determination of dacarbazine and its related impurities including toxic and hazardous ones. For determination of dacarbazine by the double dual wavelength method, the absorbance differences between 323 and 350 nm of the zero order absorption spectra of dacarbazine were used. The values of absorbance difference between 267.2 and 286.2 nm of the zero order spectra of 5-amino-imidazole-4 carboxamide were used for its determination by the dual ratio subtraction method. The zero order absorption spectrum of 2-azahypoxanthine at 235 nm was used for its determination after applying the successive ratio subtraction method. ICH guidelines were followed for validation of the developed methods, where linear relationships were obtained in the range of 4–20, 1–16, and 2–20 μg mL−1 for dacarbazine, 5-amino imidazole-4-carboxamide and 2-azahypoxanthine, respectively. Accurate, precise, and specific results were obtained upon applying the proposed methods according to ICH guidelines. Furthermore, the developed methods were successfully applied for determination of dacarbazine in its pharmaceutical formulation. Comparing the results of the developed methods with those of the official USP spectrophotometric method statistically showed no significant difference. The developed methods don't need any sophisticated techniques so they are considered cost effective methods. Moreover, the introduced methods have the advantages of being green where water was used as a solvent. The methods proved to be more economic, fast and simple than other reported HPLC methods.
1. Introduction
Dacarbazine (DTIC), 3,3-dimethyltriazeno-imidazole-4-carboxamide (Fig. 1a),1 is an antineoplastic drug which is activated in the liver before acting as an alkylating agent. Dacarbazine is mainly used as a therapeutic agent for metastatic malignant melanoma. It can also be used as a combination therapy for soft-tissue sarcoma, Hodgkin's disease, neuroblastoma, Kaposi's sarcoma, and different tumors.1 According to USP,2 there are two related impurities for DTIC identified as 5-amino-imidazole-4 carboxamide (AIC), Fig. 1b,2 and 2-azahypoxanthine (AHX), Fig. 1c,.2 The British pharmacopeia safety data sheet revealed that AHX is a harmful substance which causes skin irritations and serious eye irritations; moreover it may cause cancer, genetic defects, and respiratory irritations.3 AHX is also considered the major degradation product of both photolysis and hydrolysis of DTIC.4 AHX was found to be the cause of the painful effect of DTIC peripheral intravenous infusion.5 According to the literature survey, DTIC was determined by HPLC methods either alone6 or with other drugs.7,8 HPLC methods were also used for determination of the ternary mixture but one of them required a very long time for analysis exceeding 25 minutes,9 and the other one was gradient elution using acetonitrile10 which is considered one of the most hazardous solvents to human health and environmental safety according to the environment, health and safety (EHS) and the life cycle assessment (LCA) protocols.11 Chromatographic methods like HPLC also have various limitations like complexity, utilizing various expensive solvents, in addition to tedious sample pretreatment steps. Therefore, development of environmentally friendly, simple, economic, cost and time saving spectrophotometric methods for determination of DTIC and its related impurities, including the toxic and hazardous one3 becomes of a great importance. Comparing the results of the developed methods with those of the USP official spectrophotometric method2 statistically showed no significant difference. Validation of the developed methods was confirmed by the results of the ICH guidelines parameters.12
 |
| | Fig. 1 Chemical stuctures of (a) DTIC. (b) AIC, and (c) AHX. | |
1.1 Theoretical background
1.1.1 Double dual wavelength spectrophotometric method (DDW). Double dual wavelength (DDW) method depends on the same concept of the previously established dual wavelength spectrophotometric method which relies on the fact that the difference in absorbance values between two wavelengths of the absorption spectra is directly related to the concentration of a definite component, while the other components showed no interference.13 The cornerstone in the development of this method is the appropriate choice of the two wavelengths; where each of the two interfering components has the same absorbance values, while the determined component has a significant difference. The developed method is considered a new successful application of the dual wavelength method on three components not only two.
1.1.2 Dual ratio subtraction method (DRS). Dual ratio subtraction (DRS) method depends on coupling of ratio subtraction and dual wavelength spectrophotometric methods, where the interference from the most extended component is eliminated using ratio subtraction method, then dual wavelength on the obtained spectra was applied by choosing two wavelengths where the component to be measured shows significant absorbance difference while the absorbance of the other interfering component is the same. First, ratio subtraction method steps were followed;14 where division of the mixtures spectra (X + Y) by a certain concentration of X (the most extended component) was done, where new curves resulted (Y/X′ + [X/X′ = constant1]). The constant values were then subtracted from the resulted ratio spectra, and the new obtained curves were multiplied by X′ (the divisor). Dual wavelength on the developed spectra was then applied to determine Y.
1.1.3 Successive ratio subtraction method (SRS). Successive ratio subtraction method was recently developed for separation and quantitative determination of ternary mixtures.14 For determination of the most un extended component [Z], the following steps were followed. First ratio subtraction method was applied as mentioned before in DRS, then the developed spectra were divided by Y′, where the resulted curves represent (X/Y′ + [Y/Y′ = constant2]). Constant values were then subtracted from the resulted ratio spectra, and then the new curves were multiplied by Y′ (the divisor). There was a coincidence point between the resulted spectra and the zero order spectra of AHX at 235 nm which was used for its determination.
2. Experimental
2.1 Instruments
UV-VIS spectrophotometer (SHIMADZU, Japan) model UV-1601 PC, and quartz cell with 1 cm path length, linked to IBM adaptable computer were used. The software used was UVPC personal spectroscopy version 3.7.
2.2 Materials and reagents
2.2.1 Pure samples. Dacarbazine was bought from Sigma-Aldrich Chemie GmbH, Germany. The purity was 99.6% according to the official USP spectrophotometric method.2 AIC was purchased from Alfa Aesar, Kandel, Germany with a certified purity of 95%.
2.2.2 Pharmaceutical formulation. Dacarbazine medac® powder for injection (Batch No. C180075B) was labeled to contain 200 mg of DTIC per vial; it was manufactured by Medac Gmbh, Wedel, Germany.
2.2.3 Chemicals. Methanol, HPLC grade (CHROMASOLVE, Sigma-Aldrich, ChemieGmbH, Germany) and water for injection (Egypt, Otsuka Pharmaceutical Co., 10th of Ramadan, Egypt), HCl and NaNO2 (El-Nasr Pharmaceutical Chemicals Co., Cairo, Egypt).
3. Procedures
3.1 Preparation of AHX
5-Amino-imidazole-4-carboxamide. HCL (AIC. HCL) (2 g, 0.012 mol) in 6 M HCl (8 mL) was added drop wise to a stirred solution of NaNO2 (6.45 g, 0.094 mol) in H2O (24 mL) at 0 °C for 30 minutes. After stirring of the solution for 1 hour, the mixture was filtered, and the residue was washed with tetra hydro furan. 4-Diazo-4H-imidazole-5-carboxamide (DICA) was formed as crude powder after drying the residue at room temperature. A suspension of the crude material DICA (0.318 g, 0.0023 mol) in MeOH (5 mL) was stirred at 60 °C for 10 hours. After cooling, activated carbon was added until the red solution was changed to black. Stirring of the resulted solution was done for 12 hours at room temperature, followed by filtration, and evaporation under reduced pressure to form 2-azahypoxanthine (AHX) (0.282 g, 0.0021 mol) as a white powder,15 Fig. 2. 1H NMR, MS, and IR analyses were done to confirm the formation of AHX, Fig. 3–5.
 |
| | Fig. 2 Synthesis pathway of AHX from AIC. HCL. | |
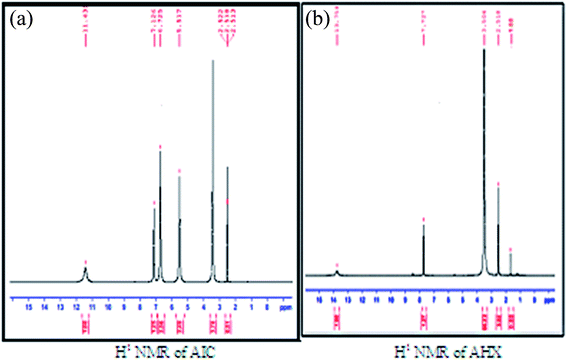 |
| | Fig. 3 H1 NMR of AIC and AHX. | |
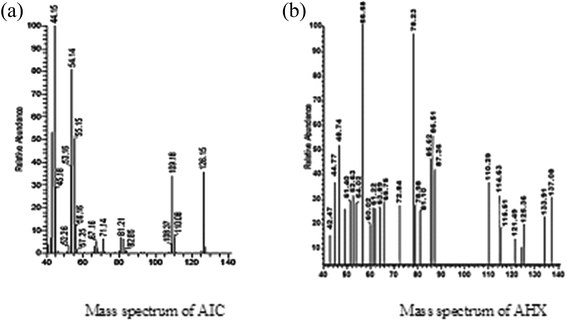 |
| | Fig. 4 Mass spectra of AIC and AHX. | |
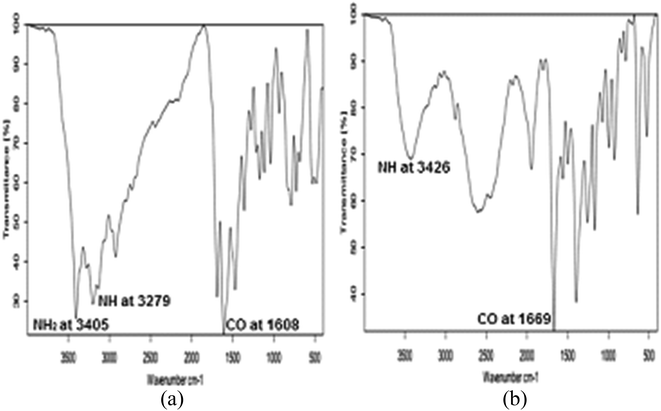 |
| | Fig. 5 IR spectra of AIC and AHX. | |
3.2 Preparation of standard solutions
Methanol was the solvent used for preparation of 1000 μg mL−1 stock solutions of DTIC, AIC and AHX, and water for injection was used for preparation of 100 μg mL−1 of their respective working solutions.
3.3 Preparation of laboratory mixtures
Water for injection was used for preparation of mixtures containing variable ratios of DTIC, AIC, and AHX using their respective working solutions.
3.4 Preparation of pharmaceutical formulation
A sample equivalent to 25 mg of DTIC was weighed, and 20 mL methanol was added in 25 mL volumetric flask for dissolving DTIC. The resulted solution was ultra-sonicated for 30 min., then filteration, cooling, and completing to volume with sterile water were carried out. The working solution of DTIC (100 μg mL−1) was obtained by diluting the resulted solution with sterile water to get DTIC from its pharmaceutical dosage form.
3.5 Spectral characteristics
The absorption spectra of DTIC, AIC, and AHX were recorded from 200 to 400 nm, where water was used as a blank, Fig. 6.
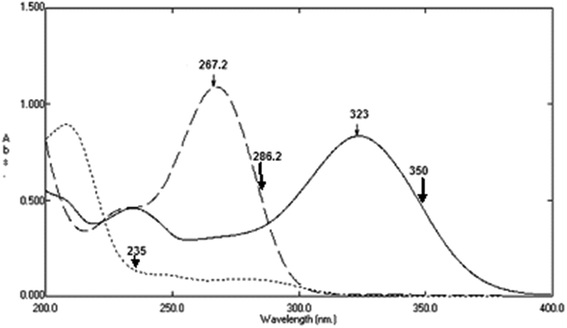 |
| | Fig. 6 Zero order absorption spectra of 12 μg mL−1 of DTIC (![[thick line, graph caption]](https://www.rsc.org/images/entities/char_e117.gif) ), AIC ( ), AIC (![[dash dash, graph caption]](https://www.rsc.org/images/entities/char_e091.gif) ), and AHX (…) using sterile water as a blank. ), and AHX (…) using sterile water as a blank. | |
3.6 Construction of calibration curves
Variable portions equivalent to (40–200 μg) of DTIC (10–160 μg) of AIC, and (20–200 μg) of AHX, were taken from their respective working solutions (100 μg mL−1), and completed to volume with sterile water in a set of 10 mL volumetric flasks. Plotting the absorbance differences between 323 and 350 nm of the zero order absorption spectra of DTIC, Fig. 7, for DDW method, against their respective concentrations was carried out, and then its regression equation was computed. For DRS method, plotting the absorbance differences between 267.2 and 286.2 nm of the zero order spectra of AIC, Fig. 8, against their respective concentrations was carried out, and then its regression equation was computed. The calibration curve which relates the zero order absorption spectra of AHX at 235 nm, Fig. 9, and its corresponding concentrations for SRS method was constructed, and then its regression equation was computed.
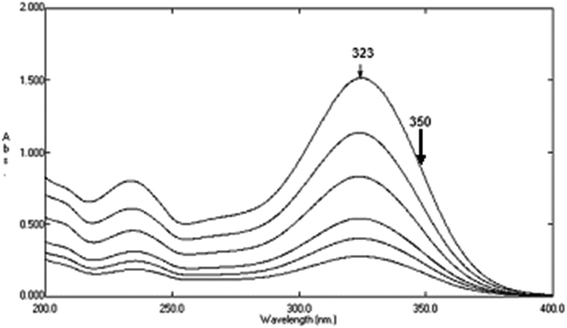 |
| | Fig. 7 Zero order absorption spectra of pure DTIC (4–20 μg mL−1) using sterile water as a blank. | |
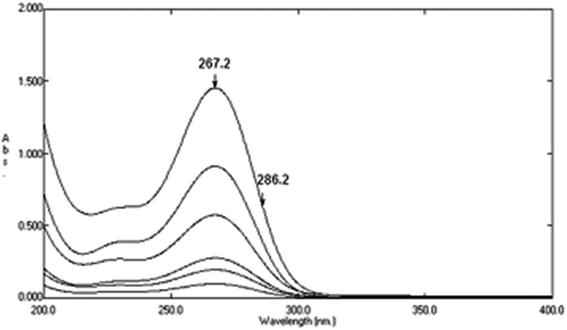 |
| | Fig. 8 Zero order absorption spectra of pure AIC (1–16 μg mL−1) using sterile water as a blank. | |
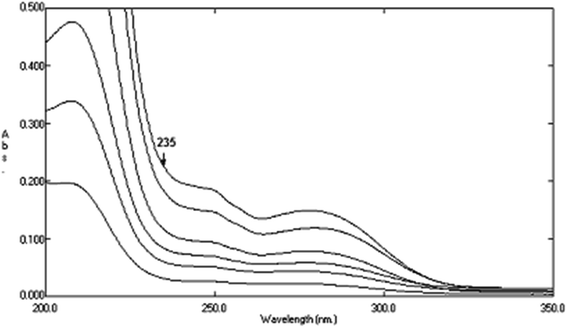 |
| | Fig. 9 Zero order absorption spectra of pure AHX (2–20 μg mL−1) using sterile water as blank. | |
3.6.1 Determination of DTIC in lab. prepared mixtures by DDW method. The difference in values of zero order absorbance among 323 and 350 nm of the spectra of the laboratory prepared mixtures was used for determination of DTIC was determined using where the absorbance difference values at these selected wavelengths for each of the related impurities equal zero.
3.6.2 Determination of AIC in lab. prepared mixtures by DRS method. Division of the mixtures spectra by 16 μg mL−1 of DTIC was carried out, followed by subtraction of the constant in the plateau region (305–330 nm), and then multiplication of the resulted ratio spectra by the divisor (16 μg mL−1 of DTIC), then AIC concentrations were determined using the resulted spectra after applying the regression equation of the zero order absorbance difference values of AIC between 267.2 and 286.2 nm where the absorbance difference was zero for AHX at those selected wavelengths.
3.6.3 Determination of AHX in lab. prepared mixtures by SRS method. Ratio subtraction was applied on the mixtures as mentioned in DRS method and then the resulted spectra were divided by 6 μg mL−1 of AIC. The constant of the plateau region (260–272 nm) was subtracted, and then the resulted ratio spectra were multiplied by the same divisor (6 μg mL−1 of AIC). The obtained spectra were used for calculating AHX concentration at 235 nm where there was a coincidence point with the zero order spectra of AHX after application of the regression equation obtained from AHX zero order spectra at 235 nm.
4. Results
2-Azahypoxanthine was prepared from AIC and the structure was elucidated by 1H NMR, MS, and IR analyses, Fig. 3–5. H1NMR revealed disappearance of hydrogens of NH2 groups of AIC and appearance of triazinone single hydrogen of AHX, Fig. 3a and b. A base peak at m/z 137.1 appeared in MS chart which correspond to AHX molecular weight, Fig. 4b. Structure of AHX was further assured by disappearance of the forked peak of NH2 groups as revealed by IR analyses, Fig. 5a and b.
4.1 Determination of DTIC using double dual wavelength method (DDW)
Dacarbazine was determined by plotting the absorbance differences between 323 and 350 nm of the zero order absorption spectra of DTIC against their corresponding concentrations, Fig. 7, followed by computing its regression equation. It was also determined in laboratory prepared mixtures by calculating the absorbance differences between 323 and 350 nm of the zero order absorption spectra of the mixtures where the absorbance difference at those selected wavelengths equal zero for each of the two related impurities.
4.2 Determination of AIC using dual ratio subtraction method (DRS)
Determination of AIC in lab. prepared mixtures was done using the newly proposed DRS method by applying ratio subtraction followed by dual wavelength for the resulted spectra. Division of the mixtures spectra by 16 μg mL−1 of DTIC as a divisor was carried out. The obtained curves represent  Fig. 10. Subtraction of the constant in the plateau region (305–330 nm) was done, Fig. 11, and the resulted ratio spectrum
  were multiplied by the divisor 16 μg mL−1 of DTIC, Fig. 12. The absorbance difference values between 323 and 350 nm of the resulted spectra representing AIC + AHX were used for calculating AIC concentration, where the absorbance difference was zero for AHX at these selected wavelengths, using the regression equation computed after construction of the calibration curve obtained by plotting the absorbance difference values between 323 and 350 nm of the zero order spectra of AIC against its corresponding concentrations, Fig. 8.
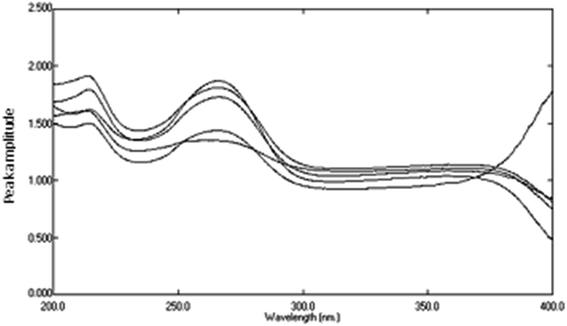 |
| | Fig. 10 Division spectra of variable lab. prepared mixtures if DTIC, AIC, and AHX using 16 μg mL−1 of DTIC as a divisor and sterile water as a blank. | |
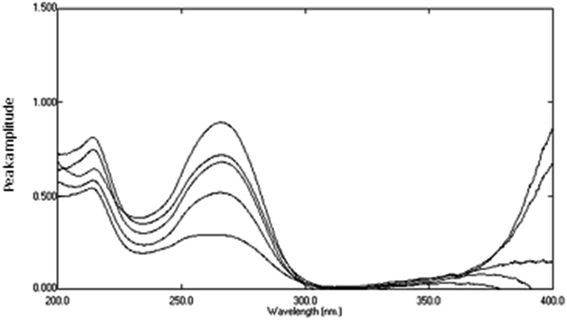 |
| | Fig. 11 The obtained spectra of variable lab. prepared mixtures of DTIC, AIC, and AHX using 16 μg mL−1 of STIC as a divisor and sterile water as a blank after subtracting the constant. | |
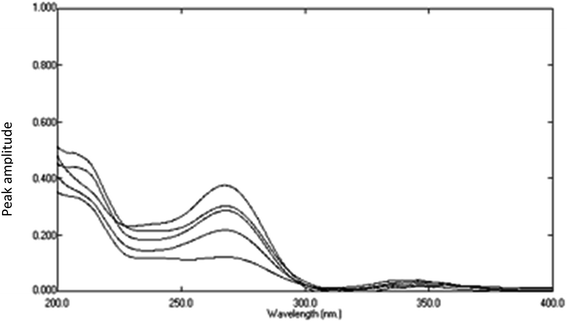 |
| | Fig. 12 The obtained spectra of variable lab. prepared mixtures of DTIC, AIC, and AHX after subtraction of the constant and multiplication by the divisor (16 μg mL−1 of DTIC). | |
4.3 Determination of AHX using successive ratio subtraction method (SRS)
Ratio subtraction was applied as mentioned under DRS method. The resulted spectra representing AIC + AHX were then redivided by 6 μg mL−1 of AIC. The new curves obtained represent  Fig. 13. The constant of the plateau region (260–272 nm) was subtracted, Fig. 14, and then the obtained ratio spectrum
  was multiplied by the divisor 6 μg mL−1 of AIC, Fig. 15. The new obtained spectra had a coincidence point with the zero order spectra of AHX at 235 nm, Fig. 16. AHX concentrations were determined from the regression equation computed after calibration curve construction which was obtained by plotting zero order absorbances of AHX at 235 nm against its corresponding concentrations, Fig. 9.
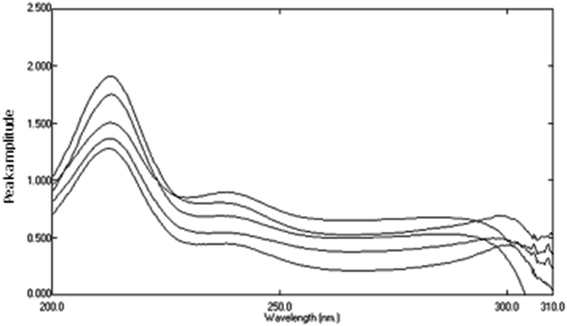 |
| | Fig. 13 Division spectra of lab. prepared mixtures obtained from RS method using 6 μg mL−1 of AIC as a divisor. | |
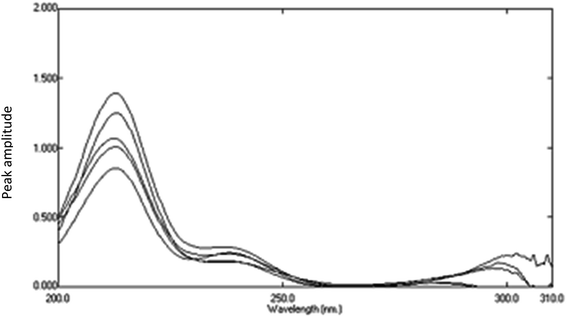 |
| | Fig. 14 Division spectra of lab. prepared mixtures obtained from RS method using 6 μg mL−1 of AIC as a advisor after subtraction of the constant. | |
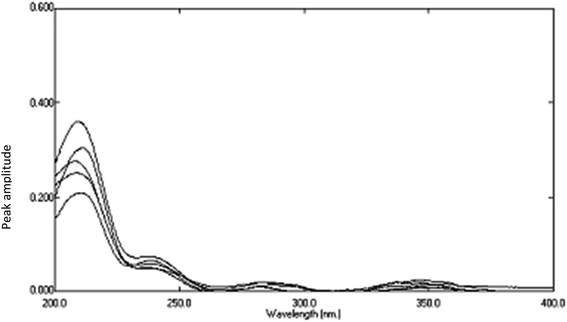 |
| | Fig. 15 The spectra of lab. prepared mixtures using SRS method after multiplication by the divisor (6 μg mL−1 of AIC). | |
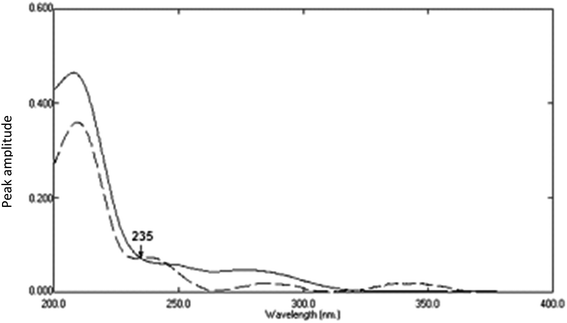 |
| | Fig. 16 The absorption spectrum of 6 μg mL−1 of AHX (![[dash dash, graph caption]](https://www.rsc.org/images/entities/char_e091.gif) ) and the obtained absorption spectrum of lab. prepared mixture containing 6 μg mL−1 of AHX (…) after multiplication by the divisor using SRS method. ) and the obtained absorption spectrum of lab. prepared mixture containing 6 μg mL−1 of AHX (…) after multiplication by the divisor using SRS method. | |
4.4 Methods validation
Application of methods validation parameters was carried out in adherence with the ICH guidelines.13
4.4.1 Linearity and range. Linear relationships were illustrated by calibration curves resulted from application of double dual wavelength for DTIC, dual ratio subtraction for AIC, and successive ratio subtraction for AHX where linearity was obtained in the range of 4–20 μg mL−1 for DTIC, 1–16 μg mL−1 for AIC, and 2–20 μg mL−1 for AHX, Table 1.
Table 1 Regression and analytical parameters of the developed spectrophotometric methods for determination of DTIC, AIC and AHXa
| (RSD%)a and (RSD%)b; the intra- and inter-day relative standard deviation of concentrations (8, 12, 18 μg mL−1) for DTIC, (2, 4, 10 μg mL−1) for AIC, and (6, 10, 16 μg mL−1) for AHX. |
| Parameters |
DTIC |
AIC |
AHX |
| Range (μg mL−1) |
4–20 |
1–16 |
2–20 |
| Slope |
0.0351 |
0.051 |
0.010 |
| Intercept |
−0.031 |
0.004 |
0.019 |
| Accuracy (mean ± SD) |
101.41 ± 1.154 |
99.76 ± 0.609 |
100.44 ± 0.738 |
| Correlation coefficient (r) |
0.9996 |
0.9999 |
0.9999 |
| Repeatability (RSD%)a |
1.363 |
1.196 |
1.271 |
| Intermediate precision (RSD%)b |
1.776 |
1.453 |
1.335 |
| LOD |
— |
0.128 |
0.560 |
| LOQ |
— |
0.388 |
1.697 |
4.4.2 Range. Establishment of calibration ranges for DTIC, AIC, and AHX was done through considerations of the practical ranges necessary in adherence to Beer's Lambert law and the concentration of DTIC present in pharmaceutical formulation to get linear, specific and accurate results, Table 1.
4.4.3 Accuracy. Accuracy clarifies the closeness of agreement between the obtained values and the real values. Calculation of pure DTIC, AIC, and AHX percentage recoveries was done to assess accuracy, Table 1, which was more confirmed by the standard addition technique, Table 2.
Table 2 Determination of DTIC in its dosage form by the developed method and standard addition technique results
| Average of 6 determinations. |
| Dacarbazine medac® powder for injection batch no: C180075B labeled to contain 200 mg DTIC/vial |
Taken (μg mL−1) |
8 |
| Founda% ± SD |
100.85 ± 0.595 |
| Standard addition technique |
Pure added (μg per band) |
Recovery% |
| 6 |
101.11 |
| 8 |
100.24 |
| 12 |
99.18 |
| Mean ± SD |
100.18 ± 0.967 |
4.4.4 Precision. Precision clarifies the closeness of agreement between sets of obtained values. Repeatability and intermediate precision were calculated to assess precision, values of RSD% were illustrated in Table 1.
4.4.6 Limits of detection and quantitation (LOD and LOQ). Limits of detection and quantitation indicate the lowest amount that can be detected and quantified. LOD and LOQ were calculated for the developed methods using the following equations; LOD = 3.3 × SD/slope, and LOQ = 10 × SD/slope, Table 1.Upon comparing the results achieved after application of the proposed spectrophotometric method for determination of DTIC in Dacarbazine® powder for injection and the results of the USP official spectrophotometric method2 statistically. The resulted values of t-test and F-test were less than theoretical values, which confirms accuracy and precision at 95% confidence level, Table 4.
Table 4 Parameters of statistical analysis of the results of the developed DDW spectrophotometric method compared with the official spectrophotometric method for determination of DTIC in Dacarbazine medac® powder for injection
| Parameters |
DDW spectrophotometric method |
Official spectrophotometric methodb [USP] |
| Figures in parenthesis are the corresponding tabulated values at p = 0.05. Direct spectrophotometric determination at 323 nm (The United States Pharmacopeia, 2011). |
| Mean |
100.85 |
100.67 |
| SD |
0.595 |
1.084 |
| n |
6 |
6 |
| Student's t-testa (2.228) |
0.4198 |
— |
| F-testa (5.050) |
3.320 |
— |
5. Discussion
The challenge to develop green, simple, and economic spectrophotometric methods to resolve components with overlapping spectra is the main goal for any pharmaceutical analyst.16 The literature survey showed that no spectrophotometric methods were reported for determination of the studied mixture; hence, the main focus of the presented research was on developing novel and green spectrophotometric methods for determination of the anti neoplastic drug, dacarbazine, and its related impurities, including its hazardous and toxic one, AHX.3 Regarding the greenness profile,17 water successfully passes the four acceptance criteria (no hazards, no corrosion, no PBT (persistence, bio accumulation, and toxicity)), and there isn't any harmful wastes produced from using it, so it is a completely green and is considered the first choice of green solvents.18 The developed methods have the merits of being more time saving and green compared to the previously published HPLC methods.9,10 The first HPLC method used an avidin protein column and a mobile phase consisting of 2-propanol: phosphate buffer (pH 7, 0.02 M) 4![[thin space (1/6-em)]](https://www.rsc.org/images/entities/char_2009.gif) :
:![[thin space (1/6-em)]](https://www.rsc.org/images/entities/char_2009.gif) 96 v/v which required very long time for analysis exceeding 25 minutes.9 The second reported HPLC method used a mobile phase consisting of 100% 0.5 M sodium acetate (pH 7.0) and 25% acetonitrile in 0.05 M sodium acetate (pH 5.5) by gradient elution;10 acetonitrile is considered one of the most hazardous solvents to human and environment.11 Moreover, the developed methods don't need any sophisticated techniques and don't require any sample pretreatments.
96 v/v which required very long time for analysis exceeding 25 minutes.9 The second reported HPLC method used a mobile phase consisting of 100% 0.5 M sodium acetate (pH 7.0) and 25% acetonitrile in 0.05 M sodium acetate (pH 5.5) by gradient elution;10 acetonitrile is considered one of the most hazardous solvents to human and environment.11 Moreover, the developed methods don't need any sophisticated techniques and don't require any sample pretreatments.
6. Conclusion
The main aim of the proposed research is the development and validation of novel, simple, cost effective, time saving, and eco-friendly spectrophotometric methods for determination of the antineoplastic drug, DTIC in bulk powder and in dosage form without the need of sophisticated techniques or tedious sample pre-treatment steps. The main advantage of the developed methods arises from using the zero order absorption spectra without needing any derivatization steps. The proposed methods have the capability to determine DTIC along with its related impurities including the very hazardous and toxic degradation product, AHX3 with high accuracy and precision. The developed methods have the merits of being more simple, economic, time saving and eco-friendly compared to the previously published HPLC methods using the most ever green solvent, water, as a blank. Additionally, successful application was done for determination DTIC in Dacarbazine medac® powder for injection, where no interference from any pharmaceutical formulation excipients.
Conflicts of interest
There are no conflicts of interests to declare.
Acknowledgements
The authors would like to extend their sincere appreciation to Taif University Researchers Supporting Project number (TURSP-2020/56), Taif University, Taif, Saudi Arabia.
References
- S. C. Sweetman, Martindale, the complete drug reference, Pharmaceutical Press, London, UK, 36th edn, 2009 Search PubMed.
- The United States Pharmacopeia, National Formulary, United States Pharmocopeia Convention, INC, USA, 34th edn 29, 2011 Search PubMed.
- Pharmacopoeia, B, Safety data sheet of 2- Azahypoxanthine impurity standard, 2013 Search PubMed.
- B. V. Shetty, R. L. Schowen, M. Slavik and C. M. Riley, Degradation of dacarbazine in aqueous solution, J. Pharm. Biomed. Anal., 1992, 10(9), 675–683 CrossRef CAS PubMed.
- M. Tashiro, T. Naito, C. Yamamoto, S. Y. Katoh and J. Kawakami, Impact of Light Shielding on Photo-Degradation of Dacarbazine during the Preparation Process, Biol. Pharm. Bull., 2019, 42(12), 2062–2068 CrossRef CAS PubMed.
- M. L. Prasanth and S. Siddiraju, Stability indicating HPLC method for the determination of Dacarbazine in pharmaceutical dosage form, Int. J. Pharm., 2014, 4(3), 5–12 Search PubMed.
- D. T. King and J. T. Stewart, HPLC determination of dacarbazine, doxorubicin, and ondansetron mixture in 5% dextrose injection on underivatized silica with an aqueous-organic mobile phase, J. Liq. Chromatogr. Relat. Technol., 1993, 16(11), 2309–2323 CrossRef CAS.
- Z. M. Muhammad, M. Ahmad and S. Muahammad, Rapid and simultaneous determination of adriamycin, bleomycin, vinblastine and dacarbazine in plasma of Hodgkin's lymphoma patients by a reversed phase HPLC method, J. Chil. Chem. Soc., 2013, 58(2), 1674–1677 CrossRef.
- A. Haque and J. T. Stewart, Isocratic determination of dacarbazine and related impurities 2-azahypoxanthine and 5-amino-imidazole-4-carboxamide by HPLC on an avidin protein column, J. Liq. Chromatogr. Relat. Technol., 1999, 22(6), 933–943 CrossRef CAS.
- D. Fiore, A. J. Jackson, M. S. Didolkar and V. R. Dandu, Simultaneous determination of dacarbazine, its photolytic degradation product, 2-azahypoxanthine, and the metabolite 5-aminoimidazole-4-carboxamide in plasma and urine by high-pressure liquid chromatography, Antimicrob. Agents Chemother., 1985, 27(6), 977–979 CrossRef CAS.
- C. Capello, U. Fischer and K. Hungerbühler, What is a green solvent? A comprehensive framework for the environmental assessment of solvents, Green Chem., 2007, 9(9), 927–934 RSC.
- ICH, Q2 (R1) Validation of Analytical Procedures, Proceedings of International Conference on Harmonization, Geneva, 2005 Search PubMed.
- E. A. Abdelaleem, I. A. Naguib, E. S. Hassan and N. W. Ali, Development and Validation of Three Spectrophotometric Methods for Simultaneous Determination of Paracetamol and Pamabrom in Bulk and Pharmaceutical Formulation, Anal. Chem. Lett., 2016, 6(1), 13–23 CrossRef CAS.
- A. A. Emam, E. A. Abdelaleem, I. A. Naguib, F. F. Abdallah and N. W. Ali, Successive ratio subtraction as a novel manipulation of ratio spectra for quantitative determination of a mixture of furosemide, spironolactone and canrenone, Spectrochim. Acta, Part A, 2018, 192, 427–436 CrossRef CAS PubMed.
- K. Ikeuchi, R. Fujii, S. Sugiyama, T. Asakawa, M. Inai, Y. Hamashima and T. Kan, Practical synthesis of natural plant-growth regulator 2-azahypoxanthine, its derivatives, and biotin-labeled probes, Org. Biomol. Chem., 2014, 12(23), 3813–3815 RSC.
- A. A. Emam and N. W. Ali, Validated determination of diacerein and its active metabolite, rhein, by stability indicating constant pattern method as a novel manipulation of zero order spectra, Bull. Fac. Pharm., 2018, 56(1), 73–79 Search PubMed.
- E. S. Elzanfaly, M. A. Hegazy, S. S. Saad, M. Y. Salem and L. E. Abd El Fattah, Validated green high-performance liquid chromatographic methods for the determination of coformulated pharmaceuticals: A comparison with reported conventional methods, J. Sep. Sci., 2015, 38(5), 757–763 CrossRef CAS PubMed.
- K. Hartonen and M. L. Riekkola, Water as the first choice green solvent, in The Application of Green Solvents in Separation Processes. Elsevier, 2017, pp. 19–55 Search PubMed.
|
| This journal is © The Royal Society of Chemistry 2021 |
Click here to see how this site uses Cookies. View our privacy policy here.  Open Access Article
 a,
Eglal A. Abdelaleemb,
Eman S. Hassan
 *b and
Aml A. Emamb

![[thick line, graph caption]](https://www.rsc.org/images/entities/char_e117.gif) ), AIC (
), AIC (![[dash dash, graph caption]](https://www.rsc.org/images/entities/char_e091.gif) ), and AHX (…) using sterile water as a blank.
), and AHX (…) using sterile water as a blank. Fig. 10. Subtraction of the constant in the plateau region (305–330 nm) was done, Fig. 11, and the resulted ratio spectrum
  were multiplied by the divisor 16 μg mL−1 of DTIC, Fig. 12. The absorbance difference values between 323 and 350 nm of the resulted spectra representing AIC + AHX were used for calculating AIC concentration, where the absorbance difference was zero for AHX at these selected wavelengths, using the regression equation computed after construction of the calibration curve obtained by plotting the absorbance difference values between 323 and 350 nm of the zero order spectra of AIC against its corresponding concentrations, Fig. 8.


 Fig. 13. The constant of the plateau region (260–272 nm) was subtracted, Fig. 14, and then the obtained ratio spectrum
  was multiplied by the divisor 6 μg mL−1 of AIC, Fig. 15. The new obtained spectra had a coincidence point with the zero order spectra of AHX at 235 nm, Fig. 16. AHX concentrations were determined from the regression equation computed after calibration curve construction which was obtained by plotting zero order absorbances of AHX at 235 nm against its corresponding concentrations, Fig. 9.


![[thin space (1/6-em)]](https://www.rsc.org/images/entities/char_2009.gif) :
:![[thin space (1/6-em)]](https://www.rsc.org/images/entities/char_2009.gif) AIC
AIC![[thin space (1/6-em)]](https://www.rsc.org/images/entities/char_2009.gif) :
:![[thin space (1/6-em)]](https://www.rsc.org/images/entities/char_2009.gif) AHX
AHX![[thin space (1/6-em)]](https://www.rsc.org/images/entities/char_2009.gif) :
:![[thin space (1/6-em)]](https://www.rsc.org/images/entities/char_2009.gif) 4
4![[thin space (1/6-em)]](https://www.rsc.org/images/entities/char_2009.gif) :
:![[thin space (1/6-em)]](https://www.rsc.org/images/entities/char_2009.gif) 4
4![[thin space (1/6-em)]](https://www.rsc.org/images/entities/char_2009.gif) :
:![[thin space (1/6-em)]](https://www.rsc.org/images/entities/char_2009.gif) 1
1![[thin space (1/6-em)]](https://www.rsc.org/images/entities/char_2009.gif) :
:![[thin space (1/6-em)]](https://www.rsc.org/images/entities/char_2009.gif) 4
4![[thin space (1/6-em)]](https://www.rsc.org/images/entities/char_2009.gif) :
:![[thin space (1/6-em)]](https://www.rsc.org/images/entities/char_2009.gif) 3
3![[thin space (1/6-em)]](https://www.rsc.org/images/entities/char_2009.gif) :
:![[thin space (1/6-em)]](https://www.rsc.org/images/entities/char_2009.gif) 6
6![[thin space (1/6-em)]](https://www.rsc.org/images/entities/char_2009.gif) :
:![[thin space (1/6-em)]](https://www.rsc.org/images/entities/char_2009.gif) 2
2![[thin space (1/6-em)]](https://www.rsc.org/images/entities/char_2009.gif) :
:![[thin space (1/6-em)]](https://www.rsc.org/images/entities/char_2009.gif) 3
3![[thin space (1/6-em)]](https://www.rsc.org/images/entities/char_2009.gif) :
:![[thin space (1/6-em)]](https://www.rsc.org/images/entities/char_2009.gif) 3
3![[thin space (1/6-em)]](https://www.rsc.org/images/entities/char_2009.gif) :
:![[thin space (1/6-em)]](https://www.rsc.org/images/entities/char_2009.gif) 3
3![[thin space (1/6-em)]](https://www.rsc.org/images/entities/char_2009.gif) :
:![[thin space (1/6-em)]](https://www.rsc.org/images/entities/char_2009.gif) 96 v/v which required very long time for analysis exceeding 25 minutes.9 The second reported HPLC method used a mobile phase consisting of 100% 0.5 M sodium acetate (pH 7.0) and 25% acetonitrile in 0.05 M sodium acetate (pH 5.5) by gradient elution;10 acetonitrile is considered one of the most hazardous solvents to human and environment.11 Moreover, the developed methods don't need any sophisticated techniques and don't require any sample pretreatments.
96 v/v which required very long time for analysis exceeding 25 minutes.9 The second reported HPLC method used a mobile phase consisting of 100% 0.5 M sodium acetate (pH 7.0) and 25% acetonitrile in 0.05 M sodium acetate (pH 5.5) by gradient elution;10 acetonitrile is considered one of the most hazardous solvents to human and environment.11 Moreover, the developed methods don't need any sophisticated techniques and don't require any sample pretreatments.


