 Open Access Article
Catalytic hydrogenolysis of larix bark proanthocyanidins in ionic liquids produces UV blockers with potential for use in cosmetics
Meng Zhou b,
Xiaoxia Chenb,
Chong Gaob,
Liwen Nib,
Xuechun Wangb,
Wudi Zhangb and
Shixue Ren
 *ab
*ab
aKey Laboratory of Bio-based Material Science and Technology of Ministry of Education, Northeast Forestry University, China
bCollege of Materials Science and Engineering, Northeast Forestry University, Harbin 150040, P. R. China. E-mail: renshixue@nefu.edu.cn
First published on 9th September 2021
Abstract
The bark of larix, a major tree species in the coniferous forests of China's Greater Khingan Mountains, is typically treated as waste. The bark is, however, rich in flavonoids, known as proanthocyanidins, although their high degree of polymerization and high molecular weight reduce their biological activity and potential applications. Ionic liquids, a new type of “green solvent”, characterized by low vapor pressure and good stability, have been developed and used as new solvents for naturally occurring macromolecules. Here, we used 1-butyl-3-methylimidazole chloride ([BMIM]Cl) as the ionic solvent to reduce the degree of polymerization of larix bark proanthocyanidins by Pd/C-catalyzed hydrogenolysis. The optimal reaction conditions, determined using an orthogonal experimental design, were: reaction temperature, 90 °C; reaction time, 1.5 h; catalyst loading, 4 g L−1 (Pd/C: [BMIM]Cl); and hydrogen pressure, 2.5 MPa. Characterization of the reaction products by UV-Vis and IR spectroscopy and gel permeation chromatographys showed that they retained the proanthocyanidin structure. We showed that whilst both the native and depolymerized proanthocyanidins were able to block UV light when added to commercially available skin creams and sunscreens, the depolymerized proanthocyanidins were more effective at a given concentration. This study expands the applications of a new “green” ionic liquid solvent, provides a technical foundation for the low-cost depolymerization of larix bark proanthocyanidins, and also explores a potential high-value use for waste larix bark as the source of a UV-blocking additive for cosmetics.
1 Introduction
Larix, a long-lived, fast-growing tree, is the main species in the coniferous forests of China's Greater Khingan Mountains and is also an important species for forest regeneration and afforestation. The harvesting and processing of larix produces a large amount of residues, such as bark and wood powder, which are typically viewed as a low value resource and used as fuel. Preparation of highly active polyphenols from the by-products of the pulping industry is a green strategy to realize the high value utilization of agricultural and forestry wastes.1 These phenolic structures, such as lignin, have broad application prospects in the field of materials, and also inspire our interest in the research of bioactive polyphenols.1–3 Larix bark is, however, rich in proanthocyanidins, which account for 10–16% of the bark mass. Proanthocyanidins are formed by polymerization of catechin and epicatechin subunits via bonds between C4 in the C ring and C8 or C6 in the A ring (C4–C8 or C4–C6 bonds, Fig. 1). The average degree of polymerization (DP) of proanthocyanidins in larix bark is 9–10, and the molecular weight is ∼2800.4,5 Proanthocyanidins, a type of flavonoid comprising “flavan-3-alcohol” monomers, are the main component of larix bark tannin extracts, which have been widely used in the leather tanning industry.6,7 Although the average DP of proanthocyanidins in larix bark is 9–10, lower molecular weight polymers are also present and larix proanthocyanidins can be further classified as larix polymeric proanthocyanidins (LPPCs, DP ≥5) or larix oligomeric proanthocyanidins (LOPCs, DP <5). Because of their large molecular weight, LPPCs cannot easily penetrate biofilms, resulting in low biological activity and, consequently, low value. LOPCs, on the other hand, have strong biological activity. As well as showing strong anti-oxidant properties,8,9 LOPCs have been reported to protect retinal cells.10 suppress tumor growth,11 combat the damage done by inflammation,12 and protect against cardiovascular and cerebrovascular diseases.13 Because of their aromatic structure, proanthocyanidins strongly absorb UV light and have a good prospects for use in sunscreens.14 One study15 showed that the sun protection factor (SPF) of high-concentration proanthocyanidins from red raspberry seeds was much higher than that of commercially available sunscreens, confirming the potential of proanthocyanidins as natural ingredients for highly UV-blocking sunscreens.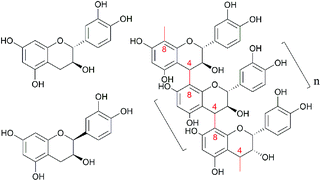 | ||
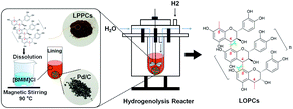
| Fig. 1 The molecular structure scheme of catechin, epicatechin and proanthocyanidins LPPCs, n ≥5; LOPC n <5. | ||
At present, the applications of cellulose and lignin in various fields have been reviewed,2,3,16–18 but due to the influence of polymerization degree on the activity, the application of proanthocyanidins is relatively less. So far, depolymerization of low-value LPPCs to produce high-value LOPCs and investigation of their UV-blocking properties thus has important practical significance for improving the range of application of proanthocyanidins. Depolymerization of LPPCs is typically achieved using chemical degradation,19 biodegradation,20 oxidation21,22 or hydrogenolysis.23 but all of these methods have drawbacks. Chemical degradation requires the use of acids, alkalis and other chemical reagents, which pose a potential risk to the environment. In biodegradation, which uses microbial or biological enzymes, the reaction conditions are strict, the reaction takes a long time, and the degree of depolymerization is uncertain. Oxidation typically uses light, electricity and heat to depolymerize proanthocyanidins into smaller molecules and generates CO2 and H2O. There are also many by-products, which makes it difficult to obtain pure LOPCs. Hydrogenolysis is commonly used to break C–C bonds in biological macromolecules and is one of the most important strategies for directional cleavage of C4–C8 (or C4–C6) bonds in proanthocyanidins. Under the right conditions, hydrogenolysis does not destroy the structure of polyphenols and selectively produces LOPCs with higher purity and better activity than other methods. Du et al.23 studied the catalytic hydrogenolysis of LPPCs in ethanol, using Pd/C as the catalyst, and Jiang et al.24 found that hydrogenolysis of LPPCs can be catalyzed by HP-2MGL resin.
So far, most catalytic hydrogenolysis reactions have been carried out in organic solvents. This limits the reaction temperature because organic solvents have a high vapor pressure and evaporate above a certain temperature. The environmental pollution caused by volatilization of organic matter is also a concern. In terms of resource recycling, environmental protection and realization of “green chemistry”,25 it is, therefore, important to identify non-volatile, stable, green solvents in which to carry out hydrogenolysis of LPPCs. Ionic liquids are salts that are liquids at temperatures below 100 °C and are usually composed of a combination of organic cations and organic/inorganic anions.26 Compared with organic solvents, ionic liquids, which are frequently referred to as “green” solvents,27 have excellent thermodynamic stability and low vapor pressures, with almost no volatilization. Ionic liquids are excellent solvents and reaction mediums for natural macromolecules. If the economic problem of solvent recovery is solved, the recovery of ionic liquid can have a positive impact on the environment. At present, ionic liquids are widely used as solvents for natural lignocellulose.28 Yang et al.29 prepared high-strength cellulose from corn straw using 1-butyl-3-methylimidazole chloride ([BMIM]Cl) as the solvent. [BMIM]Cl is a relatively common ionic liquid, which has been shown to be good solvent for the extraction of proanthocyanidins.30 Using [BMIM]Cl as the solvent for catalytic hydrogenolysis of LPPCs will provide a more thermodynamically stable environment for the reaction and will effectively achieve “zero emissions”, thus reducing environmental pollution. It will also expand the range of applications of ionic liquids as solvents for reactions involving natural macromolecules. In this study, LPPCs (DP = 13.19) and Larix bark natural oligomeric proanthocyanidins (NOPCs, DP = 4.65) were extracted from larix bark by solvent extraction. Then, the hydrogenolysis reaction was carried out under the catalyst we synthesized (Fig. 2). The method for synthesizing the catalyst is simple and green, and formaldehyde can gently reduce palladium to a reduced state, which is beneficial to catalyze the hydrogenolysis reaction. An orthogonal experimental design was used to determine the effects of reaction temperature, hydrogen pressure, reaction time and catalyst loading on the yield of hydrogenolysis products and to optimize the process conditions. The reaction products were characterized by UV-Vis and FTIR spectroscopy and gels permeation chromatography (GPC). The effects of adding LPPCs and LOPCs to skin creams or sunscreens was then evaluated, in terms of UV transmission, stability to UV light and sensory evaluation. This work not only broadens the scope of applications of “green” ionic liquids, but also provides a technical basis for the low-cost depolymerization, development and utilization of proanthocyanidins from larix barks.
2 Results and discussion
2.1 Determination of standard curves
Larix bark proanthocyanidins are macromolecular polymers comprising catechin (or epicatechin) monomers. The standard curves of Abs vs. catechin mass concentration and Abs vs. catechin molar concentration were, therefore, drawn using the Vanillin-HCl assay,31 with catechin as the standard. The regression equation of Abs and M was Abs = 4.83558 × 10⁻⁴M + 0.00676, with a correlation coefficient R2 = 0.999 by linear fitting of the obtained data. In a similar way, the linear regression equation of Abs and C was Abs = 6.45827 × C + 0.01176, with R2 = 0.999. Using this method, we determined the DP of LPPCs and NOPCs to be 13.19 and 4.65 respectively. In a previous report,5 the average DP of proanthocyanidins in larix bark was usually between 9 and 10. The difference is mainly due to removal of NOPCs in the process of extracting the LPPCs.2.2 Properties of Pd/C catalyst
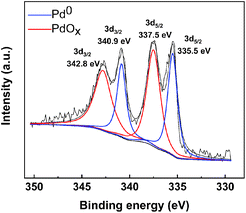
XPS analysis and characterization of the Pd/C catalyst can provide information about the elements on the surface of the catalyst and about the valence of the Pd. In Fig. 3, the binding energies of 335.5 eV and 340.9 eV correspond to Pd 3d5/2 and Pd 3d3/2, respectively, of the reduced state, Pd0. The binding energies of Pd0 is consistent with the reports in the literature.32 The difference is, the binding energies of 337.5 eV and 342.8 eV correspond to Pd 3d5/2 and Pd 3d3/2, respectively, of the oxidized state, PdOx. Since the catalyst prepared by this method has not been calcined, PdCx will not be produced. On the one hand, PdOx is due to the fact that Pd is not completely reduced in the preparation process; on the other hand, it is due to the fact that Pd is exposed to the air for too long after reduction. The XPS diagram reveals the presence of two valence states of elemental palladium, Pd(0) and Pd(2), on the surface of the activated carbon. Because of the excellent ability of metallic palladium to adsorb hydrogen,33 we speculate that Pd(0) plays a major role in the catalytic hydrogenolysis of proanthocyanidins. Therefore, the synthesis method of this catalyst is feasible and gentle.
2.3 Optimization by orthogonal experimental design
An orthogonal experimental design was adopted, with hydrogenolysis yield (φ) as the investigation index, and reaction time, reaction temperature, catalyst loading and hydrogen pressure as the four investigation factors. Five levels were designed for each factor, and an L25 (56) orthogonal experimental table (Table 1) was established. The experimental results were shown in Table 2.| Level | Factor | |||
|---|---|---|---|---|
| Reaction time, h | Reaction temperature, °C | Catalyst loading, g L−1 | Hydrogen pressure, MPa | |
| 1 | 1 | 70 | 2 | 1 |
| 2 | 1.5 | 80 | 3 | 2 |
| 3 | 2 | 90 | 4 | 2.5 |
| 4 | 3 | 110 | 5 | 3 |
| 5 | 4 | 130 | 6 | 4 |
| Project | Reaction time, h | Reaction temperature, °C | Catalyst loading, g L−1 | Hydrogen pressure, MPa | DP | φ, % |
|---|---|---|---|---|---|---|
| 1 | 1 | 130 | 5 | 1 | 9.02 | 31.61 |
| 2 | 1 | 110 | 6 | 3 | 7.23 | 45.19 |
| 3 | 1 | 90 | 2 | 2 | 8.84 | 32.98 |
| 4 | 1 | 80 | 3 | 4 | 10 | 24.18 |
| 5 | 1 | 70 | 4 | 2.5 | 8.48 | 35.71 |
| 6 | 1.5 | 130 | 4 | 3 | 8.45 | 35.94 |
| 7 | 1.5 | 110 | 5 | 2 | 9.16 | 30.55 |
| 8 | 1.5 | 90 | 6 | 4 | 7.3 | 44.66 |
| 9 | 1.5 | 80 | 2 | 2.5 | 7.43 | 43.67 |
| 10 | 1.5 | 70 | 3 | 1 | 8.37 | 36.54 |
| 11 | 2 | 130 | 3 | 2 | 10.66 | 19.18 |
| 12 | 2 | 110 | 4 | 4 | 8.35 | 36.69 |
| 13 | 2 | 90 | 5 | 2.5 | 3.98 | 69.83 |
| 14 | 2 | 80 | 6 | 1 | 9.46 | 28.28 |
| 15 | 2 | 70 | 2 | 3 | 10.31 | 21.84 |
| 16 | 3 | 130 | 2 | 4 | 8.45 | 35.94 |
| 17 | 3 | 110 | 3 | 2.5 | 9.6 | 27.22 |
| 18 | 3 | 90 | 4 | 1 | 9.4 | 28.73 |
| 19 | 3 | 80 | 5 | 3 | 9.72 | 26.31 |
| 20 | 3 | 70 | 6 | 2 | 8.2 | 37.83 |
| 21 | 4 | 130 | 6 | 2.5 | 10 | 24.18 |
| 22 | 4 | 110 | 2 | 1 | 10.44 | 20.85 |
| 23 | 4 | 90 | 3 | 3 | 6.87 | 47.92 |
| 24 | 4 | 80 | 4 | 2 | 8.37 | 36.54 |
| 25 | 4 | 70 | 5 | 4 | 10.9 | 17.36 |
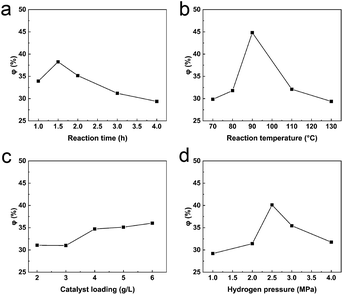
2.4 Influence of each factor on yield of hydrogenolysis
2.5 Significance and optimization of each factors
Using Pd/C as the catalyst, the optimal conditions for hydrogenolysis of LPPCs in the ionic liquid [BMIM]Cl were: reaction time, 1.5 h; reaction temperature, 90 °C; catalyst loading, 4 g L−1; and hydrogen pressure, 2.5 MPa. It is worth noting that the orthogonal experiment contains some errors, which will reduce the significance of each factor. As shown in the analysis results of Tables 2 and 3, it can be seen that the mutual influence of factors is very obvious. Firstly, the interval level selected for each factor needs to be expanded and, secondly, interactions between factors interfere with the experimental results and the interactions between factors needs to be further investigated.| Factor | DOF | Adj SS | Adj MS | F | P |
|---|---|---|---|---|---|
| Reaction time | 4 | 240 | 60.01 | 0.32 | 0.858 |
| Reaction temperature | 4 | 817 | 204.24 | 1.08 | 0.426 |
| Catalyst loading | 4 | 113.5 | 28.36 | 0.15 | 0.746 |
| Hydrogen pressure | 4 | 367 | 91.75 | 0.49 | 0.958 |
| Error | 8 | 1507.9 | 188.49 | ||
| SUM | 24 | 3045.4 |
2.6 Structural characterization of proanthocyanidins
2.7 Ultraviolet blocking by proanthocyanidins
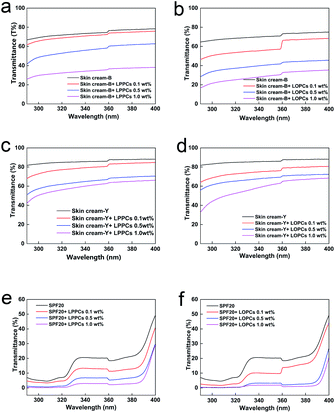
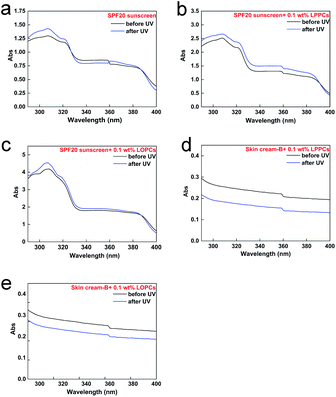
The synergistic effect of proanthocyanidins with sunscreen (Fig. 9e and f), may be due to π–π* superposition of aromatic rings in the proanthocyanidins with aromatic rings in the sunscreen. Addition of either LPPCs or LOPCs to sunscreen thus reduces transmission of UV light and enhances protection. At the same concentration, LOPCs enhanced the performance of the sunscreen more than LPPCs.
3 Conclusion
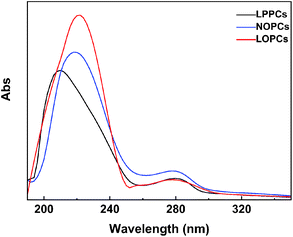
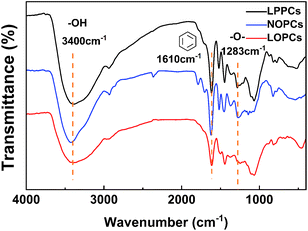
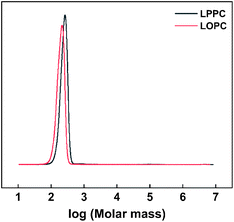
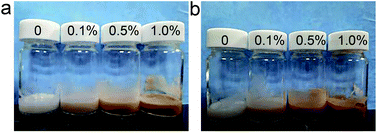
In this work, we used Pd/C as the catalyst to hydrogenolyze LPPCs in a non-organic solvent, the ionic liquid [BMIM]Cl. An orthogonal experimental design was used to optimize the conditions for the hydrogenolysis reactions. The best conditions were found to be: temperature, 90 °C; reaction time, 1.5 h; catalyst loading 4 g L−1 (Pd/C: [BMIM]Cl); and hydrogen pressure, 2.5 MPa. ANOVA showed that the significance of the interactions between different experimental factors needs further investigation. UV-Vis and IR spectroscopy, together with GPC analysis, showed that the LOPCs produced during the hydrogenolysis reaction retained the structural characteristics of proanthocyanidins. Compared with reaction in traditional organic solvents, reaction in the ionic liquid achieves direct hydrogenolysis of LPPCs. Because the ionic liquid is also stable and non-volatile, it causes less environmental pollution than organic solutions and provides a sustainable alternative for hydrogenolysis of LPPCs.To demonstrate potential applications of the proanthocyanidins, we added LPPCs and LOPCs to both skin cream and sunscreen. The UV transmittance of skin cream with added proanthocyanidins was lower than that of pure skin cream, confirming the ability of proanthocyanidins to block UV light. LOPCs provided a better UV barrier than LPPCs at the same concentration. Addition of proanthocyanidins to a shop-bought sunscreen also improved sun protection, with UV absorbance increasing with increasing UV radiation time. The specific mechanisms underlying the improved performance, however, need further study and clarification. One potential downside of adding proanthocyanidins to cosmetic products is that the products take on a brown color, which may be unattractive to consumers. To achieve better acceptance, it may be necessary to develop methods for decolorizing proanthocyanidins.
This study provides a new solvent for the study of directed depolymerization of proanthocyanidins, and also provides a commercially relevant example of the benefits of using ionic liquids, which are safe, sustainable and easy to recycle, for reactions of biomolecules. We have also explored value-added applications of proanthocyanidins and showed that they are good UV-blockers, with great potential for use in sunscreens and other products in which protection from the harmful effects of UV light is needed.
4 Experimental
4.1 Materials and reagents
Larix bark was crushed to a powder with particle diameter 0.5–1.0 mm as raw material. Catechin was purchased from Beijing Kool Chemical Co, Ltd. 1-Butyl-3-methylimidazole chloride ([BMIM]Cl) was purchased from Shanghai Chengjie Chemical Co, Ltd. PdCl2, vanillin, ferric chloride, ethanol, silver nitrate, PdCl2 and catechin were purchased from Tianjin Mesco Chemical Co, Ltd. Methanol, ethanol, petroleum ether, ethyl acetate, silver nitrate, catechin, vanillin, formaldehyde (37–40%) and acetic acid were purchased from Tianjin Tianli chemical reagent Co, Ltd. Hydrochloric acid (36–38wt%), nitric acid, sodium hydroxide and hydrogen peroxide were purchased from Tianjin Kemiou Chemical Regent Co, Ltd. acetic acid, methanol, ferric chloride, 1-butyl-3-methylimidazole chloride ([BMIM]Cl) and all of the above reagents are analytically pure. Methanol (chromatographically pure) was purchased from Tianjin Tianli chemical reagent Co, Ltd. Potassium bromide (spectral pure) was purchased from Tianjin Kemiou Chemical Reagent Co, Ltd. Marketed cosmetics, skin cream-B (produced by a company in Suzhou), skin cream-Y (produced by a company in Tianjin), and SPF20 sunscreen (SPF20), were purchased from supermarket in Harbin.4.2 Preparation of LPPCs
Larix bark proanthocyanidins were extracted using the ethanol extraction method, as previously described.234.3 Characterization of proanthocyanidins
| DP = M/(C × Mr) | (1) |
4.4 Preparation of Pd/C catalyst
The catalyst was prepared as previously described.33 Activated carbon (AC, 20–40 mesh, 6.0 g) was placed in a 250 mL round bottom flask, soaked in 12% hydrochloric acid solution, boiled at 50 °C for 10 h, washed until free from Cl− ions and then dried. The pre-treated AC was mixed with 12% nitric acid and refluxed at 80 °C for 3 h. After washing, the newly formed AC-HNO3 was dried. AC-HNO3 was immersed in H2O2 (5 M, completely covered), refluxed for 5 h, washed and dried at 110 °C to provide AC-HNO3-H2O2. PdCl2 (0.4743 g), water (15 mL) and concentrated hydrochloric acid (3 mL) were heated until the PdCl2 was fully dissolved. The solution was then added dropwise with stirring to the AC-HNO3-H2O2 at 80 °C in a water bath. The pH was adjusted to 10 and the reaction mixture was kept at 90 °C for 2 h. Formaldehyde solution (37–40%, 10 mL) was added and the reaction mixture was aged for 30 h. The resulting Pd/C catalyst was removed by suction filtration, washed and dried.4.5 Characterization of Pd/C catalyst
X-ray photoelectron spectroscopy. X-ray photoelectron spectroscopy (XPS) of the Pd/C catalyst was performed using a K-Alpha X-ray photoelectron spectrometer (Thermo Fisher Scientific, Inc., USA), under the following conditions: Ag 3D, 5/2 resolution, half peak width 0.85 eV, binding energy range 0–1350 eV, Al target, X-ray maximum values of 12 kV and 30 mA.![[thin space (1/6-em)]](https://www.rsc.org/images/entities/char_2009.gif) :
:![[thin space (1/6-em)]](https://www.rsc.org/images/entities/char_2009.gif) 100, w/v). The solution, together with an aliquot of the Pd/C catalyst, was placed in a hydrogenolysis reactor. Hydrogen was then fed into the reactor and the reaction temperature was set. Once the set temperature was reached, the reactor agitator was started and the reaction was stirred at a rotational speed of 500 rad min−1. At the end of the reaction, the reaction mixture was taken out of the reactor and the solid catalyst Pd/C was removed by filtration to provide an ionic liquid solution of the product. Transformed this solution (1 mL) in 10 mL volumetric flask, then diluted with methanol to volume and determined DP according to (1) the efficiency of the hydrogenolysis of the proanthocyanidins was evaluated using the yield (φ) of desired products. The DP of the product was determined and φ was calculated using (2).
100, w/v). The solution, together with an aliquot of the Pd/C catalyst, was placed in a hydrogenolysis reactor. Hydrogen was then fed into the reactor and the reaction temperature was set. Once the set temperature was reached, the reactor agitator was started and the reaction was stirred at a rotational speed of 500 rad min−1. At the end of the reaction, the reaction mixture was taken out of the reactor and the solid catalyst Pd/C was removed by filtration to provide an ionic liquid solution of the product. Transformed this solution (1 mL) in 10 mL volumetric flask, then diluted with methanol to volume and determined DP according to (1) the efficiency of the hydrogenolysis of the proanthocyanidins was evaluated using the yield (φ) of desired products. The DP of the product was determined and φ was calculated using (2).| Φ = (DP0 − DP1)/DP0 × 100% | (2) |
4.6 Sun protection testing of proanthocyanidins
![[thin space (1/6-em)]](https://www.rsc.org/images/entities/char_2009.gif) 000 rpm for 1 h. If there was no precipitate after centrifugation, the proanthocyanidins were fully soluble in the skin cream and sunscreen. Skin creams and sunscreens containing different concentrations of proanthocyanidins were spread evenly on clean quartz glass (40 × 40 × 1 mm3) and then dried in a dark room for 20 min. The UV transmittance (T%) was measured using a TU-1950 UV spectrophotometer, equipped with a solid sample holder. Each scan was from UVB (290–320 nm) to UVA (320–400 nm).
000 rpm for 1 h. If there was no precipitate after centrifugation, the proanthocyanidins were fully soluble in the skin cream and sunscreen. Skin creams and sunscreens containing different concentrations of proanthocyanidins were spread evenly on clean quartz glass (40 × 40 × 1 mm3) and then dried in a dark room for 20 min. The UV transmittance (T%) was measured using a TU-1950 UV spectrophotometer, equipped with a solid sample holder. Each scan was from UVB (290–320 nm) to UVA (320–400 nm).Conflicts of interest
There are no conflicts to declare.Acknowledgements
This work was supported by the National Undergraduate Training Programs for Innovations (201910225069) and the Natural Science Foundation of Hei-longjiang Province of China (Grant No. LH2019C009).Notes and references
- L. An, C. Si, G. Wang, W. Sui and Z. Tao, Ind. Crops Prod., 2019, 128, 177–185 CrossRef CAS.
- X. Li, R. Xu, J. Yang, S. Nie, D. Liu, Y. Liu and C. Si, Ind. Crops Prod., 2019, 130, 184–197 CrossRef CAS.
- H. Liu, T. Xu, K. Liu, M. Zhang, W. Liu, H. Li, H. Du and C. Si, Ind. Crops Prod., 2021, 165, 113425 CrossRef CAS.
- R. T. Neto, S. A. O. Santos, J. Oliveira and A. J. D. Silvestre, Ind. Crops Prod., 2020, 151, 112450 CrossRef CAS.
- L. Ni, F. Zhao, B. Li, T. Wei, H. Guan and S. Ren, Molecules, 2018, 23, 2445 CrossRef PubMed.
- E. E. Bayramoğlu, Ind. Crops Prod., 2013, 41, 53–56 CrossRef.
- B. Teng, J. Wu, Y. Wang and W. Chen, Pol. J. Environ. Stud., 2017, 26, 2249–2257 CrossRef CAS.
- I. Ben El Hadj Ali, R. Bahri, M. Chaouachi, M. Boussaïd and F. Harzallah-Skhiri, Ind. Crops Prod., 2014, 62, 188–195 CrossRef CAS.
- N. Diwani, J. Fakhfakh, K. Athmouni, D. Belhaj, A. El Feki, N. Allouche, H. Ayadi and H. Bouaziz-Ketata, Ind. Crops Prod., 2020, 144, 112040 CrossRef CAS.
- L. Linlin, G. Xing, T. Lili, W. Dabo and W. Qin, Arch. Pharmacal Res., 2020, 43, 1056–1066 CrossRef PubMed.
- T. Shusuke, R. Preethi, G. Jinghua, C. Jacob, Y. Madelaine and G. Ajay, Sci. Rep., 2018, 8, 1–13 Search PubMed.
- C. Chen, P. Somavat, V. Singh and E. Gonzalez de Mejia, Ind. Crops Prod., 2017, 109, 464–475 CrossRef CAS.
- M. J. Kruger, N. Davies, K. H. Myburgh and S. Lecour, Food Res. Int., 2014, 59, 41–52 CrossRef CAS.
- J. Song, S. Chen, X. Zhao, J. Cheng, Y. Ma, S. Ren and S. Li, RSC Adv., 2021, 11, 6374–6382 RSC.
- T. Jiao, Y. Lu, L. Ye, J. Yao, Y. Zhuang, Y. Huang, M. Zhao, C. Lu and J. Li, J. Chin. Inst. Food Sci. Technol., 2019, 19, 98–105 Search PubMed.
- H. Du, W. Liu, M. Zhang, C. Si, X. Zhang and B. Li, Carbohydr. Polym., 2019, 209, 130–144 CrossRef CAS PubMed.
- K. Liu, H. Du, T. Zheng, H. Liu, M. Zhang, R. Zhang, H. Li, H. Xie, X. Zhang, M. Ma and C. Si, Carbohydr. Polym., 2021, 259, 117740 CrossRef CAS PubMed.
- W. Liu, H. Du, M. Zhang, K. Liu, H. Liu, H. Xie, X. Zhang and C. Si, ACS Sustainable Chem. Eng., 2020, 8, 7536–7562 CrossRef CAS.
- H. Suo, R. Tian, J. Li, S. Zhang, Y. Cui, L. Li and B. Sun, Food Res. Int., 2019, 123, 440–449 CrossRef CAS PubMed.
- S. Deprez, C. Brezillon, S. Rabot, C. Philippe, I. Mila, C. Lapierre and A. Scalbert, J. Nutr., 2000, 130, 2733–2738 CrossRef CAS PubMed.
- J. Lee, Food Chem., 2010, 123, 51–56 CrossRef CAS.
- E. M. Jorgensen, A. B. Marin and J. A. Kennedy, J. Agric. Food Chem., 2004, 52, 2292–2296 CrossRef CAS PubMed.
- D. U. Xiao, L. U. Zhongbing, T. A. O. Yi, L. Xuepin and S. H. I. Bi, J. Sichuan Union Univ., Eng. Sci. Ed., 2005, 37, 65–70 Search PubMed.
- G. Q. Jiang, G. Z. Fang, L. L. Li, Z. X. Shi and Z. R. Zhang, Bioresources, 2014, 9, 662–672 CAS.
- H. C. Erythropel, J. B. Zimmerman, T. M. de Winter, L. Petitjean, F. Melnikov, C. H. Lam, A. W. Lounsbury, K. E. Mellor, N. Z. Janković, Q. Tu, L. N. Pincus, M. M. Falinski, W. Shi, P. Coish, D. L. Plata and P. T. Anastas, Green Chem., 2018, 20, 1929–1961 RSC.
- X. Meng, R. Zhang, H. Liu, X. Zhang, Z. Liu, C. Xu and A. A. Klusener Peter, Sci. Sin.: Chim., 2018, 48, 387–396 Search PubMed.
- C. J. Clarke, W. C. Tu, O. Levers, A. Brohl and J. P. Hallett, Chem. Rev., 2018, 118, 747–800 CrossRef CAS PubMed.
- C. G. Yoo, Y. Pu and A. J. Ragauskas, Current Opinion in Green and Sustainable Chemistry, 2017, 5, 5–11 CrossRef.
- J. Yang, X. Lu, Y. Zhang, J. Xu, Y. Yang and Q. Zhou, Green Energy Environ., 2020, 5, 223–231 CrossRef.
- L. Ran, C. Yang, M. Xu, Z. Yi, D. Ren and L. Yi, Sep. Purif. Technol., 2019, 226, 154–161 CrossRef CAS.
- C. Li, S. Xu and Z. Wang, Food Sci., 2004, 25, 157–161 CAS.
- M. Brun, A. Berthet and J. C. Bertolini, J. Electron Spectrosc. Relat. Phenom., 1999, 104, 55–60 CrossRef CAS.
- L. Liu, S. Zhang and G. Fang, Chem. Ind. For. Prod., 2014, 34, 13–20 Search PubMed.
- L.-Z. Lin and J. M. Harnly, J. Agric. Food Chem., 2012, 60, 5832–5840 CrossRef CAS PubMed.
- S. Luo, X. Zhang, X. Zhang and L. Zhang, Nat. Prod. Res., 2014, 28, 1116–1120 CrossRef CAS PubMed.
| This journal is © The Royal Society of Chemistry 2021 |

