 Open Access Article
Selecting a stable solid form of remdesivir using microcrystal electron diffraction and crystal structure prediction†
Sivakumar Sekharan‡
 *a,
Xuetao Liu‡b,
Zhuocen Yangb,
Xiang Liub,
Li Dengb,
Shigang Ruanb,
Yuriy Abramova,
GuangXu Sunb,
Sizhu Lib,
Tian Zhoub,
Baime Shib,
Qun Zengb,
Qiao Zengb,
Chao Changb,
Yingdi Jinb and
Xuekun Shib
aXtalPi Inc., 245 Main St, Floor 11, Cambridge, MA 02142, USA. E-mail: sivakumar.sekharan@xtalpi.com
bJingtai Technology Co. Ltd, Floor 4, No. 9, Yifenghua Industrial Zone, 91 Huaning Road, Longhua District, Shenzhen, Guangdong Province 518109, China
First published on 12th May 2021
Abstract
Therapeutic options in response to the coronavirus disease 2019 (COVID-19) outbreak are urgently needed. In this communication, we demonstrate how to support selection of a stable solid form of an antiviral drug remdesivir in quick time using the microcrystal electron diffraction (MicroED) technique and a cloud-based and artificial intelligence implemented crystal structure prediction platform. We present the MicroED structures of remdesivir forms II and IV and conclude that form II is more stable than form IV at ambient temperature in agreement with experimental observations. The combined experimental and theoretical study can serve as a template for formulation scientists in the pharmaceutical industry.
Coronaviruses are named for the crown-like spikes on their surface. There are four main sub-groupings of coronaviruses, known as alpha, beta, gamma, and delta. Human coronaviruses were first identified in the mid-1960s. The seven coronaviruses that can infect people are: alpha coronavirus (229E, NL63), beta coronavirus (OC43, HKU1), MERS-CoV (the beta coronavirus that causes middle east respiratory syndrome, or MERS), SARS-CoV (the beta coronavirus that causes severe acute respiratory syndrome, or SARS), and SARS-CoV-2 (the novel coronavirus that causes coronavirus disease 2019, or COVID-19). Sometimes coronaviruses that infect animals can evolve and make people sick and become a new human coronavirus. Three recent examples of this are 2019-nCoV, SARS-CoV, and MERS-CoV.1–3
Currently, the United States Food and Drug Administration (FDA) has approved the antiviral drug Veklury (remdesivir) and also issued the emergency use authorization for the Pfizer-BioNTech and Moderna vaccines for the prevention of COVID-19 caused by SARS-CoV-2 in the U.S. Remdesivir is an investigational nucleotide analog, one of the oldest classes of antiviral drugs, with broad-spectrum antiviral activity both in vitro and in vivo in animal models against multiple emerging viral pathogens, including ebola, marburg, MERS and SARS.4
De-risking the solid form selection of antiviral drugs early in the development stage is of the utmost importance to minimize the cost and timeline and ensure its success as viable drug candidate. The importance of selecting a thermodynamically stable form5 has been illustrated before in the case of ritonavir,6 rotigotine,7 and ranitidine hydrochloride.8 Recently, crystal structure prediction (CSP) methods have emerged from basic science to applied technology to play a crucial role in the solid form selection of active pharmaceutical ingredients (API).9–12
Conventional experimental methods to investigate crystal polymorphism include X-ray diffraction analysis such as single crystal X-ray diffraction (SCXRD) and X-ray powder diffraction (XRPD), as well as thermal analysis, and spectroscopy methods.13 SCXRD is a non-destructive method and gold standard for structure characterization but is time consuming due to requirement of single crystal samples to be dozens of microns in size, which is sometimes impossible to achieve. XRPD is more commonly used as a quick and low-cost method to identify polymorphs, but it is not sufficient to solve the crystal structure due to lack of 3-dimensional (3D) information. Microcrystal electron diffraction (MicroED) technique complements these two methods as it not only provides 3-D information but also requires samples to be just a crystalline powder. Since these three methods are all based on the diffraction of crystal structures, their results can be cross validated.
Thermal analysis such as differential scanning calorimetry, differential thermal analysis (DSC), and thermogravimetric analysis are widely accepted as regular methods to measure the thermal behavior of the crystalline samples under program-controlled temperature. They can be used to detect the physical transformation like evaporation or melting as well as chemical reactions with high accuracy of temperature or heat. Thus, properties of the sample, such as polymorph phases, metastable states, and purity, can be studied. For instance, DSC analysis can be used to detect the existence of possible crystal phases because the inflection points, peaks or valleys of the heat flow versus temperature curve correspond to phase transitions. The results of thermal analysis, e.g., the number of stable polymorph phases, can qualitatively be compared with CSP. Unfortunately, thermal analysis cannot quantitatively be cross validated, because CSP gives relatively accurate energies in thermal equilibrium but not accurate dynamic response to the change of temperature. Spectroscopic techniques like infrared, Raman, and solid-state NMR provide information like 2D structures and components of a crystal, which can be used as input for CSP calculations.
Here we demonstrate how to support selection of a stable solid form of an antiviral drug remdesivir in quick time using the MicroED14,15 and a cloud-based and artificial intelligence implemented CSP platform.16 We choose to study remdesivir, because it is the first and only antiviral drug approved by FDA for COVID-19 treatment.
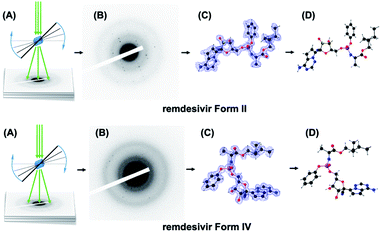
In the absence of crystal structures, we first chose to determine the crystal structures of remdesivir forms II and IV using MicroED (Scheme 1). Diffraction data were collected from ten individual remdesivir form II crystals, with each covering ∼30° of the reciprocal space. The resolution was truncated to 0.900 Å to remove the diffractions with low signal-to-noise ratio. The merged data set has 11![[thin space (1/6-em)]](https://www.rsc.org/images/entities/char_2009.gif) 574 total diffractions and 3562 unique diffractions with data completeness of 91% and Rint value of 0.2297. The observed 2/m Laue symmetry of the diffraction intensities shows the remdesivir form II crystal belongs to monoclinic crystal system. The unit-cell constants are averaged to be a = 10.21(4) Å, b = 12.49(14) Å, c = 10.85(10) Å, α = 90°, β = 100.9(6)°, γ = 90° with the P21 space group. The values of these unit-cell constants are inherently different from the values of the unit-cell constants obtained from single-crystal XRD and XRPD leading to discrepancy in the peak positions between the experimental and theoretical XRPD patterns.17
574 total diffractions and 3562 unique diffractions with data completeness of 91% and Rint value of 0.2297. The observed 2/m Laue symmetry of the diffraction intensities shows the remdesivir form II crystal belongs to monoclinic crystal system. The unit-cell constants are averaged to be a = 10.21(4) Å, b = 12.49(14) Å, c = 10.85(10) Å, α = 90°, β = 100.9(6)°, γ = 90° with the P21 space group. The values of these unit-cell constants are inherently different from the values of the unit-cell constants obtained from single-crystal XRD and XRPD leading to discrepancy in the peak positions between the experimental and theoretical XRPD patterns.17
The remdesivir form II structure model with space group P21 was determined by using SHELXT.18 All non-H atoms were found successfully in the initial model from the structure solution. Due to limited electron diffraction, the absolute structure of the remdesivir form II crystal was determined with the prior knowledge of the absolute configuration of the sample molecule.19,20 The structure model was refined with SHELXL by using the electron scattering factors.21 The R1 value for all diffractions (R1 = 0.1609) is significantly higher than the common R1 values in single-crystal XRD structure refinement but is usual in MicroED structure refinement.22 This is caused by the dynamic-diffraction nature of electron diffraction where the electrons are scattered multiple times in crystal and the relation between the intensities of diffractions and the structure factors (I = |F|2) is broken.23,24 This dynamic behavior of MicroED does not hinder the correct structure solution but causes a poor refinement result, e.g. high R1 and wR2 values.
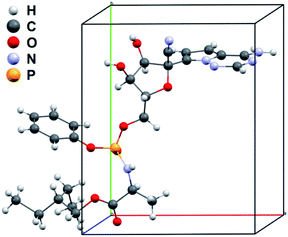
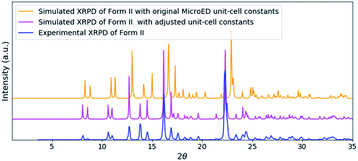
To validate the solved structure of remdesivir form II [Fig. 1], a simulated XRPD pattern was calculated with the obtained model and compared to the experimental pattern. By indexing the experimental XRPD pattern, the unit-cell constants of remdesivir form II were found to be: a = 10.51(4) Å, b = 12.88(14) Å, c = 11.24(10) Å, α = 90°, β = 100.7(6)°, γ = 90°. By adjusting the unit-cell constants of the structure model obtained from MicroED into these values, the simulated XRPD pattern of the adjusted structure is well matched with the experimental pattern [Fig. 2].
The same approach has been applied to the sample of remdesivir form IV. It is observed that remdesivir form IV crystals are more vulnerable to radiation damage compared to the form II crystals, so the diffraction data are collected within ∼20° of reciprocal space and the final data set was merged from data sets of 25 different crystals. The resolution was truncated to 0.955 Å to remove the diffractions with low signal-to-noise ratio. The merged data set has 19![[thin space (1/6-em)]](https://www.rsc.org/images/entities/char_2009.gif) 547 total diffractions and 3133 unique diffractions, of which the completeness is 96% and the Rint value is 0.4016.
547 total diffractions and 3133 unique diffractions, of which the completeness is 96% and the Rint value is 0.4016.
The observed 2/m Laue symmetry of the diffraction intensities shows the remdesivir form IV crystal also belongs to the monoclinic crystal system. The unit-cell constants are averaged to be a = 10.03(7) Å, b = 12.20(20) Å, c = 11.44 (18) Å, α = 90°, β = 104.4(7)°, γ = 90° with the P21 space group. After refinement with SHELXL, the R1 value for all reflections was refined to 0.2347. More crystallographic data and refinement parameters of forms II and IV are listed in Tables S1 and S2.†
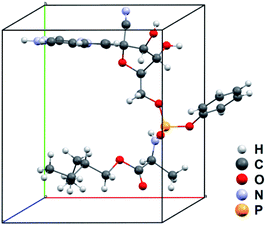
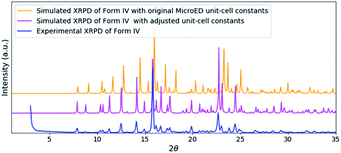
The solved structure of remdesivir form IV [Fig. 3] and a comparison of experimental XRPD pattern of remdesivir form IV and the simulated XRPD pattern of the structure models obtained from MicroED [Fig. 4] are presented. Similar to the case of form II, a global shift of peak positions can be seen due to the different unit-cell constants under different experimental conditions. The pattern can be well matched by adjusting the unit-cell constants into: a = 10.35(7) Å, b = 12.50(20) Å, c = 11.52(18) Å, α = 90°, β = 103.7(7)°, γ = 90°.
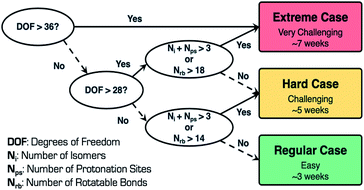
In general, when performing CSP calculations, we use a decision tree to classify the complexity of the system into three categories, regular, hard, and extreme [Fig. 5]. To perform this classification, we use three different variables, namely, degrees of freedom (DOF), number of isomers (Ni), and number of protonation sites (Nps). DOF depends on the number of rotatable bonds (Nrb), number of flexible ring(s) torsions, and Z prime (Z′), which is the number of formula units in the asymmetric unit. These variables are good descriptors in predicting the difficulty of the CSP calculations, which, in turn, is indicative of the time taken to execute these calculations. The workflow has been successfully applied to perform virtual polymorph screening of many mono- and multicomponent (cocrystals, salts, hydrates and solvates) systems with Z′ ≤ 4 and DOF ≤ 48.25–29
Remdesivir is composed of 77 atoms (molecular formula: C27H35N6O8P, molecular weight: 602.585 mg mol−1), and consists of 16 rotatable bonds, five hydrogen bond donors, 13 hydrogen bond acceptors, five chiral centers, one flexible ring, and two pyramidal nitrogen atoms, respectively. The total number of DOF is 28 and the presence of two lowest energy conformations as starting conformations in conjunction with Z′ = 1 search space adopted for CSP calculations places remdesivir in the hard (challenging) category with a timeline of approximately five weeks to complete the CSP calculations. To retain the absolute configuration of remdesivir, the calculations were carried out in 11 Sohncke space groups, P212121, P21, C2, P1, P21212, P41, P43, C2221, P31, P32 and P65, which cover more than 97% of all chiral crystals in the Cambridge Structural Database.30
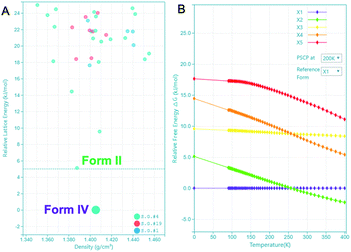
The highly accurate and robust CSP platform allows for an efficient generation of up to a billion of crystal polymorphs, and prediction of a crystal structure landscape and relative stabilities of polymorphs up to 400 K.27 The CSP energy landscape of remdesivir at 0 K [Fig. 6A], where each dot is a predicted polymorph in a specific space group. Each polymorph is ranked based on their lattice energy and density using the high precision DFT-D, optPBE-vdW, level of theory as implemented in the VASP software package.31,32 The relative stability of a selected subset of low energy polymorphs is calculated using free energy molecular dynamics simulations for a temperature range of 0 to 400 K [Fig. 6B]. Generally, to identify the experimental structures in the CSP landscape, we calculate XRDs of the predicted structures and compare them with the experimental XRDs for validation. If there is an experimental single crystal structure available, then we also overlay the predicted crystal structure with the experimental structure and measure their similarity with RMSD15 calculations.
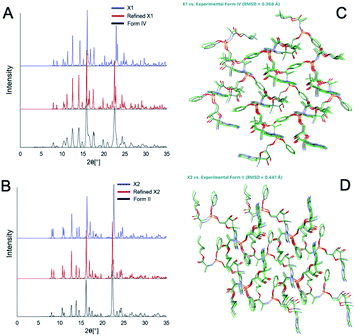
There are 35 crystal polymorphs predicted in the remdesivir landscape with 22 belonging to P21, eight to P212121 and five to P1 space groups. Only three crystal polymorphs (X1, X2, X3) belonging to the P21 space group are found within a relative lattice energy gap of 10 kJ mol−1. The comparison between predicted and observed XRPD patterns [Fig. 7A and B], as well as RMSD15 structural overlays [Fig. 7C and D] show that X1 and X2 are the experimental structures corresponding to form IV (RMSD = 0.368 Å) and form II (RMSD = 0.441 Å), respectively. Compared to X1, the most dramatic stabilization is observed for X2, which decreases in energy by almost 5 kJ mol−1 to become more stable than X1 at ambient temperature in agreement with experimental observations.33 However, the energy difference between X1 and X2 at 300 K is 0.76 kJ mol−1, which is within the estimated uncertainty of 1.5 kJ mol−1 for CSP calculations.27,34,35 Therefore, it is difficult to pick the stable form between the two polymorphs based only on the CSP results. The free energy calculations confirm that there is no missing unknown stable form. Therefore, the final selection of a stable solid form of remdesivir should rely on the competitive slurry experiments between polymorphs II and IV.9,33 This way the calculations support form II (X2) as the stable solid form of remdesivir.
In summary, researchers are currently working around the clock to discover novel antiviral drugs for treating the COVID-19 disease, and trials are being initiated at record speed. A collective global effort and resources from the government, academia, charities, pharmaceutical industry are needed to tackle this disease. We have demonstrated that a combined experimental and theoretical approach can successfully support selection of a stable solid form of an antiviral drug in quick time (just 33 days) when traditional solid-state polymorph screening experiments could take several weeks or months to complete.
Author contributions
X. L. designed experiments. X. L., X. L., L. D., performed MicroED experiments and analyzed data. S. R. performed crystallization experiments. Z. Y., G. S., S. L., Y. J. and X. S. designed CSP calculations. Z. Y., T. Z., B. S., Q. Z., Q. Z., and C. C. performed CSP calculations. Z. Y., Y. A. and S. S. analyzed data. S. S. wrote the paper.Conflicts of interest
There are no conflicts to declare.Acknowledgements
The authors acknowledge South China Advanced Institute for Soft Matter Science and Technology at the South China University of Technology for providing TEM facility.Notes and references
- L. van der Hoek, Antiviral Ther., 2007, 12, 651–658 CAS.
- K. Pyrc, B. Berkhout and L. van der Hoek, Expert Rev. Anti-Infect. Ther., 2007, 5, 245–253 CrossRef CAS PubMed.
- J. H. Beigel, N. H. Nam, P. L. Adams, A. Krafft, W. L. Ince, S. S. El-Kamary and A. C. Sims, Antiviral Res., 2019, 167, 45–67 CrossRef CAS PubMed.
- E. P. Tchesnokov, J. Y. Feng, D. P. Porter and M. Götte, Viruses, 2019, 11, 326 CrossRef CAS PubMed.
- Y. A. Abramov, P. Zhang, Q. Zeng, M. Yang, Y. Liu and S. Sekharan, Cryst. Growth Des., 2020, 20, 1512–1525 CrossRef CAS.
- R. Barbas, F. Marti, R. Prohens and C. Puigjaner, Cryst. Growth Des., 2006, 6, 1463–1467 CrossRef CAS.
- K. R. Chaudhuri, Expert Opin. Drug Delivery, 2008, 5, 1169–1171 CrossRef CAS PubMed.
- M. Mirmehrabi, S. Rohani, K. S. K. Murthy and B. Radatus, J. Cryst. Growth, 2004, 260, 517–526 CrossRef CAS.
- Y. A. Abramov, Org. Process Res. Dev., 2013, 17, 472–485 CrossRef CAS.
- L. F. Huang and W. Q. Tong, Adv. Drug Delivery Rev., 2004, 56, 321–334 CrossRef CAS PubMed.
- S. Byrn, R. Pfeiffer, M. Ganey, C. Hoiberg and G. Poochikian, Pharm. Res., 1995, 12, 945–954 CrossRef CAS PubMed.
- D.-K. Bučar, R. W. Lancaster and J. Bernstein, Angew. Chem., Int. Ed., 2015, 54, 6972–6993 CrossRef PubMed.
- A. Bhatia, S. Chopra, K. Nagpal, P. K. Deb, M. Tekade, and R. K. Tekade, in Dosage Form Design Parameters, Academic Press, 2018, pp. 31–65 Search PubMed.
- B. L. Nannenga and T. Gonen, Emerging Top. Life Sci., 2018, 2, 1–8 CrossRef CAS PubMed.
- M. W. Martynowcyz and T. Gonen, Curr. Opin. Colloid Interface Sci., 2018, 34, 9–16 CrossRef PubMed.
- P. Zhang, G. P. F. Wood, J. Ma, M. Yang, Y. Liu, G. Sun, Y. Jiang, B. C. Hancock and S. Wen, Cryst. Growth Des., 2018, 18, 6891–6900 CrossRef CAS.
- Y. Wang, T. Yang, H. Xu, X. Zou and W. Wan, J. Appl. Crystallogr., 2018, 51, 1094–1101 CrossRef CAS.
- G. Sheldrick, Acta Crystallogr., Sect. A: Found. Adv., 2015, 71, 3–8 CrossRef PubMed.
- E. Danelius, S. Halaby, W. A. van der Donk and T. Gonen, Nat. Prod. Rep., 2021, 38, 423–431 RSC.
- P. Brázda, L. Palatinus and M. Babor, Science, 2019, 364, 667–669 CrossRef PubMed.
- L.-M. Peng, G. Ren, S. L. Dudarev and M. J. Whelan, Acta Crystallogr., 1996, 52, 257–276 CrossRef.
- B. L. Nannenga and T. Gonen, Nat. Methods, 2019, 16, 369–379 CrossRef CAS.
- L. Palatinus, V. Petricek and C. A. Correa, Acta Crystallogr., Sect. A: Found. Adv., 2015, 71, 235–244 CrossRef CAS PubMed.
- M. Gemmi and A. E. Lanza, Acta Crystallogr., Sect. B: Struct. Sci., Cryst. Eng. Mater., 2019, 75, 495–504 CrossRef CAS PubMed.
- Y. A. Abramov, G. Sun, Y. Zhou, M. Yang, Q. Zeng and Z. Shen, Cryst. Growth Des., 2019, 19, 7132–7137 CrossRef CAS.
- G. Sun, Y. Jin, S. Li, Z. Yang, B. Shi, C. Chang and Y. A. Abramov, Cryst. Growth Des., 2020, 11, 8832–8838 CAS.
- M. Yang, E. C. Dybeck, G. Sun, C. Peng, B. Samas, V. M. Burger, Q. Zeng, Y. Jin, M. A. Bellucci, Y. Liu, J. Ma, A. Jiang, B. C. Hancock, S. Wen and G. P. F. Wood, Cryst. Growth Des., 2020, 20, 5211–5224 CrossRef CAS.
- G. Sun, Y. Jin, S. Li, Z. Yang, B. Shi, C. Chang and Y. A. Abramov, J. Phys. Chem. Lett., 2020, 11, 8832–8838 CrossRef CAS PubMed.
- G. Sun, X. Liu, Y. A. Abramov, S. O. Nilsson Lill, C. Chang, V. Burger and A. Broo, Cryst. Growth Des., 2021, 21, 1972–1983 CrossRef CAS.
- C. R. Groom, I. J. Bruno, M. P. Lightfoot and S. C. Ward, Acta Crystallogr., Sect. B: Struct. Sci., Cryst. Eng. Mater., 2016, 72, 171–179 CrossRef CAS.
- G. Kresse and J. Furthmüller, Phys. Rev. B: Condens. Matter Mater. Phys., 1996, 54, 11169–11186 CrossRef CAS PubMed.
- J. Hafner, J. Comput. Chem., 2008, 29, 2044–2078 CrossRef CAS PubMed.
- K. Brak, E. A. Carra, L. V. Heumann and N. Larson, US Pat., 2018/0346504 A1, December 6, 2018 Search PubMed.
- E. C. Dybeck, N. P. Scheiber and M. R. Shirts, J. Chem. Theory Comput., 2016, 12, 3491–3505 CrossRef CAS PubMed.
- E. C. Dybeck, N. S. Abraham, N. P. Scheiber and M. R. Shirts, Cryst. Growth Des., 2017, 17, 1775–1787 CrossRef CAS.
Footnotes |
| † Electronic supplementary information (ESI) available. CCDC 2061565, 2061566, 2061567 and 2061568. For ESI and crystallographic data in CIF or other electronic format see DOI: 10.1039/d1ra03100g |
| ‡ These authors contributed equally. |
| This journal is © The Royal Society of Chemistry 2021 |

