
 Open Access Article
 This Open Access Article is licensed under a Creative Commons Attribution-Non Commercial 3.0 Unported Licence
New dinuclear zinc(II) complexes with Schiff bases obtained from o-phenylenediamine and their application as fluorescent materials in spin coating deposition†
Magdalena Barwiolek *a,
Dominika Jankowskaa,
Mateusz Chorobinskib,
Anna Kaczmarek-Kędzieraa,
Iwona Łakomskaa,
Slawomir Wojtulewskic and
Tadeusz M. Muzioła
*a,
Dominika Jankowskaa,
Mateusz Chorobinskib,
Anna Kaczmarek-Kędzieraa,
Iwona Łakomskaa,
Slawomir Wojtulewskic and
Tadeusz M. Muzioła
aFaculty of Chemistry, Nicolaus Copernicus University in Torun, 87-100 Torun, Poland. E-mail: mbarwiolek@umk.pl; dominikajankowska@doktorant.umk.pl; teoadk@chem.umk.pl; iwolak@umk.pl; tadeuszmuziol@wp.pl
bInstitute of Mathematics and Physics, UTP University of Science and Technology, 85-796 Bydgoszcz, Poland. E-mail: matcho005@utp.edu.pl
cFaculty of Chemistry, University of Białystok, Ciolkowskiego 1K, Białystok, 15-245, Poland. E-mail: slawoj@uwb.edu.pl
First published on 13th July 2021
Abstract
Two Zn(II) complexes, K1 and K2, obtained from the template reaction of zinc(II) acetate dihydrate with o-phenylenediamine and 2-hydroxy-5-methylisophthalaldehyde (K1) or 2-hydroxy-5-tert-butyl-1,3-benzenedicarboxaldehyde (K2), respectively, were characterized by X-ray crystallography, spectroscopic (UV-vis, fluorescence and IR), and thermal methods. In the complex [Zn2(MeO)1.4(OH)0.6(L1)]·2H2O K1, there are two binding sites in the macrocyclic ligand and they are occupied by zinc(II) cations found in slightly distorted square pyramidal environment. The zinc(II) cations are connected by slightly asymmetric oxo bridges with a Zn1–O14–Zn1[−x, −y + 1, −z + 1] angle of 104.8(2)°. In the dimer [Zn2(CH3COO)2(L2)]·2EtOH K2, there are two crystallographically independent binding sites both occupied by zinc(II) cations. There is a significant difference between both complexes, since in K1 only one site is independent and the second is occupied due to the application of symmetry rules, and the geometry of both sites is identical. Thin layers of the obtained Zn(II) complexes were deposited on Si(111) by the spin coating method and studied by scanning electron microscopy (SEM/EDS), atomic force microscopy (AFM), fluorescence spectroscopy and ellipsometry. In the non-absorbing range, the value of the refractive index exhibits normal dispersion between 1.8 and 2.1 for K1_1–K1_3; and between 2.3 and 2.6 for the K2 series of samples established for long wavelengths (longer than 500 nm). The Zn(II) complexes and their thin layers exhibited fluorescence between 534–573 nm and 495–572 nm for the compounds and the layers, respectively. The highest quantum yield of fluorescence was achieved for K2 in benzene and in the solid state ϕ = 0.78 and 0.58, respectively. The influence of the solvent polarity on the fluorescence properties of the obtained complexes was studied. Additionally, DFT calculations were performed to explain the structures and electronic spectral properties of the complexes.
Introduction
The synthesis and development of new emitters for organic light emitting diodes (OLED) is one of the most important problems of modern materials science.The luminescent complexes represent an important class of luminescent materials because they possess both organic dyes (tunable and intense emission) and transition-metal-based emitters (high photostability and large Stokes shifts).1–4
The metal complexes with Schiff bases can be used as organic layers in OLEDs and other emissive organic devices since they can exhibit luminescence and they are energy efficient.5–9
The polynuclear metal complexes with Schiff base ligands, shown strong fluorescence, are low cost, can exhibit good thermal and morphological stability, easy color tuning and were applied by material chemists as emissive materials, which makes them a subject of interest for scientists.5,10 Especially Zn(II) complexes bearing salicylaldiminato ligands have been employed as blue, greenish white and red emitters in organic optoelectronics presenting higher stability and efficiency.11 Zinc precursors are cheaper than platinum or iridium salts, which can lead to cheap emitters. Moreover, zinc complexes may have good electron transporting capability.12 It is also known, that the d10 configuration of the zinc(II) cation results of the occurrence only MLCT, LMCT or π → π* ligand based transitions regarding the spectroscopy and photochemistry of zinc(II) compounds.13–17 Moreover, the type of an amine used22 and significance of the first coordination sphere of the central atom are responsible for the emission properties of the isolated compounds.18,19 Therefore the main factor, which allows to control the luminescence properties of complexes can be design of the Schiff bases part of the complexes. The relatively easy synthesis, and the possibility of using various amines and substituents placed at the salicylaldehyde rings make the polynuclear salicylaldehyde derivatives Schiff bases complexes as the promising electroluminescent materials.6 It was also noted that the several Zn(II) with Schiff base complexes are weak or non-emissive in the solution, but, they emit efficiently in the solid state. The enhancement in the luminescence properties in solid state was observed. It is important to find a new group of complexes, which will be emissive in the solution, and, what is even more important from the point of view of the latter applications, in the solid state.
Additionally, the transition metal complexes with Schiff bases form thin films, and some, which exhibited luminescence were also used in optoelectronic devices.5,18,20–22 Thin films can be obtained by a wide range of methods, from wet to gaseous ones, e.g. chemical vapor deposition, Langmuir Blodgett, or spin and dip coating.5,23–26 Apart from the low cost of the synthesized compounds also the low cost and fast deposition methods are looking for. As far as we know spin coating can be used as a technique which allows for the fast deposition of the thin luminescence films, so we chose this method as the most sufficient to get the desired materials.
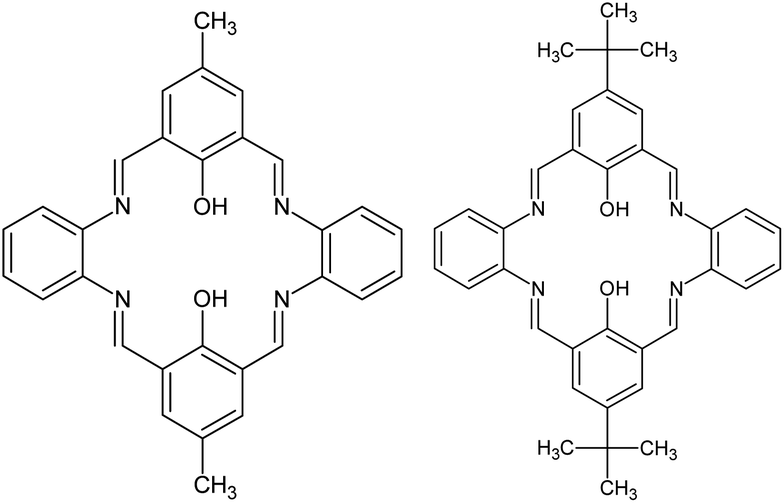
In the present work we report the template synthesis of the two new binuclear Zn(II) complexes obtained in the reaction of zinc(II) acetate dihydrate with o-phenylenediamine and 2-hydroxy-5-methylisophthalaldehyde K1 or 2-hydroxy-5-tert-butyl-1,3-benzenedicarboxaldehyde K2 (Fig. 1).
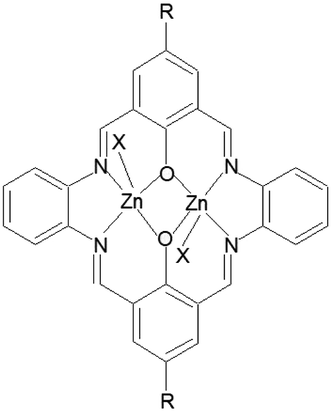 | ||
| Fig. 1 Structural formula for K1 and K2, X = OCH3, R = CH3 (K1) or X = CH3COO; R = tBu (K2). | ||
In addition, the influence of substituents in the organic ligands (and other ligands present in the coordination sphere of the zinc complexes) on the structural formation of Zn(II) Schiff bases complexes, and the way they affect the optical properties, were investigated. DFT calculations were carried out to support the interpretation of the results concerning the optical properties of the studied complexes. The new emissive zinc(II) complexes were used as precursors for thin layers in the spin coating technique. The morphology of the layers was analyzed by AFM and SEM microscopy, ellipsometry; the fluorescence properties of the films were also studied. With insightful molecular design the bis-Zn(II)–salen complexes can exhibit high emission with high quantum yields. This research should give some significant clues for bis-Zn(II)–salen complexes as emitters.
Materials and methods
2-Hydroxy-5-methylisophthalaldehyde (97%), o-phenylenediamine (analytical grade), and 2-hydroxy-5-tert-butyl-1,3-benzenedicarboxaldehyde (97%), were purchased from Aldrich and used without further purification. Zinc(II) acetate dihydrate (analytical grade), was supplied by POCH (Gliwice Poland).Methods and instrumentation
1H, 13C, 13C{1H} hmqc and hmbc NMR spectra of the K2 samples were recorded on a Bruker Avance III 700 MHz or a Bruker Avance 500 MHz spectrometer for K1 samples in CDCl3. UV-vis absorption spectra were recorded on a Hitachi spectrophotometer in CH3CN, MeOH, chloroform or benzene (1 × 10⁻⁴ M) solutions. The fluorescence spectra were recorded on a spectrofluorometer Gildenpλotonics 700 in the range 900–200 nm (grating 1, bandpass 4 or 8, integration time 100 ms, MeCN, chloroform, methanol and benzene solutions of compounds the same as in the case of the UV-vis studies or silicon slides). The elemental analysis was carried out using a Vario EL III Elemental analyzer. The thermal analysis (TG, DTG, DTA) was performed on an SDT 2960 TA analyzer under air, heating rate 10 °C min−1, and heating range up to 1000 °C. The residue of the sample after combustion was analyzed by an XRD analysis performed with a Philips X'Pert equipped with a X'Celerator Scientific detector. The IR spectra were recorded on a Spectrum 2000 Perkin/Elmer FT IR using KBr discs in the range 400–4000 cm−1.Layers of the complexes were deposited on Si(111) wafers (10 nm × 10 mm) ∼500 nm thick using the spin coating technique. Precursors were dissolved in acetonitrile and deposited on Si using a spin coater (Laurell 650 SZ). PMMA (poly(methyl-2-methylpropenoate)) or PS (polystyrene) were used to improve adhesion to the silicon surface. The spin speed was varied from 1500 rpm to 3000 rpm, the coating time was 5 or 10 s. The morphology and composition of the obtained films were analyzed with a scanning electron microscope (SEM), LEO Electron Microscopy Ltd, England, the 21430 VP model equipped with secondary electrons (SE) detectors and an energy dispersive X-ray spectrometer (EDX) Quantax with a XFlash 4010 detector (Bruker AXS microanalysis GmbH). The layers morphology was also studied using SEM/FIB (scanning electron microscope/focused ion beam) Quanta 3D FEG equipped with gold and palladium splutter SC7620. The atomic force microscopy (AFM) images were performed in the tapping mode with a Multi Mode Nano Scope IIIa (Veeco Digital Instrument) microscope. The V-VASE device from J.A. Woollam Co., Inc. was used to record ellipsometric Ψ and Δ azimuths. The Ψ and Δ quantities were measured for three angles of incidence (65°, 70° and 75°) in the spectral range from 0.62 eV to 6.5 eV (191–2000 nm).
Crystallography
The diffraction data of the studied compounds were collected for the single crystal at 100 K on BL14.2 beamline (Helmholtz Zentrum Berlin, Bessy II) operating at λ = 0.7999 Å for K1, and on Oxford Diffraction SuperNova DualSource diffractometer with monochromated Cu Kα X-ray source (λ = 1.54184 Å) for K2. For K1, a preliminary data reduction and space group determination was performed with the xdsapp27,28 software, and subsequently, the numerical absorption correction was applied in CrysAlis Pro.29 Both structures were solved by direct methods and refined with the full-matrix least-squares procedure on F2 (SHELX-97 (ref. 30)). All the heavy atoms were refined with anisotropic displacement parameters. Hydrogen atoms were located at calculated positions with the thermal displacement parameters fixed to a value of 20% or 50% higher than those of the corresponding carbon atoms. Hydrogen atoms attached to nitrogen and oxygen atoms were found from the difference electron density synthesis. In K1, O21 and O22 water molecules were found with partial occupancy (0.5), and O21 molecule is located very closely to the inversion centre. In this final model, hydrogen atoms from O22 water molecule are missing. In K1 to assure stable refinement, geometrical restraints (DFIX and DANG) were applied for O21 water molecule and thermal displacement parameters of O17 methanolate were restrained. All the figures were prepared in DIAMOND31 and ORTEP-3.32 The results of the data collections and refinement are summarized in Table S1.†CCDC 2046260 and 2047049 contain the supplementary crystallographic data for K1 and K2, respectively.†
Computational details
Theoretical calculations were performed for the crystal structures of K1 and K2. The absorption spectra for all the systems were calculated in vacuum and in solvents (acetonitrile, methanol and chloroform) described within the polarizable continuum model in the linear response formalism. For the vertical absorption, the PBE0/6-311++G(d,p) approach was applied. In the main text of the manuscript, only the graphical representation of the UV results are given. The complete numerical data for a vacuum and acetonitrile including the wavelengths and oscillator strengths, together with the corresponding molecular orbitals involved in the most intensive transitions, are available in ESI.† All the calculations were carried out in the Gaussian 16 program.33Ellipsometry
The ellipsometric Ψ and Δ azimuths were measured for three angles of incidence (65°, 70° and 75°) by means of the V-VASE device (J.A. Woollam Co., Inc) in the spectral range from 0.62 eV to 6.5 eV (191–2000 nm).The fit procedure was performed using the WASE32 software (J. A. Woollam Co., Inc.).34
Experimental
Synthesis of complexes
The obtained product has thermochromic properties and changes its color from orange to red under the influence of increased temperature.
1H [ppm]: 2.29 (s, 6H) (H1), CH3, 8.84 (m, 4H) –N![[double bond, length as m-dash]](https://www.rsc.org/images/entities/char_e001.gif) CH–, 7.37–7.41 (m, 4H) Ar-H (9), 7.72 (m, 4H) Ar-H (8), 7.99 (m, 4H) Ar-H (3), 3.45 (m, 6H) OCH3 (Fig. 2). Selected FT-IR (data reflectance, crystal) (cm−1), 3024, 2920 νC–HAr, 1614 νCN, 1530 νCCHA, 1479, 1382 νCCAr, 1326 νC–NHA, 1309 νPh–O. UV-vis (MeCN, 1 × 10⁻⁴ mol dm−3): λ/nm 324 (ε/dm3 mol−1 cm−1 1430), 418 (1240), 588 (500), (chloroform, 1 × 10⁻⁴ mol dm−3): λ/nm 245 (ε/dm3 mol−1 cm−1 13
CH–, 7.37–7.41 (m, 4H) Ar-H (9), 7.72 (m, 4H) Ar-H (8), 7.99 (m, 4H) Ar-H (3), 3.45 (m, 6H) OCH3 (Fig. 2). Selected FT-IR (data reflectance, crystal) (cm−1), 3024, 2920 νC–HAr, 1614 νCN, 1530 νCCHA, 1479, 1382 νCCAr, 1326 νC–NHA, 1309 νPh–O. UV-vis (MeCN, 1 × 10⁻⁴ mol dm−3): λ/nm 324 (ε/dm3 mol−1 cm−1 1430), 418 (1240), 588 (500), (chloroform, 1 × 10⁻⁴ mol dm−3): λ/nm 245 (ε/dm3 mol−1 cm−1 13![[thin space (1/6-em)]](https://www.rsc.org/images/entities/char_2009.gif) 710), 295 (20210), 360 (10210), 425 (10210), 585 (1010), (MeOH, 1 × 10⁻⁴ mol dm−3): λ/nm 328 (ε/dm3 mol−1 cm−1 4270), 408 (3720), 584 (510), (benzene, 1 × 10⁻⁴ mol dm−3): λ/nm 336 (ε/dm3 mol−1 cm−1 600), 586 (510); UV-vis solid state: λ/nm 272, 328, 410, 510.
710), 295 (20210), 360 (10210), 425 (10210), 585 (1010), (MeOH, 1 × 10⁻⁴ mol dm−3): λ/nm 328 (ε/dm3 mol−1 cm−1 4270), 408 (3720), 584 (510), (benzene, 1 × 10⁻⁴ mol dm−3): λ/nm 336 (ε/dm3 mol−1 cm−1 600), 586 (510); UV-vis solid state: λ/nm 272, 328, 410, 510.
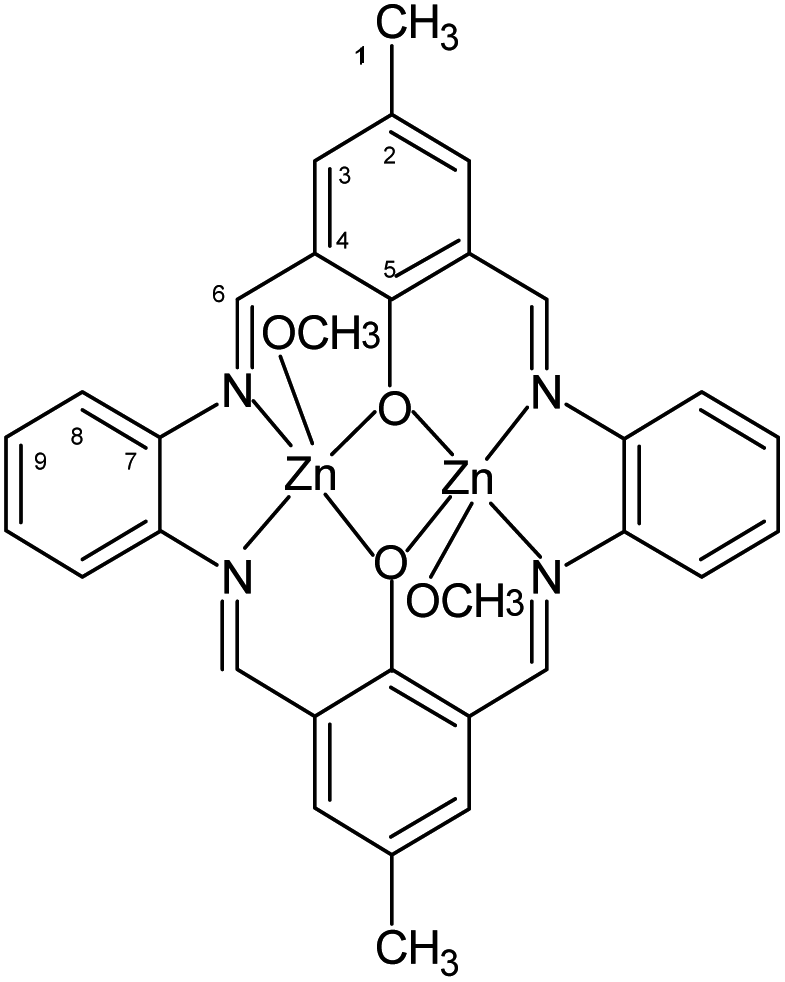 | ||
| Fig. 2 Structural formula and atomic numbering scheme for K1. | ||
The obtained product has thermochromic properties and changes its color from yellow to orange under the influence of increased temperature.
1H [ppm]: 1.40 (s, 9H) (H1) CH3, 8.98 (s, 4H) –NCH–, 7.44–7.46 (dd, 4H, J = 11,3 Hz) Ar-H (10), 7.67 (d, 4H, J = 4.8 Hz) Ar-H (9), 7.82–7.83 (dd, 4H, J = 8.7 Hz) Ar-H (4), 13C{1H} [ppm]: 31.39 (C1), 34.05 (C2), 116.32 (C5), 122.97 (C10), 128.75 (C9), 137.30 (C4), 138.81 (C8), 139.92 (C3), 159.87 (C6), 166.99 (C7) (Fig. 3). Selected FT-IR (data reflectance, crystal) (cm−1), 2949 νC–HAr, 1606 νCN, 1525 νCCHA, 1475, 1392 νCCAr, 1332 νC–NHA, 1310 νPh–O. UV-vis (MeCN, 1 × 10⁻⁴ mol dm−3): λ/nm 290 (ε/dm3 mol−1 cm−1 17700), 414 (6320), 588 (70), (chloroform, 1 × 10⁻⁴ mol dm−3): λ/nm 290 (ε/dm3 mol−1 cm−1 23510), 340 (118020), 420 (19450), 585 (100) (MeOH, 1 × 10⁻⁴ mol dm−3): λ/nm 310 (ε/dm3 mol−1 cm−1 11690), 414 (7710), 436 (6420), 436 (6420), 586 (110), (benzene, 1 × 10⁻⁴ mol dm−3): λ/nm 302 (ε/dm3 mol−1 cm−1 7070), 424 (5040), 588 (450). UV-vis solid state: λ/nm 270, 394, 487.
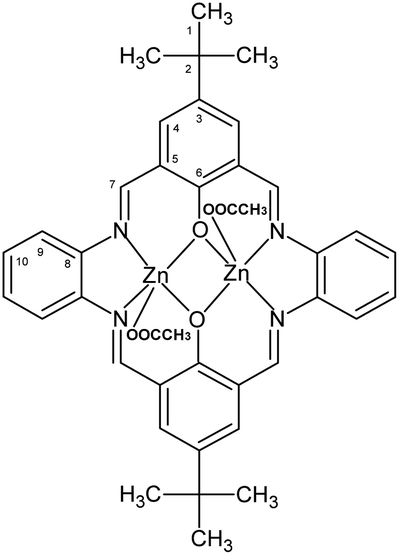 | ||
| Fig. 3 Structural formula and atomic numbering scheme for K2. | ||
Results and discussion
Di-nuclear zinc(II) complexes: synthesis and characterization
The template synthesis of the corresponding aldehyde and primary amine with zinc(II) acetate dihydrate in the molar ratio 1:1:1, resulted in the formation of di-nuclear zinc(II) complexes. 1H, 13C, 13C{1H} NMR spectra of the complexes show that the symmetry is consistent with the formation of binuclear complexes of the tetra-imine ligands, and unlike the situation in the solid state for complex K2, in solution the two Zn sites are equivalent (Fig. S1–S3†). The IR spectra exhibited the –CN– stretching bands, characteristic for the Schiff bases (Fig. S4 and S5†). The elemental analysis and X-ray studies confirmed the purity of the obtained compounds.
The TGA shows that complexes are stable up to 505 °C (K1) and 513 °C (K2). The final decomposition product was zinc oxide which was confirmed by XRD analysis (Fig. S6–S9†).
Crystal structure description
![[1 with combining macron]](https://www.rsc.org/images/entities/char_0031_0304.gif) space group, with half of the formula given in the asymmetric unit (Fig. 4). Hence, it consists of one zinc(II) cation, half of the macrocyclic Schiff base, and one water molecule split over two positions with 0.5 occupancy. The charge is balanced by positionally disordered MeO−/OH− anions with occupancies 0.7/0.3. All these atoms are found in general positions.
space group, with half of the formula given in the asymmetric unit (Fig. 4). Hence, it consists of one zinc(II) cation, half of the macrocyclic Schiff base, and one water molecule split over two positions with 0.5 occupancy. The charge is balanced by positionally disordered MeO−/OH− anions with occupancies 0.7/0.3. All these atoms are found in general positions.
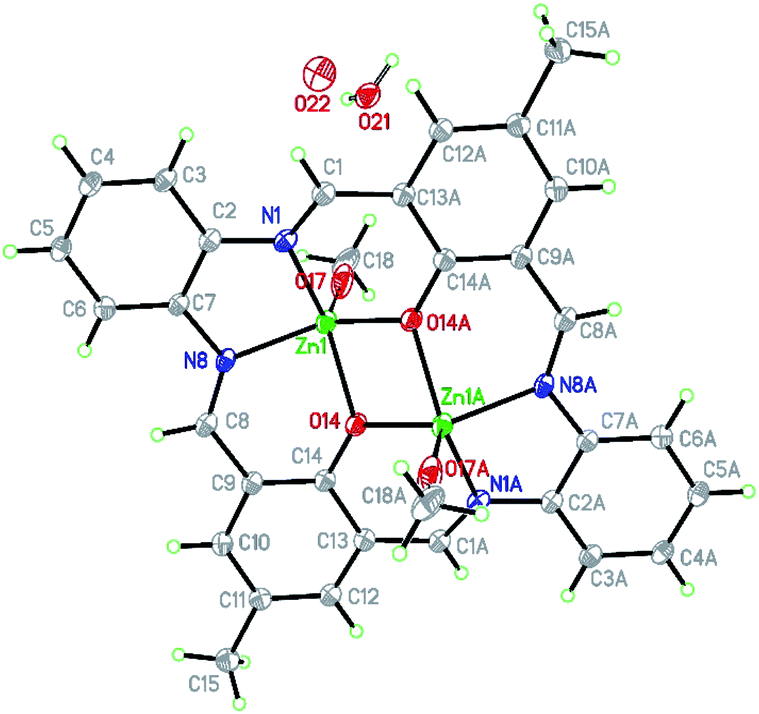 | ||
| Fig. 4 Structure of [Zn2(MeO)1.4(OH)0.6(L1)]·2H2O K1 with a numbering scheme and thermal ellipsoids at 30% probability. | ||
There are two binding sites in this macrocyclic ligand (Fig. 5) and in the reported structure, both occupied by zinc(II) cations found in a slightly distorted square pyramidal environment (τ5 = 0.092 (ref. 35)).
 | ||
| Fig. 5 Structural formula scheme for L1 and L2. | ||
The coordination sphere consists of two oxygen atoms (2.014(5) and 2.029(5) Å) from deprotonated hydroxyl groups and two nitrogen atoms (2.075(5) and 2.059(6) Å) with bond angles ranging from 75.1(2) to 85.4(2) and 131.3(2) to 136.9(2)°. The apical position is occupied by the O17 (2.022(9) Å) atom from the methanolate anion forming an angle from 110.5(3) to 116.4(3)° with the basal atoms (Table S2†) or semi-coordinating O19 hydroxyl group in the minor population.
Similar bonds were found for [Zn2(L)(OAc)2]·2CHCl3 (Zn–O: 2.010 to 2.035, Zn–N: 2.046 and 2.058 Å).36 The observed deformation of the square pyramid results from a shift of Zn1 atom by 0.796(2) Å from the basal plane towards the apical position. In K1, the square pyramids of both zinc(II) share the common edge (O14–O14[−x, −y + 1, −z + 1]), and their basal planes are ideally coplanar (Fig. S10†). The zinc(II) cations are connected by slightly asymmetric oxo bridges with Zn1–O14–Zn1[−x, −y + 1, −z + 1] angle being 104.8(2)°. The Zn–Zn distance inside the dimer is 3.203 Å and significantly shorter than any other intermetallic distances (Zn–Zn[−x, 2 − y, 1 − z] 6.472 and Zn–Zn[−1 − x, 2 − y, 1 − z] 7.891 Å). They are similar to the values reported elsewhere.36,37
In the crystal network, there are ab layers composed of dimers and separated by water molecules of crystallization (Fig. 6). In the layer, π–π interactions dominate due to the structure of the macrocyclic ligand, forcing all the aromatic rings to adopt a coplanar orientation (Fig. S11†). These stacking interactions are formed between C2 and C14[−x, 2 − y, 1 − z], C2 and C14[−1 − x, 2 − y, 1 − z] as well as C2 and C2[−1 − x, 2 − y, 1 − z] of phenyl rings. They form either the 2.7° angle or, in the latter case, 0.0° with a moderate shift (1.506 Å) between both rings involved. In addition, weak van der Waals interactions occur mainly due to the position of the C18 methyl group pointing towards an adjacent dimer macrocyclic ligand. The Hirshfeld surface analysis performed in Crystal Explorer38 showed that weak H⋯H and H⋯C contacts form the vast majority of interactions (including also the shortest, Fig. S12†). The full hydrogen bonds cannot be discussed since hydrogen atoms are missing in the final model for the O22 water molecule. Hence, only one C15–H15B⋯O22[−x, 2 − y, 1 − z] hydrogen bond between the C15 methyl group and the water of crystallization, assures that interactions between the adjacent layers were detected.
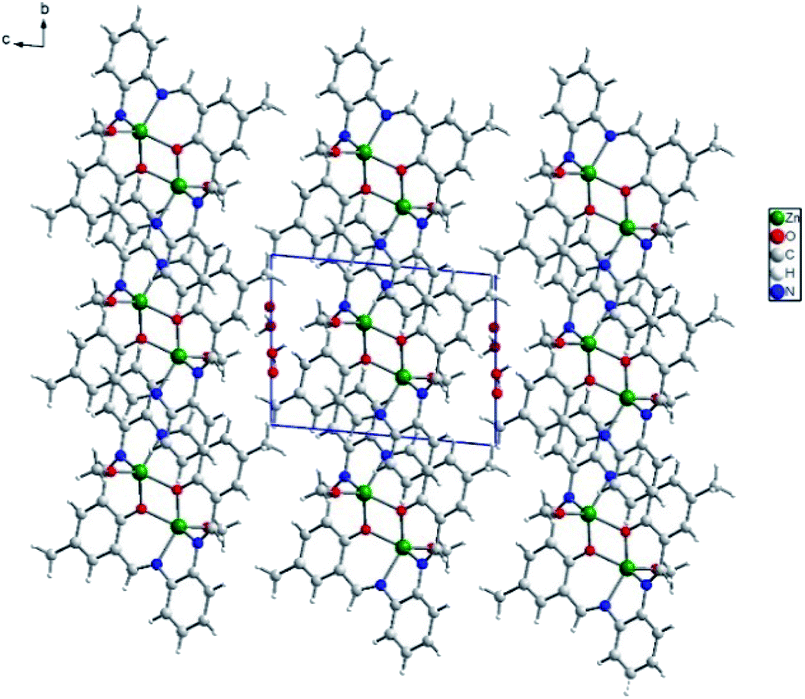 | ||
| Fig. 6 Packing of K1 along a axis shows ab layers of dimers separated by partially occupying crystallization water molecules. | ||
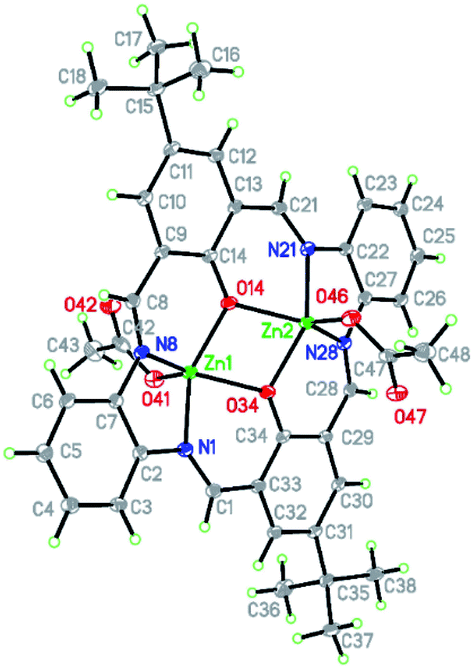 | ||
| Fig. 7 Structure of [Zn2(CH3COO)2(L2)]·2EtOH K2 with a numbering scheme and thermal ellipsoids at 30% probability. | ||
Contrary to K1 in K2, there are two crystallographically independent binding sites, both occupied by zinc(II) cations. In K2, both the zinc(II) cations are found in pentacoordinated environment with τ values being 0.037 and 0.085 for Zn1 and Zn2, respectively, indicating a slightly distorted square pyramidal coordination sphere. They consist of two nitrogen atoms and two oxygen atoms from the macrocyclic ring and apical oxygen atom from the acetate anions. In both the coordination spheres, Zn–O bonds (1.9925(18)–2.0384(17) Å for Zn1 and 1.9944(18)–2.0368(17) Å for Zn2) are shorter than Zn–N (2.048(2)–2.069(2) Å for Zn1 and 2.0506(19)–2.072(2) Å for Zn2) bonds. The shortest bonds are created by the apical oxygen atoms (1.9482(18) and 1.9516(18) Å for Zn1 and Zn2, respectively) (Table S3†). These distances are very similar to those in K1 apart from the apical ligand which formed the longest bonds in K1. It should be noted that there is a very similar structure given by the formula [Zn2(L2′)(CH3COO)2]·2EtOH (FOVGAZ27,39) but with significantly elongated Zn–N bonds (2.100(5) and 2.104(5) Å). In K2 the angles in the basal planes range from 75.28(7)–86.80(7) and 133.81(8)–136.03(8)° for Zn1 and from 75.28(7)–86.44(8) and 132.07(8)–137.16(8)° for Zn2, with the smallest value corresponding to the O14–Zn–O34 angle. The apical ligand forms angles from 105.63(8) to 117.55(8)° and 108.68(8) to 117.23(8)° for O41 and O46, respectively. Both Zn1–O–Zn2 bridges (104.76(8) and 104.63(8)° for O14 and O34, respectively) between two zinc(II) cations are slightly asymmetric with a distance difference of 0.04 Å.
In the reported structure, both the Zn(II) ions are shifted by 0.778(1) and −0.784(1) Å from the basal plane toward the apical ligand, indicating that both square pyramids share a common edge, but apical ligands point in opposite directions. The conformational analysis (Table S4†) shows also the similarity between both complexes. Hence, we can conclude that the geometry of the macrocycle depends on its type, a number of involved atoms, and kind of bonds (these features are common in both complexes), whereas substituents and even packing seem to be of minor importance.
In K2, the rms deviation of the atoms involved in the macrocyclic ring formation is 0.076 Å, being slightly lower than the value observed in K1.
In packing, we observe ab layers composed of translationally repeating dimers (along the a axis) (Fig. 8). The shortest intermetallic distance was found inside the dimer (3.192 Å), with a value very similar to that for K1. It is much shorter than any other Zn–Zn contact created between adjacent macrocycles, e.g. 8.446–8.703 Å between the adjacent moieties, translated along the a axis with the π–π interactions created between slightly inclined (up to 10.6°) aromatic rings. Apart from that, these molecules interact via C–H⋯π forces between methyl groups and aromatic rings, and C–H⋯O/N hydrogen bonds between C–H groups from the macrocyclic ligand and oxygen atoms from the acetate anions, or the N8 nitrogen atom from the macrocycle (Fig. S13†). Interlayer interactions are maintained by C53–H53B⋯C29 phenyl ring interactions and hydrogen bonds between the two acetate anions (C48–H48A⋯O46[1 − x, 1 − y, 1 − z]), as well as an acetate and an ethanol molecule (C52–H52B⋯O41[1 − x, 1 − y, 2 − z]) (Fig. S14†). Acetate anions coordinated in the apical positions point toward adjacent layers and assure interlayer separation as well as interactions between them. The ethanol molecule located in the crystal network cavities, seems to be crucial for the stabilization of the framework. As mentioned, it significantly improved the quality of the crystal. Now, we can account for its impact. Ethanol is involved in several intralayer and interlayer hydrogen bonds. Apart from weak C–H⋯OEtOH hydrogen bonds, there are two strong OEtOH–H⋯Oacetate (O⋯O distances: 2.815 and 2.825 Å) interactions between linearly aligned atoms (red spots on Hirshfeld surface are related to those short interactions, Fig. S15†). Hence, we can conclude that there are significant differences in K1 and K2 networks because in K1 weak H⋯H and H⋯C interactions prevail (these contacts are the most frequent and the shortest), whereas in K2 also H⋯H are the most numerous but it seems that H⋯O interactions are very important as they form the shortest interactions – the hydrogen bonds.
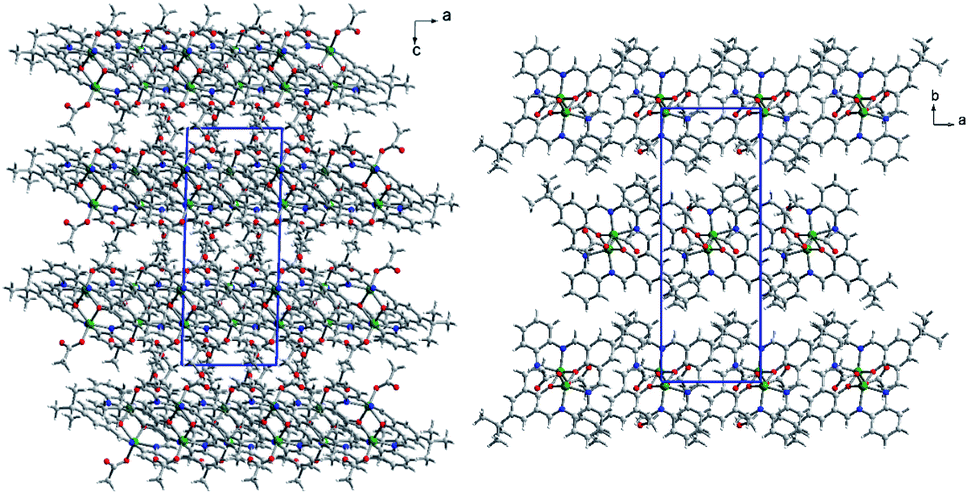 | ||
| Fig. 8 Packing of K2 shows ab layers with acetate anions pointing towards to the adjacent layer (left). Dimers creating the layer form the translationally repeating motif (right). Ethanol molecules are located in the crystal structure cavity. | ||
UV-vis and fluorescence spectroscopy
The UV-vis absorption and fluorescence spectra of the zinc(II) complexes, were recorded at room temperature in various solvents of different polarity, i.e. MeCN, chloroform, methanol and benzene (Fig. 9, Table S5†).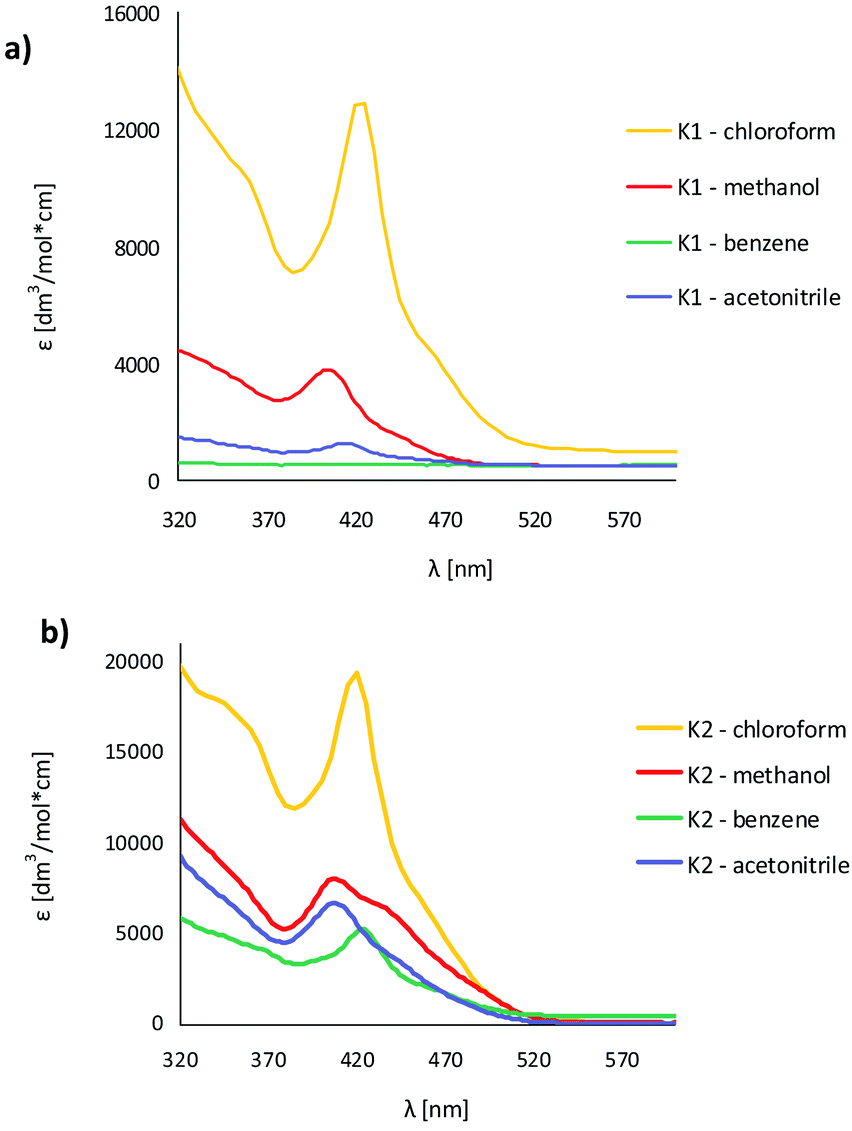 | ||
| Fig. 9 Solution absorption spectra of complexes (a) K1, (b) K2 in chloroform, acetonitrile, methanol and benzene (1 × 10⁻⁴ mol dm−3, RT). | ||
In the UV-vis spectra of the Zn(II) complexes, the bands in the range of 324–360 nm for K1 and 310–340 nm for K2 as a function of the solvent used, associated with the characteristic π → π* transitions in the –CN− group, were recorded (Fig. 9).24 The value of these shifts in the case of K1 and K2 decreases with the increasing solvent polarity (except for benzene). Between 408–425 nm in K1 and 414–436 nm in K2 spectra, the MLCT bands were registered.40 The solvent effect on the band position is minor, e.g., 8 nm in different solvents. The same was observed for from bis(4-aminophenyl) ether and 3-methoxysalicylaldehyde.43 In addition, the band associated with the metal to ligand charge transfer transition (MLCT d → π) recorded in the range 584–588 nm for the two complexes, K1 and K2, was observed.41 In the absorption spectra of the complexes in the solid state and their thin films, three group of bands were noted: 270–272 nm, 394–410 nm  and 487–510 nm (MLCT). The bathochromic shift of the absorbance bands, in comparison to the solution spectra, was observed. The influence of molecular packing in the solid phase on the optical properties, can therefore be concluded. This shift is the result of the larger rigidity of the complexes in the solid state, than in solution.
The computational estimation of the vertical absorption for K1 in acetonitrile, leads to the long wavelength maximum intensity signal at 407 nm (Fig. 10). The maximum absorption of K2 appears at 408 nm. The corresponding frontier orbitals determining the character of these transitions for both complexes, are depicted in Fig. S16 and S17.† The numerical values of the absorption wavelength, along with the oscillator strength, are given in Table S6.†
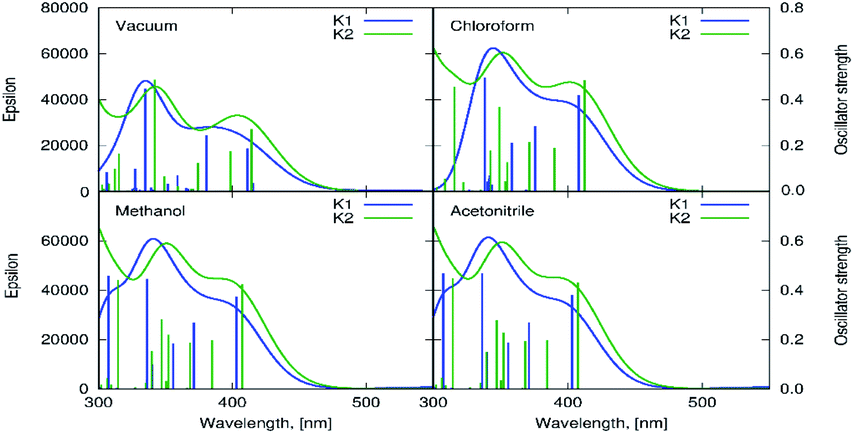 | ||
| Fig. 10 The theoretical estimation of the vertical absorption spectrum for K1 and K2 obtained with the PBE0/6–311++G(d,p) approach in vacuum, chloroform, methanol and acetonitrile (PCM, linear response). | ||
The excitation of K1 and K2 in all the solvents at 420 nm, resulted in blue emission in the range of 556–573 nm for K1 and 534–550 nm for K2, respectively. The emission can be related to the π → π* intraligand transitions as it is known that emission from metal-centered excited states is highly unlikely for Zn(II) complexes, since the ion is in its stable d10 configuration.42 For both complexes K1 and K2 the bathochromic shift of the emission bands (λex = 420 nm) and bands related to MLCT transitions in the UV-vis spectra (403–421 nm) in the non-polar solvents, was noted (Fig. 9–11), what is quite similar to the helicate dinuclear Zn(II) compounds with Schiff base obtained from bis(4-aminophenyl) ether and 3-methoxysalicylaldehyde.43
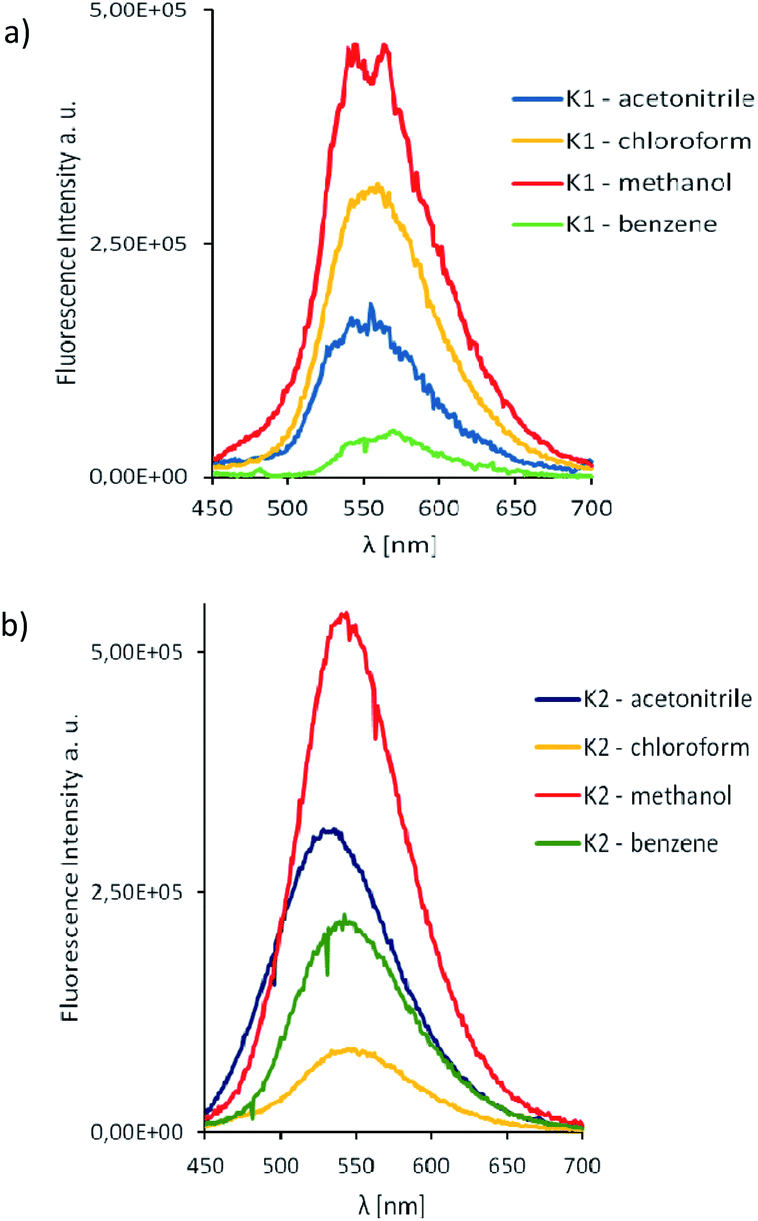 | ||
| Fig. 11 Solution emission spectra of complexes K1 and K2. (a) K1 (b) K2 λex = 420 nm (MeCN, chloroform, methanol and benzene 1 × 10⁻⁴ mol dm−3, RT). | ||
In the case of K2, an increase in fluorescence intensity with increasing solvent polarity, was observed. The increase of solvent intensity in polar solvents can be connected with weak solvent–solute interactions, that makes difficult effective non-radiative relaxation.15 Both complexes showed higher intensity bands in the chloroform.
The Stokes shifts of the bands for K1 ranges from 5703 to 6327 cm−1 and from 5202 to 5737 cm−1 for K2. For both complexes the highest value of the Stokes parameter was noted in polar MeOH, what can be a results of the different way of dissipation energy and possibility of the hydrogen bond formation. The broad band at the emissive spectra are connected with energy transfer between the highest occupied and the lowest unoccupied molecular orbitals.
In the case of K2, the quantum yield of the fluorescence in benzene is the highest (ϕ = 0.78) (Table S5†). In the remaining solvents, it stayed at the same level in the range of 0.1–0.2. Moreover, ϕ values in all solvents except benzene are comparable to ϕ values, which were noted for K1. The values of fluorescence quantum yields for K1 and K2 are higher in comparison with the series of zinc(II) complexes with symmetrical and asymmetrical Schiff bases (λem = 427–500 nm, ϕ = 3–14.3%),22 or with several zinc(II) complexes with Schiff base derived from 4-ethyl-2,6-diformylphenol and 2,2′-dimethyl-1,3-diaminopropane (ϕ = 0.0048–0.02576, λem = 436 nm, λex = 370 nm).42 The higher ϕ values for K1 and K2 can be connected with the structures of the complexes (presence of various group at the zinc(II) ions: OMe in K1 and AcO in K2) and in consequence different way of energy dissipation. It is known that the presence of various chromophores at the coordination centre can lead to secondary interactions between chromophores π system and produce aggregates with dynamic optical properties and interligand charge-transfer processes.44 We also observed different behaviors of our compounds in dependence on the type of anion coordinated to the metal centre and also on the groups connected to the salicylaldehyde rings.
As we mentioned before the Zn(II) complexes can be a promising emissive materials for OLED applications. Therefore, the solid luminescence properties of the isolated complexes in the solid state at room temperature were investigated. K1 showed green emission at 573 nm and K2 – at 556 nm after excitation at 420 nm. These values are red shifted in relation to the position of the emission bands in the solution (Fig. 12, Table S7†) as it was noted for the series of Zn(II) complexes derived from 4-methyl-2,6-diformylphenol and 1,2-diaminobenzene18 or bis-Zn(II) salphen complexes bearing pyridyl ligands.8 The values of this shift (0–17 nm for K1, and 6–22 nm for K2) depend on the solvent (Table S7†). The difference between emission spectra in solution and in the solid state, lies in the intensity of the emission bands that are lower in the solid state with quantum yields of ϕ = 0.28 for K1 and ϕ = 0.58 for K2. K1 and K2 exhibited higher quantum efficiency of the fluorescence in the solid state in comparison to the similar complexes reported previously.20 Despite the lower fluorescence intensity in the solid state, the values of ϕ are high enough (ϕ = 0.58 K2) to consider these compounds as promising candidates for optical devices. The lower intensity value can be connected with intermolecular interactions between adjacent molecules and, as a consequence, a different emission pathway. The both complexes showed in the solid state large Stokes shift 6997 cm−1 in the case of K1 and 7524 cm−1 for K2. The value of Stokes shifts in solid states are higher for those obtained in the different solvents.
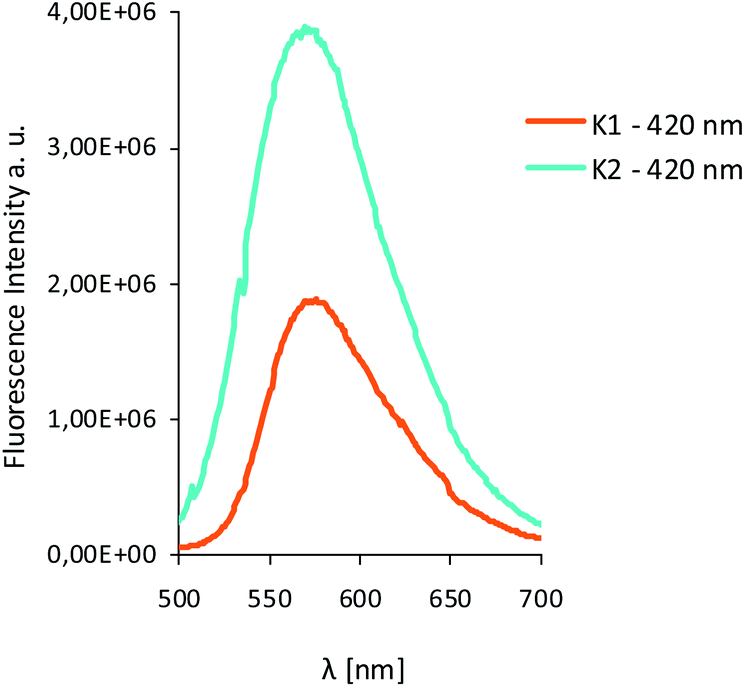 | ||
| Fig. 12 Solid state emission spectra of complexes K1 and K2 λex = 420 nm. | ||
Generally, the values of the fluorescence quantum yields for K1 and K2 complexes in solution and in the solid state, are higher than ϕ values reported previously for many macrocyclic Zn(II) compounds.
The differences in the coordination sphere of the both complexes (OMe in K1 and AcO in K2), various coordination bonds resulted in their distinct spectroscopic behaviour. Finally, the complexes are high emissive, both in solution and in the solid state, the large Stokes shifts was noted, which could be of significance in search for new optical materials.
Thin films of zinc(II) complexes
The morphology and surface roughness of thin films were investigated by SEM and AFM techniques. In order to study the chemical composition of the films, EDS analyses were conducted for all the samples. The optimum parameters of the layers (roughness, thickness, and homogeneity) were obtained in the multistage spin coating process, at the spin speed 2000 rpm, 1500 rpm; time of coating 5 s for K1, and 1500 rpm and 5 s, 3000 rpm and 5 s or 10 s for K2. In some cases, thin and homogeneous films of complexes were obtained on silicon surfaces first immobilized with PS (polystyrene) or PMMA (polymethyl methacrylate).The two-dimensional (2D) and three-dimensional (3D) AFM images scanned over a surface area of 1 × 1 μm2 are shown in Fig. 13. The root-mean square (RMS) parameters were calculated from the AFM images. The AFM images of the films indicate thin, amorphous layers of both the zinc(II) complexes deposited on the silicon surfaces with roughness parameters (of the deposited film) in the range Ra = 53.5–194 nm and Rq = 59.9–121 nm for K1 in the case of films obtained with the use of PS, and Ra = 0.98–3.83 nm and Rq = 0.83–1.50 nm for the samples prepared without PS. For a series of K2 materials, the roughness parameters equaled Ra = 6.02–12.3 nm and Rq = 7.10–9.66 nm. The values of the roughness parameters indicate the achievement of smooth films of zinc(II) complexes. This led us to conclude that using a polymer as a stabilizing agent, results in the development of thicker and rougher layers. This is important because the layers which can be used e.g. in OLEDs have to be smooth and thin. The same was observed previously by us in the case of copper(II) complexes films.23,24 Moreover, the use of the PS in materials can constrained the molecular motion in a solid matrix to reduce the possibility of a non-radiative decay process of their excited states and affect the fluorescence.8 In some cases, round structures on the surface were noted. The films have a uniform and dense morphology constituting quasi-spherical structures which are homogeneously distributed. The depth of the films was between 31.6 and 300 nm.
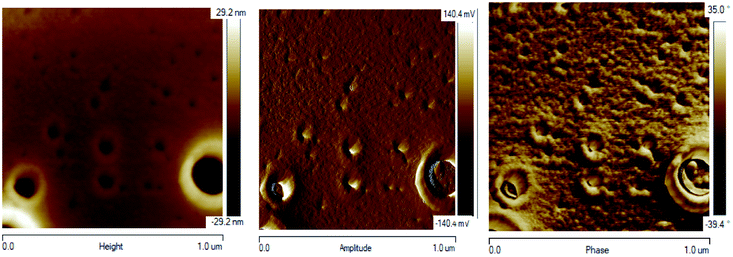 | ||
| Fig. 13 AFM of [Zn2(MeO)1.4(OH)0.6(L1)]·2H2O K1, PMMA/Si; PMMA + [Zn2(MeO)1.4(OH)0.6(L1)]·2H2O K1 2000 rpm, 5 s, PMMA + [Zn2(MeO)1.4(OH)0.6(L1)]·2H2O K1 1500 rpm 5 s × 3, scan size 10 μm, height (thickness) 31.6 nm, Ra = 9.03 nm, Rq = 3.92 nm. Phase image map of layer properties including mechanical, chemical, and viscoelastic properties. Amplitude – the image of height, in which the dimension of z axis was reduced. | ||
The EDS results indicate the presence of a zinc content between 2.63 and 2.83 percent in mass. Moreover, the EDS mapping confirmed the presence of the zinc(II) compounds over the entire silicon surface (Fig. 14 and S18†).
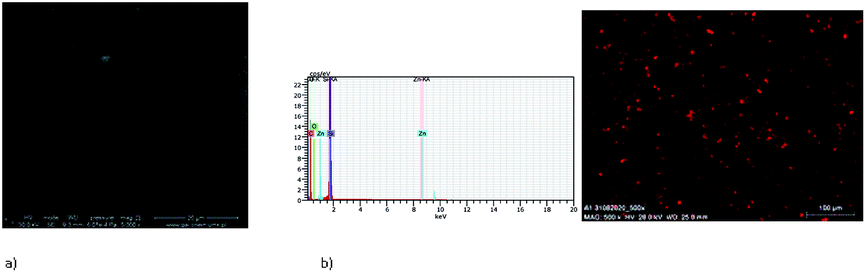 | ||
| Fig. 14 SEM of K1_1 (a) [Zn2(MeO)1.4(OH)0.6(L1)]·2H2O K1, Si PS 2000 rpm 5 s, 3000 rpm × 2, PS+ complex K1 × 3. (b) EDS mapping of K1_1 [Zn2(MeO)1.4(OH)0.6(L1)]·2H2O K1, Si PS 2000 rpm 5 s, 3000 rpm × 2, PS + complex K1 × 3, scan size 1 μm. | ||
Fluorescence properties of the materials
The layers obtained by spin coating are thin, homogeneous, smooth fluorescent materials, which exhibited fluorescence in the range of 495–572 nm for the materials K1_1–K1_3 and between 517–566 nm for K2_1–K2_3 (Fig. 15). The intensity of the emission bands is similar in the case of thin films in comparison with the solid state. Moreover, the luminescence of the K1_1, K1_3 materials is significantly lower than of the K2 series. The same difference in the emission of the K1 and K2 in the solid state was observed. The high green emission of the luminescence of K2 and K1_2 materials make them good candidates for applications in optoelectronic devices.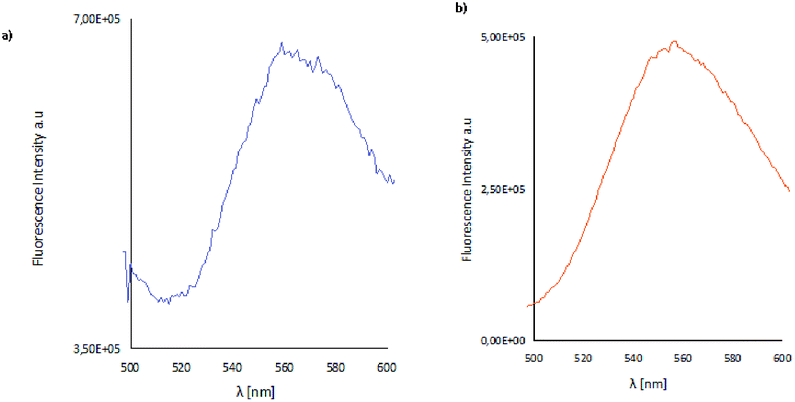 | ||
| Fig. 15 Solid state emission spectra of (a) K1_2 material, (b) K2_2 material; λex = 420 nm, λem = 554 nm (K1_2), λem = 565 nm (K2_2). | ||
Ellipsometric analysis of the thin films
The thicknesses of the prepared thin layers were established to be 9.5 ± 0.2 nm, 14.8 ± 0.3 nm and 1.28 ± 0.06 nm for K1_1, K1_2 and K1_3 samples, respectively. The thicknesses of the Zn complex films for the K2 series of samples were found to be 5.8 ± 0.2 nm (K2_1), 6.6 ± 0.5 nm (K2_2) and 5.5 ± 1.8 nm (K2_3).The legend for the samples is reported under ESI.†
Conclusions
Two Zn(II) complexes, K1 and K2, with tetradentate Schiff bases derived from o-phenylenediamine and 2-hydroxy-5-methylisophthalaldehyde L1 or 2-hydroxy-5-tert-butyl-1,3-benzenedicarboxaldehyde L2, respectively, were obtained in template synthesis. The X-ray structures for all the compounds were resolved. In both the complexes, the zinc(II) ions were found in a slightly distorted square pyramidal environment. In spite of the fact that the synthesis reaction was carried out under the same conditions, there is a difference in the coordination spheres of the isolated complexes. In both the complexes, the apical position of the zinc ion is occupied by an oxygen atom of methanolate or a larger acetate ion in K1 or K2, respectively. These groups are on the opposite sides of the basal plane in both complexes. Comparison of the complexes K1 and K2 leads to the conclusion that the geometry of the macrocycle depends on its type, number of involved atoms and kind of bonds, whereas substituents and even packing seem to be of minor importance.Finally, the complexes are luminescent, both in solution and in the solid state, which could be of significance in search for new LEDs. The new complexes exhibited emission in the range of 556–573 nm for K1 and 534–550 nm for K2 in solutions of different polarities and, was is very important for potential using them as emissive organic layers, in the solid state. Moreover, the quantum yield of fluorescence is the highest in non-polar benzene for K2 (λex = 420 nm, ϕ = 0.78) and also in the solid state (λex = 420 nm, ϕ = 0.58). The influence of the geometry of the coordination center (the presence of the various anions in the Zn(II) coordination sphere) on the luminescence properties of the complexes was noticed. The obtained spin coating materials, exhibited fluorescence in the range of 495–572 nm for K1 and between 517–599 nm (with the higher intensity of fluorescence) for K2. The emission of complexes is connected with LMCT and MLCT transitions. The high quantum yield and large Stokes shift observed for complexes in solution, solid state and thin materials makes them good candidates as emitting materials in OLED. The employed computational procedure allowed the prediction of the relative tendencies in the absorption spectra for all the compounds, and determination of the character of the transitions in the spectra of all the isolated compounds.
Author contributions
Magdalena Barwiolek: description of the obtained results and conceptualization, supervision, project administration, manuscript writing, manuscript editing. Dominika Jankowska: performance of the experiments, recording the UV-vis and fluorescence spectra in various solvents, UV-vis and fluorescence data collection, manuscript editing. Mateusz Chorobinski: performance of the ellipsometric analysis. Anna Kaczmarek-Kędziera: Performance of all the theoretical calculations, description of the applied computational methodology and discussion of the obtained DFT results, manuscript editing. Iwona Lakomska: conceptualization and financial support. Slawomir Wojtulewski: crystallography. Tadeusz M. Muzioł: crystallography, manuscript editing. All authors have read and agreed to the published version of the manuscript.Conflicts of interest
There are no conflicts to declare.Acknowledgements
“Wroclaw Centre for Networking and Supercomputing is gratefully acknowledged for generous allotment of computational resources. This research was supported in part by PL-Grid Infrastructure”. Diffraction data for K1 were collected on MX14-2 at the BESSY II electron storage ring operated by the Helmholtz-Zentrum Berlin.45 We would particularly like to acknowledge the help and support of Frank Lennartz during the experiment. The equipment in the Center of Synthesis and Analysis BioNanoTechno of University of Bialystok was funded by EU, project no. POPW.01.03.00-20-004/11. I. Ł. is a member of the Centre of Excellence “Towards Personalized Medicine” operating under the Excellence Initiative - Research University.References
- A. N. Gusev, M. A. Kiskin, E. V. Braga, M. Chapran, G. Wiosna-Salyga, G. V. Baryshnikov, V. Minaeva, B. F. Minaev, K. Ivaniuk, P. Stakhira, H. Ågren and W. Linert, J. Phys. Chem. C, 2019, 123, 11850–11859 CrossRef CAS.
- Q. C. Zhang, H. Xiao, X. Zhang, L. J. Xu and Z. N. Chen, Coord. Chem. Rev., 2019, 378, 121–133 CrossRef CAS.
- K. Das, T. K. Mondal, E. Garribba, M. Fondo, C. Sinha and A. Datta, Inorg. Chim. Acta, 2014, 413, 194–202 CrossRef CAS.
- P. Roy, Coord. Chem. Rev., 2021, 427, 213562 CrossRef CAS.
- C. Bizzarri, E. Spuling, D. M. Knoll, D. Volz and S. Bräse, Coord. Chem. Rev., 2018, 373, 49–82 CrossRef CAS.
- J. Zhang, L. Xu and W. Y. Wong, Coord. Chem. Rev., 2018, 355, 180–198 CrossRef CAS.
- I. Ravikumar and P. Ghosh, Inorg. Chem., 2011, 50, 4229–4231 CrossRef CAS PubMed.
- J. Zhao, F. Dang, B. Liu, Y. Wu, X. Yang, G. Zhou, Z. Wu and W. Y. Wong, Dalton Trans., 2017, 46, 6098–6110 RSC.
- G. Salassa, A. M. Castilla and A. W. Kleij, Dalton Trans., 2011, 40, 5236–5243 RSC.
- C. R. Bhattacharjee, G. Das, P. Mondal and N. V. S. Rao, Polyhedron, 2010, 29, 3089 CrossRef CAS.
- Y. Hamada, T. Sano, M. Fujita, T. Fujii, Y. Nishio and K. Shibata, Jpn. J. Appl. Phys., 1993, 32(4A), L511–L513 CrossRef CAS.
- A. Kumar, A. K. Palai, R. Srivastava, P. S. Kadyan, M. N. Kamalasanan and I. Singh, J. Organomet. Chem., 2014, 756, 38–46 CrossRef CAS.
- D. Majumdar, S. Dey, A. Kumari, T. K. Pal, K. Bankura and D. Mishra, Spectrochim. Acta, Part A, 2021, 254, 119612 CrossRef CAS PubMed.
- M. Karmakar, S. Roy and S. Chattopadhyay, New J. Chem., 2019, 43, 10093–10102 RSC.
- S. K. Kushvaha, S. Arumugam, B. Shankar, R. S. Sarkar, V. Ramkumar and K. Ch. Mondal, Eur. J. Inorg. Chem., 2019, 2871–2882 CrossRef CAS.
- D. Majumar, J. L. Biswas, M. Monadal, M. M. S. Babu, R. K. Metre, S. Das, P. Bankura and D. Mishra, J. Mol. Struct., 2018, 1155, 745–757 CrossRef.
- A. Hens, RSC Adv., 2015, 5, 54352–54363 RSC.
- V. Paredes-García, D. Venegas-Yazigi, A. Cabrera, P. Valencia-Gálvez, M. Arriagada, D. Ruiz-Leon, N. Pizarro, A. Zanocco and E. Spodine, Polyhedron, 2009, 28, 2335–2340 CrossRef.
- W. Huang, H. B. Zhu and S. H. Gou, Coord. Chem. Rev., 2006, 250, 414–423 CrossRef CAS.
- J. A. Marafie, D. D. C. Bradley and C. K. Williams, Inorg. Chem., 2017, 56, 5688–5695 CrossRef CAS PubMed.
- C. T. L. Ma and M. J. MacLachlan, Angew. Chem., Int. Ed., 2005, 44, 4178–4182 CrossRef CAS PubMed.
- P. Fuentealba, L. Serón, C. Sánchez, J. Manzur, V. Paredes-Garcia, N. Pizarro, M. Cepeda, D. Venegas-Yazigi and E. Spodine, J. Coord. Chem., 2014, 67(23–24), 3894–3908 CrossRef CAS.
- M. Barwiolek, A. Kaczmarek-Kedziera, T. Muziol, D. Jankowska, J. Jezierska and A. Bieńko, Int. J. Mol. Sci., 2020, 21(13), 4587 CrossRef CAS PubMed.
- M. Barwiolek, E. Szłyk, A. Berg, A. Wojtczak, T. M. Muziol and J. Jezierska, Dalton Trans., 2014, 43, 9924–9933 RSC.
- Z. Yu, A. Hagfeldt and L. Sun, Coord. Chem. Rev., 2020, 406, 213143 CrossRef CAS.
- N. Baig, I. Kammakakam and W. Falath, Mater. Adv., 2021, 2, 1821 RSC.
- W. Kabsch, Acta Crystallogr., Sect. D: Biol. Crystallogr., 2010, 66, 125–132 CrossRef CAS PubMed.
- M. Krug, M. S. Weiss, U. Heinemann and U. Mueller, J. Appl. Crystallogr., 2012, 45, 568–572 CrossRef CAS.
- Oxford Diffraction Ltd., CrysAlis RED and CrysAlis CCD, Oxford Diffraction Ltd., Oxfordshire, UK, 2000, p. 54 Search PubMed.
- G. M. Sheldrick, Acta Crystallogr., Sect. A: Found. Crystallogr., 2008, 64, 112–122 CrossRef CAS PubMed.
- K. Brandenburg, DIAMOND, Crystal Impact GbR; Release 2.1e, CRYSTAL IMPACT Dr. H. Putz & Dr. K. Brandenburg GbR Bonn, Germany, 2001 Search PubMed.
- L. J. Farrugia, J. Appl. Crystallogr., 1997, 30, 565 CrossRef CAS.
- M. J. Frisch, G. W. Trucks, H. B. Schlegel, G. E. Scuseria, M. A. Robb, J. R. Cheeseman, G. Scalmani, V. Barone, G. A. Petersson, H. Nakatsuji, et al., Gaussian 16, Revision B.01, Gaussian, Inc., Wallingford, UK, 2016 Search PubMed.
- J.A. Woollam Co., Inc, Guide to Using WVASE32®, Wextech Systems Inc., 310 Madison Avenue, Suite 905, New York, NY 10017, 2010 Search PubMed.
- A. W. Addison, T. N. Rao, J. Reedijk, J. van Rinn and G. C. Verschoor, J. Chem. Soc., Dalton Trans., 1984, 7, 1349–1356 RSC.
- A. J. Atkins, D. Black, R. L. Finn, A. Marin-Becerra, A. J. Blake, L. Ruiz-Ramirez, W. S. Li and M. Schröder, Dalton Trans., 2003, 1730–1737 RSC.
- J. Gao, Y.-G. Liu, Y. Zhou, L. M. Boxer, F. R. Woolley and R. A. Zingaro, ChemBioChem, 2007, 8, 332–340 CrossRef CAS PubMed.
- P. R. Spackman, M. J. Turner, J. J. McKinnon, S. K. Wolff, D. J. Grimwood, D. Jayatilaka and M. A. Spackman, J. Appl. Crystallogr., 2021, 54(3), 1006–1011 CrossRef CAS PubMed.
- L. J. Fan, J. F. Ma and J. Liu, Acta Crystallogr., Sect. E: Struct. Rep. Online, 2009, 65, m777–m778 CrossRef CAS PubMed.
- Y. A. Ustynyuk, N. E. Borisova, V. M. Nosova, M. D. Reshetova, S. S. Talismanov, S. E. Nefedov, G. A. Aleksandrov, I. L. Eremenko and I. I. Moiseev, Russ. Chem. Bull., 2002, 51(3), 488–498 CrossRef CAS.
- A. B. P. Lever, Inorganic Electronic Spectroscopy, Elsevier, Amsterdam, The Netherlands, 1968, pp. 355–361 Search PubMed.
- S. Majumder, L. Mandal and S. Mohanta, Inorg. Chem., 2012, 51, 8739–8749 CrossRef CAS PubMed.
- P. Cucos, F. Tuna, L. Sorace, I. Matei, C. Maxim, S. Shova, R. Gheorghe, A. Caneschi, M. Hillebrand and M. Andruh, Inorg. Chem., 2014, 53, 7738–7747 CrossRef CAS PubMed.
- D. Temerova, K. S. Kisel, T. Eskelinen, A. S. Melnikov, N. Kinnunen, P. Hirva, J. R. Shakirova, S. P. Tunik, E. V. Grachova and I. O. Koshevoy, Inorg. Chem. Front., 2021, 8, 2549 RSC.
- U. Mueller, R. Forster, M. Hellmig, F. U. Huschmann, A. Kastner, P. Malecki, S. Pühringer, M. Röwer, K. Sparta and M. Steffien, Eur. Phys. J. Plus, 2015, 130, 141–150 CrossRef.
Footnote |
| † Electronic supplementary information (ESI) available: Table S1: Crystal data and structure refinement for K1 and K2. Fig. S1: 1H NMR spectrum of K1 (500 MHZ, CDCl3), Fig. S2: 1H NMR spectrum of K2 (700 MHZ, CDCl3), Fig. S3: 13C NMR spectrum of K2 (700 MHZ, CDCl3), KBr, Fig. S4: IR spectrum of K1, KBr, Fig. S5: IR spectrum of K2, KBr, Fig. S6: TG-DTA traces of K1, Fig. S7: XRD analysis – compliance of the sample K2 composition with ZnO, Fig. S8: TG-DTA traces of K2, Fig. S9: XRD analysis – compliance of the sample K2 composition with ZnO, Table S2: Selected bond length [Å] and bond angles [°] for the complex K1, Fig. S10: Structure of K1 with square pyramids sharing the edge, Table S3: Bond angles in the reported complexes K1 and K2, Table S4: Selected bond length [Å] and bond angles [°] for the complex K2, Table S5: Relevant photophysical data of K1 and K2 compounds (λem, λex nm, total fluorescence quantum yield ϕ, λ [nm] (ε [dm3 mol−1 cm−1 ])), Fig. S11: Frontier molecular orbitals of K1 for the most intensive transitions (PBE0/6-311++G(d,p)/PCM(acetonitrile)), Fig. S12: Frontier molecular orbitals of K2 for the most intensive transitions (PBE0/6-311++G(d,p)/PCM(acetonitrile)), Table S6: Theoretical PBE0/6-311++G(d,p)/PCM(ACN) vertical excitation wavelengths λ [nm] for most intensive transitions together with the corresponding oscillator strengths f and the orbital contributions for investigated species, Table S7: Relevant fluorescent data of studied complexes in solid state (λem, λex [nm]), Fig. S13: Scanning images, magn. 20k× for: (a) K1, magn. 10k×, (b) K2_2, (c) EDX K2_1, Fig. S14: Ψ and Δ ellipsometric azimuths measured (dashed lines) and their model fits (red solid lines) for the complex K1_1. The value of χ2 was 2.27, Fig. S15: (a) The real part of the complex refractive index (n) for the examined films of Zn complexes (K1). (b) The extinction coefficient (k) for the examined films of Zn complexes (K1), Fig. S16: (a) The real part of the complex refractive index (n) for the examined films of Zn complexes (K2). (b) The extinction coefficient (k) for the examined films of Zn complexes (K2). CCDC 2046260 and 2047049. For ESI and crystallographic data in CIF or other electronic format see DOI: 10.1039/d1ra03096e |
| This journal is © The Royal Society of Chemistry 2021 |