 Open Access Article
Cu2O nanoparticles anchored on carbon for the efficient removal of propofol from operating room wastewater via peroxymonosulfate activation: efficiency, mechanism, and pathway†
Yujie Tang *a,
Shiyin Zhaob,
Zemin Penga,
Zhen Lia,
Liang Chena and
Pei Gan*a
aHunan Provincial Maternal and Child Health Care Hospital, Changsha 410008, P. R. China. E-mail: tangyujie0202@163.com; hnsfybjymz@yahoo.com
bFaculty of Health Sciences, University of Macau, Macau SAR 999078, P. R. China
First published on 14th June 2021
Abstract
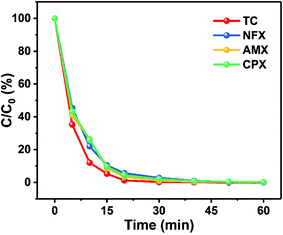
Anesthetic drug wastage has increasingly become the main resource of operating room sewage, which poses a great risk to the safety of humans and other organisms. Propofol is the most widely used anesthetic drug in the world, and also occupies the largest proportion of the total anesthetic wastage in the operating room. In this work, a 2D Cu2O anchored carbon catalyst (Cu2O@NC) was prepared by the assembly-pyrolysis process and successfully applied to peroxymonosulfate (PMS) activation. We took propofol as a typical example and investigated the removal activity through heterostructure-enhanced advanced oxidation processes (AOPs). Through the degradation process, propofol can be removed from 20 ppm to ultralow levels within 5 min using the PMS/Cu2O@NC system. The degradation pathway of propofol was deduced through quantum chemical calculation and LC/GC-MS results. The final products were verified as CO2 and H2O. Moreover, sulfate radicals (SO4˙−) proved to be the dominant reactive oxidation species by radical scavenger experiments and ESR results. In addition, it has great universality for various pharmaceuticals such as tetracycline (TC), amoxicillin (AMX), cephalexin (CPX), and norfloxacin (NFX). Our work provided the possibility to treat operation room sewage in a rapid, high-efficiency, and feasible way.
Introduction
Anesthetics have increasingly become one of the most common pharmaceutical pollutants in operating room sewage due to their wide use in clinical practice.1–3 Propofol is the world's most widely used intravenous general anesthetic.4–6 However, a large amount of discarded and excreted propofol directly enters the aquatic environment without efficient treatment.7 According to reports, wasted propofol accounts for 45% of the total waste of pharmaceuticals in the operating room.8–10 Propofol could hardly be massively photolyzed or biodegraded under ambient conditions,8,11,12 but may directly lead to the death of algae, small crustaceans, and freshwater fish.13,14 Simultaneously, propofol presents bioaccumulating properties in highly tolerant organisms due to its fat solubility and then reach the species at the top of food chain step by step.15,16 Moreover, propofol also exhibits outstanding thermal stability. Only when the ambient temperature is higher than 1000 °C for 2 seconds, the drug can be incinerated.14 Hence, the continued release of propofol has great potential to become a persistent organic pollutant in the ecosystem. However, studies on the removal of propofol, degradation mechanism and pathway are sparse. Hence, efficient strategies for the treatment of propofol wastage are urgently needed.The techniques for removing pharmaceutical pollutants from water bodies can be summarized into four types: membrane separation,17,18 chemical decomposition,19,20 adsorption,21,22 and photocatalysis.23,24 However, these techniques always have shortcomings such as low efficiency, environmental unfriendliness and high cost in practical operation.12,25 Among all techniques, the advanced oxidation process (AOP) has received considerable attention for its highly efficient, low-cost, and environmentally friendly characteristics.26–28 Conventional catalysts for the oxidants are transition metal oxides, however, they also show a small specific surface area, poor porosity, and low-efficiency active sites. MOFs and their derivatives have received extensive attention from researchers for their outstanding performance in various applications, such as sensing adsorption, photocatalysis, drug delivery and energy storage.21,29–31 Meanwhile, due to the changeable chemical composition, large specific surface area, and controllable pore size, the MOFs derived heterostructure is an ideal activator for PMS.32–35
Herein, a reported Cu–TCPP nanosheet was subjected to produce a heterostructure catalyst that could efficiently activate PMS in the degradation of propofol.21 After assembly for 24 h and then pyrolyzing at 450 °C for 2 h under N2 atmosphere, the 2D catalyst was successfully prepared. The XRD pattern and the TEM image showed that the catalyst was composed of Cu2O loaded on 2D N-doped carbon. Significantly, under optimized conditions, PMS/Cu2O@NC could remove propofol from 20 mg L−1 concentration to an ultra-low level. The main byproduct was proved to be cyclohexanone according to LC/GC-MS, and the final degradation products were CO2 and water according to TOC results. The sulfate radical (SO4˙−) played a dominant role during the degradation process. The quantum chemistry calculation was also employed to verify the degradation path and degradation possibility of propofol. Simultaneously, PMS/Cu2O@NC presented universality for other pharmaceutical contaminants such as tetracycline (TC), amoxicillin (AMX), cephalexin (CPX), and norfloxacin (NFX). This work provides great potential for AOPs to be widely used for sewage treatment coming from operating rooms.
Experimental
Materials
Meso-tetra(4-carboxyphenyl)porphine (TCPP, Fig. S1†) was bought from Yanshen Technology (Jilin, China). PMS, propofol, TC, AMX, CPX, NFX, copper nitrate trihydrate [Cu(NO3)2·3H2O], N,N-dimethylformamide (DMF), ethanol and tert-butanol were purchased from Aladdin Chemical (Shanghai, China). All reagents and solvents were used as received without any purification.Characterizations
Powder X-ray diffraction (XRD) patterns were recorded using a polycrystalline diffractometer (Rigaku D/max-2550 VB) with Cu Kα (λ = 0.154 nm). The Fourier transform infrared spectrometer (FTIR) (Nicolet 1S 50) with KBr pellets was used for analysis. The morphology was recorded using field emission scanning electron microscopy (SEM, Zeiss Merlin) with a working voltage of 10 kV and transmission electron microscopy (TEM, Tecnai F30) with an acceleration voltage of 300 kV. The thermogravimetric analysis and differential scanning calorimetry (TG-DSC) were performed on a Setsys EVO Easy 1750 (SETARAM). X-ray photoelectron spectroscopy (XPS) was measured using a Thermo ESCALAB 250XI instrument equipped with Al Kα radiation. The surface area and porosity were analyzed by Micromeritics ASAP2046. The electron spin-resonance (ESR) spectra were recorded by a JES FA200 spectroscopy.Preparation of Cu2O@NC
The Cu–TCPP nanosheet was synthesized by a reported method.21 Typically, 93.7 mg Cu(NO3)2·3H2O and 98.5 mg TCPP were dissolved in 50 mL DMF in a reactor. After ultrasonication for 10 minutes, the reactor was transferred to an oven with a working temperature of 100 °C for 24 h. The resulting dark red precipitate was washed several times with DMF and ethanol and then dried in an oven at 60 °C for 8 h. The resulting Cu–TCPP samples were stored for further use.The as-prepared Cu–TCPP nanosheets were subjected to prepare metal-oxide/carbon catalyst through carbonization. For details, 500 mg of Cu–TCPP was placed in a porcelain boat and heated to 450 °C at a heating rate of 2 °C min−1, and then kept the heating process at 450 °C for 2 h. Subsequently, the product was naturally cooled to room temperature. Notably, the entire process was conducted under N2 flow. The final black powder was referred to as Cu2O@NC.
Experimental and analysis methods
Typically, 3 mg of the as-prepared catalyst was added to 100 mL of propofol solutions (C0 = 20 mg L−1) followed by stirring for 2 h to reach the adsorption equilibrium, then 30 mg of PMS was added. At the prescribed time intervals, a certain volume of the solution was taken out to measure the residue concentration of propofol in water using the high-performance liquid chromatography (HPLC) method.![[thin space (1/6-em)]](https://www.rsc.org/images/entities/char_2009.gif) :
:![[thin space (1/6-em)]](https://www.rsc.org/images/entities/char_2009.gif) VB = 20
VB = 20![[thin space (1/6-em)]](https://www.rsc.org/images/entities/char_2009.gif) :
:![[thin space (1/6-em)]](https://www.rsc.org/images/entities/char_2009.gif) 80, and the flow rate was set to 1.0 mL min−1. For NFX, the volume ratio of the mobile phase was changed to VA
80, and the flow rate was set to 1.0 mL min−1. For NFX, the volume ratio of the mobile phase was changed to VA![[thin space (1/6-em)]](https://www.rsc.org/images/entities/char_2009.gif) :
:![[thin space (1/6-em)]](https://www.rsc.org/images/entities/char_2009.gif) VB = 87
VB = 87![[thin space (1/6-em)]](https://www.rsc.org/images/entities/char_2009.gif) :
:![[thin space (1/6-em)]](https://www.rsc.org/images/entities/char_2009.gif) 13, and the wavelength was changed to 285 nm. For AMX, the volume ratio of the mobile phase was changed to VA
13, and the wavelength was changed to 285 nm. For AMX, the volume ratio of the mobile phase was changed to VA![[thin space (1/6-em)]](https://www.rsc.org/images/entities/char_2009.gif) :
:![[thin space (1/6-em)]](https://www.rsc.org/images/entities/char_2009.gif) VB = 25
VB = 25![[thin space (1/6-em)]](https://www.rsc.org/images/entities/char_2009.gif) :
:![[thin space (1/6-em)]](https://www.rsc.org/images/entities/char_2009.gif) 75, and the wavelength was changed to 230 nm. For CPX, the volume ratio of the mobile phase was set to VA
75, and the wavelength was changed to 230 nm. For CPX, the volume ratio of the mobile phase was set to VA![[thin space (1/6-em)]](https://www.rsc.org/images/entities/char_2009.gif) :
:![[thin space (1/6-em)]](https://www.rsc.org/images/entities/char_2009.gif) VB = 25
VB = 25![[thin space (1/6-em)]](https://www.rsc.org/images/entities/char_2009.gif) :
:![[thin space (1/6-em)]](https://www.rsc.org/images/entities/char_2009.gif) 75, and the wavelength was changed to 262 nm.
75, and the wavelength was changed to 262 nm.| Time/min | A (%) | B (%) |
|---|---|---|
| 0 | 90 | 10 |
| 1 | 90 | 10 |
| 8 | 10 | 90 |
| 12 | 10 | 90 |
| 12.1 | 90 | 10 |
| 13 | 90 | 10 |
Calculation method
The quantum chemistry calculation was performed on the software of Gauss 16 with a working method of b3lyp/6-311g. The correction factor was set as 0.9882. All the bond energies were calculated after optimizing the propofol molecule. All the energies of the molecule were studied at 298.15 K in a confined environment.Results and discussion
Characterization
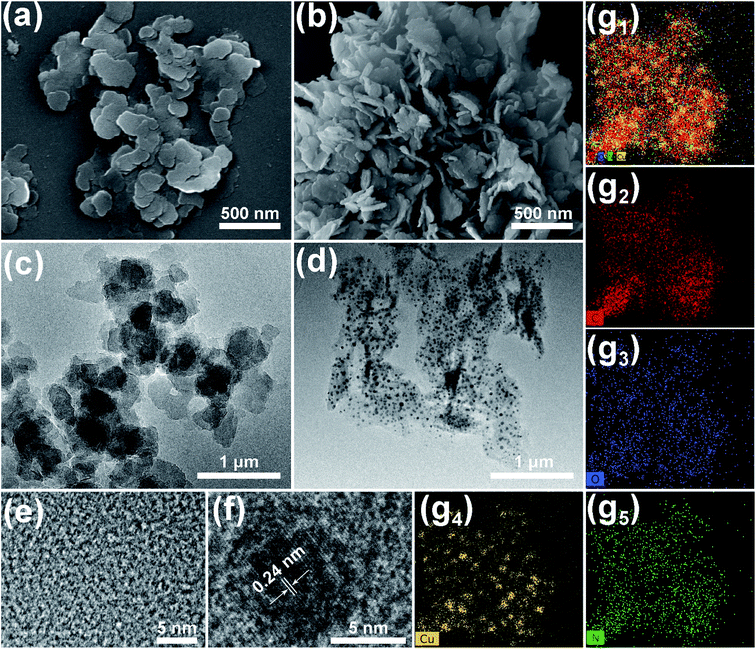
After incubation for 24 h, the resulting precipitates presented two-dimensional nanosheets. The SEM image (Fig. 1a) indicated that the Cu–TCPP nanosheet possesses a size of 500 nm, and the TEM image (Fig. 1c) revealed that the nanosheets possess pretty excellent light transmission properties, while the HR-TEM image (Fig. 1e) showed fuzzy lattice stripes, which correspond with those previously reported for MOFs.21,36 After pyrolysis, the morphology of the sample remains mostly unchanged, with slight aggregation (Fig. 1b), and the TEM image showed better light transmission (Fig. 1d). However, many particles were observed on the nanosheets, the HR-TEM image showed clear lattices with a spacing of 0.24 nm, which corresponds to the (1 1 1) plane of Cu2O.37–39 The elemental mapping graphs (Fig. 1g1–5) show that C, N, and O are highly overlapped, which demonstrates that 2D nanocomposites mainly consisted of three elements. The distribution of Cu mainly corresponded to the particle embedded in the nanosheets. Given the lattice spacing, the doped particles were supposed to be Cu2O.XRD patterns were collected to investigate the crystal changes of Cu–TCPP before and after pyrolysis. It is observed that the dominant characteristic peaks were located at 7.8, 9.0 and 19.6° (Fig. 2a), which strongly corresponded to Cu–TCPP, thus demonstrating the successful assembly of 2D Cu–TCPP.40–42 After pyrolysis, the characteristic peaks shifted to 36.5°, 42.4°, 61.6°, 73.6°, which completely corresponded to the standard pattern of Cu2O.37,43,44 The XRD pattern of the pyrolyzed products strongly corresponded to the HR-TEM image.
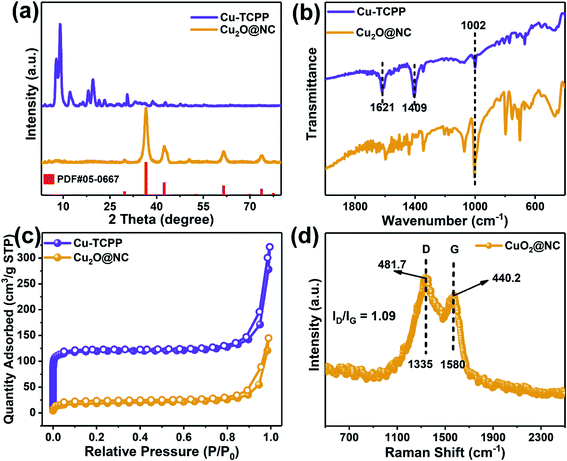 | ||
| Fig. 2 (a) XRD patterns, (b) FTIR spectra, (c) the N2 adsorption/desorption curves of Cu–TCPP and Cu2O@NC, and (d) Raman spectra of Cu2O@NC. | ||
The FTIR spectra were employed to investigate the coordination mode between clusters and ligands. As shown in Fig. 2b, the two dominant peaks located at 1621 and 1409 cm−1 with Δν > 200 cm−1 (νasym − νsym = 212 cm−1), which was attributed to the carboxyl groups, indicating that the bridging bidentate was the main coordination mode between the metal clusters and the ligands.21,45 The spectra of the pyrolyzed product showed all chaotic peaks except for the sharp peak located at 1002 cm−1, which corresponded to Cu–O, indicating that most Cu–TCPP was decomposed by the pyrolysis process.46
The surface area of the pristine MOF and derivative was analyzed by the Brunauer–Emmett–Teller (BET) method, the results showed that the Cu–TCPP had a larger surface area of 391.2 m2 g−1, while Cu2O@NC had a smaller surface area of 189.3 m2 g−1. The porosities were analyzed by Barrett–Joyner–Halenda (BJH) method, the results showed that the total pore volume was dramatically reduced by the pyrolysis process (Fig. S2†). As shown in Fig. 2c, the micropore was sharply reduced after pyrolysis. However, the average pore size was greatly expanded from 2.89 nm to 5.67 nm. These results demonstrated that the pyrolysis process could largely reduce the surface area, but also enlarge the pore size, which was beneficial to the mass transfer during the catalytical application.47–49
Raman shift was introduced to evaluate the defect and graphitic degree of the sample. The relative intensity ratio of the defect band (D, 1335 cm−1) and graphitic band (G, 1580 cm−1) was calculated as ID/IG = 1.09 (Fig. 2d), which indicated that the carbonized sample owned a large amount of the defect that may be beneficial to catalytic applications.50,51
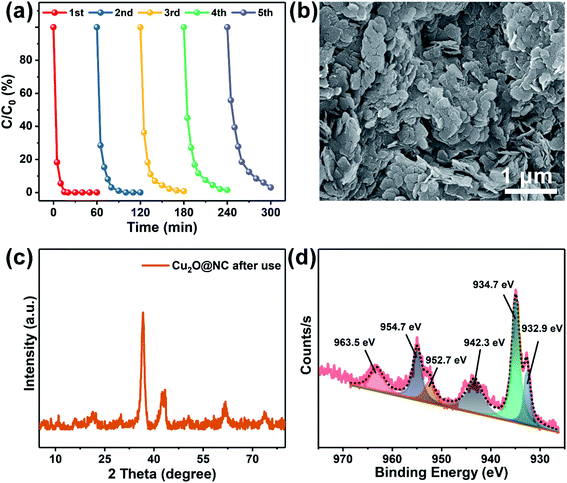
The XPS spectra provided critical evidence for the investigation of the valence states of the elements. The survey spectra showed that all the elements were maintained after pyrolysis (Fig. S3†). For Cu 2p in the Cu–TCPP (Fig. 3a), the deconvoluted peaks located at 934.7 and 954.7 eV, are corresponding to Cu(I). The peaks centered at 942.3 and 963.5 eV are ascribed to Cu(II).21,52 After pyrolysis (Fig. 3e), two new peaks centered at 932.9 and 952.7 eV were seen, which corresponded to Cu(I).53,54 The spectrum of Cu 2p demonstrated that the co-existence of Cu(I) and Cu(II) both in Cu–TCPP and Cu2O@NC, and Cu(II) gradually transferred to Cu(I) during the pyrolysis process. The spectrum of O 1s was largely weakened (Fig. 3b and f), which corresponded to the decomposition of carboxyl groups. The positive shift of O 1s was ascribed to an increase in the O vacancy. The spectrum of N 1s showed a decrease of pyrrolic N after pyrolysis (Fig. 3c and g), which meant that N doping in carbon was mainly in the state of pyridinic N. The spectra of C 1s clearly showed a decrease in C in the carboxyl state.
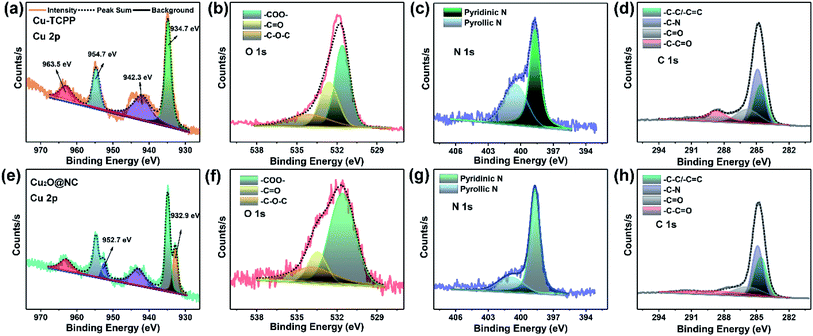 | ||
| Fig. 3 The high-resolution spectra of (a) and (e) Cu 2p, (b) and (f) O 1s, (c) and (g) N 1s, (d) and (h) C 1s of Cu–TCPP and Cu2O@NC. | ||
Given all characterizations, a possible assembly-pyrolysis process could be established. Under hydrothermal ambient conditions, TCPP ligands were coordinated with Cu–O clusters to form Cu–TCPP nanosheets. When the as-prepared percussor was treated at high temperature in an N2 flow, it gradually carbonized. The partial Cu(II) in the MOF was reduced to be Cu(I) in the state of Cu2O. N was doped in carbon in the state of pyridinic N. Moreover, the morphology of the precursor was perfectly reserved. Although the pyrolysis process greatly reduced the surface area, it simultaneously enlarged the pore size of the carbonized product, which was much better for the mass transfer in the following catalysis process.
Removal performance
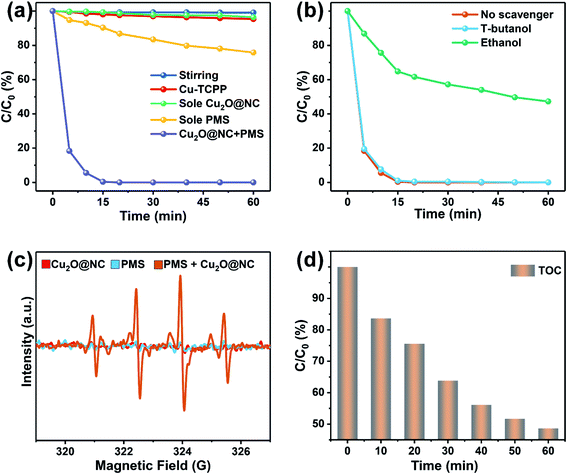
To gain further understanding of ROS in the removal process, ESR measurements were introduced to analyze the generation of the radicals. As shown in Fig. 4c, there were almost no signals in the spectrum of a single Cu2O@NC or PMS, while the signals of ˙OH and SO4˙− in the spectrum of Cu2O@NC + PMS were rather strong. These results indicated that Cu2O@NC could promote PMS to produce ˙OH and SO4˙− in an aqueous environment. To evaluate the thoroughness of the degradation of propofol, and TOC was introduced to test the degree of mineralization. As shown in Fig. 4d, the TOC was reduced to about 50%, indicating that the system could effectively degrade propofol to inorganic carbon (CO2 and CO32−).
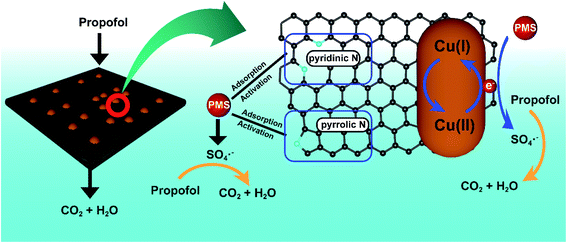
A possible mechanism could be established based on the above results (Fig. 5). After pyrolysis, a large amount of N, including pyridinic N and pyrrolic N was doped on the carbon planes. N species showed excellent adsorption and activation capability toward PMS. Meanwhile, Cu2O also presented certain defects on the surface of nanocomposites. Since PMS was added, a significant amount of SO4˙− was produced, which then acted on propofol. Finally, propofol was degraded to CO2 and H2O.
| E | U0 | U | H | G | |
|---|---|---|---|---|---|
| Value | −541.71 | −541.44 | −541.42 | −541.42 | −541.48 |
Among all parameters, G was the most important parameter for predicting the stability of the target substance. The value of U was −541.48 kJ mol−1, which meant the propofol molecule was rather stable and hardly oxidized under ambient conditions.55–57
At the same time, the bond energy was calculated under the same condition, which could be used to predict the degradation pathway and the byproducts. As shown in Table 3 and Fig. 6a, the bond of O9–H19 had the smallest bond energy (372.01 kJ mol−1) compared with other bonds, which meant that the phenolic hydroxyl group was most easily oxidized to a quinone. According to reported works, the molar mass of the byproduct is 178, which corresponds to chemical 1 (2,6-diisopropylcyclohexa-2,4-dienone). The bonds in C7–C11 and C8–C13 have comparable bond energies greater than those in O9–H19. It indicated that the two C–C bonds were subsequently destroyed by the radicals (Fig. S5a†). Given this, a substance with m/z of 150 appearing in the GC-MS and LC-MS (Fig. S5c†) should correspond to product 2 (2,6-diethylcyclohexa-2,4-dienone). Then, C7–C10 and C8–C12 showed greater bond energies, which meant they were more difficult to be destroyed, therefore correspond to the product of 3 (6-ethyl-2-methylcyclohexa-2,4-dienone). When the reactive substance continues to act on the organic pollutants, all C–C bonds were destroyed and all C![[double bond, length as m-dash]](https://www.rsc.org/images/entities/char_e001.gif) C bonds in the ring were reconstructed. The molar mass of 98 strongly corresponded to substance 4 (cyclohexanone, Fig. S5b†). The substance 4 was gradually oxidized to CO2 and H2O (Fig. 6b).
C bonds in the ring were reconstructed. The molar mass of 98 strongly corresponded to substance 4 (cyclohexanone, Fig. S5b†). The substance 4 was gradually oxidized to CO2 and H2O (Fig. 6b).
| Site | Atom | BE (kJ mol−1) |
|---|---|---|
| 1 | C5–C8 | 455.8067 |
| 2 | C8–C13 | 412.2012 |
| 3 | C8–C12 | 439.3526 |
| 4 | O9–H19 | 372.0118 |
| 5 | C1–C7 | 448.6867 |
| 6 | C7–C11 | 410.086 |
| 7 | C7–C10 | 438.7031 |
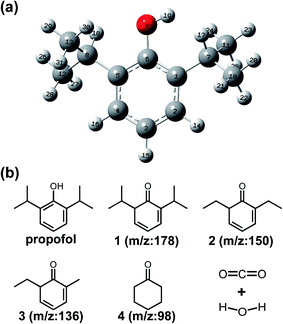 | ||
| Fig. 6 (a) The optimized chemical structure of propofol; (b) The deduced degradation pathway and possible degradation byproducts of propofol. | ||
From TOC results, we knew that organic substances could not be clearly removed, and results of GC-MS and LC-MS demonstrated that the main byproduct was cyclohexanone. According to reports, cyclohexanone is a low-toxicity chemical with a pungent odor, which makes it easier to be noticed and stay away.58–60
Conclusion
In this work, we demonstrated a novel strategy to remove propofol from operating room wastewater. In conclusion, the 2D Cu–TCPP nanosheets were assembled and employed as a pristine material to produce a 2D heterogeneous catalyst. The as-prepared catalyst exhibited excellent PMS activation performance, which could rapidly and effectively remove propofol and other abused antibiotics such as TC, NFX, AMX, and CPX. This work provides a potential method for treating operating room wastewater by the PMS leading AOP method.Author contributions
Conceptualization, Y. T.; methodology, Y. T. and S. Z.; software, Y. T.; investigation, Y. T. and Z. P.; data curation, Z. L.; writing – original draft preparation, Y. T.; writing – review and editing, Y. T. and P. G.; supervision, P. G. and L. C.; project administration, Y. T., L. C. and P. G.Conflicts of interest
There are no conflicts to declare.Acknowledgements
This work was financially supported by Natural Science Foundation of Hunan Province (2019JJ80039), Technological Innovation Guidance Program of Hunan Province (2018ZK4075). In addition, we appreciate the Shiyanjia Club (https://www.shiyanjia.com) for the technical support of the quantum chemistry calculation.References
- S. Kaniyil, A. Krishnadas, A. K. Parathody and K. T. J. A. E. Ramadas, Anesth. Essays Res., 2017, 11, 304–308 CrossRef PubMed.
- H. Beloeil and P. Albaladejo, Best Pract. Res., Clin. Anaesthesiol., 2021, 35, 83–91 CrossRef PubMed.
- A. G. Parvatker, H. Tunceroglu, J. D. Sherman, P. Coish, P. Anastas, J. B. Zimmerman and M. J. Eckelman, ACS Sustainable Chem. Eng., 2019, 7, 6580–6591 CrossRef CAS.
- K. Chaudhary, R. Garg, A. R. Bhalotra, R. Anand and K. Girdhar, J. Anaesthesiol., Clin. Pharmacol., 2012, 28, 56–61 CrossRef CAS PubMed.
- K. Y. Nandiwale and V. V. Bokade, RSC Adv., 2014, 4, 32467–32474 RSC.
- G. M. Yip, Z. W. Chen, C. J. Edge, E. H. Smith, R. Dickinson, E. Hohenester, R. R. Townsend, K. Fuchs, W. Sieghart, A. S. Evers and N. P. Franks, Nat. Chem. Biol., 2013, 9, 715–720 CrossRef CAS PubMed.
- P. Falas, H. R. Andersen, A. Ledin and J. la Cour Jansen, Water Sci. Technol., 2012, 66, 783–791 CrossRef CAS PubMed.
- R. F. Mankes, Anesth. Analg., 2012, 114, 1091–1092 CrossRef CAS PubMed.
- X. Li, P. Martinez-Lozano Sinues, R. Dallmann, L. Bregy, M. Hollmen, S. Proulx, S. A. Brown, M. Detmar, M. Kohler and R. Zenobi, Angew. Chem., Int. Ed., 2015, 54, 7815–7818 CrossRef CAS PubMed.
- S. F. Lane, Br. J. Anaesth., 2020, 124, e221–e222 CrossRef CAS PubMed.
- S. Klatte, H.-C. Schaefer and M. Hempel, Sustainable Chem. Pharm., 2017, 5, 61–66 CrossRef CAS.
- H. T. Nguyen, P. K. Thai, S. L. Kaserzon, J. W. O'Brien, G. Eaglesham and J. F. Mueller, Sci. Total Environ., 2018, 631–632, 469–475 CrossRef CAS PubMed.
- K. M. Blum, P. L. Andersson, L. Ahrens, K. Wiberg and P. Haglund, Sci. Total Environ., 2018, 612, 1532–1542 CrossRef CAS PubMed.
- M. Kostrubiak, C. M. Vatovec, L. A. Dupigny-Giroux, D. M. Rizzo, W. C. Paganelli and M. H. Tsai, J. Med. Syst., 2020, 44, 169 CrossRef CAS PubMed.
- Q. Du, X. Zhang, X. Zhang, M. Wei, H. Xu and S. Wang, Artif. Cells, Nanomed., Biotechnol., 2019, 47, 1265–1271 CrossRef CAS PubMed.
- X. Hu, J. M. T. Pierce, T. Taylor and K. Morrissey, Resour., Conserv. Recycl., 2021, 167, 105411 CrossRef.
- S. O. Ganiyu, E. D. van Hullebusch, M. Cretin, G. Esposito and M. A. Oturan, Sep. Purif. Technol., 2015, 156, 891–914 CrossRef CAS.
- F. Martinez, M. J. Lopez-Munoz, J. Aguado, J. A. Melero, J. Arsuaga, A. Sotto, R. Molina, Y. Segura, M. I. Pariente, A. Revilla, L. Cerro and G. Carenas, Water Res., 2013, 47, 5647–5658 CrossRef CAS PubMed.
- F. J. Benitez, J. L. Acero, F. J. Real, G. Roldan and F. Casas, Chem. Eng. J., 2011, 168, 1149–1156 CrossRef CAS.
- S. Farhadi, B. Aminzadeh, A. Torabian, V. Khatibikamal and M. Alizadeh Fard, J. Hazard. Mater., 2012, 219–220, 35–42 CrossRef CAS PubMed.
- S. Zhao, S. Li, Z. Zhao, Y. Su, Y. Long, Z. Zheng, D. Cui, Y. Liu, C. Wang, X. Zhang and Z. Zhang, Environ. Sci. Pollut. Res., 2020, 27, 39186–39197 CrossRef CAS PubMed.
- H. N. Tran, F. Tomul, N. Thi Hoang Ha, D. T. Nguyen, E. C. Lima, G. T. Le, C. T. Chang, V. Masindi and S. H. Woo, J. Hazard. Mater., 2020, 394, 122255 CrossRef CAS PubMed.
- A. Majumdar and A. Pal, Clean Technol. Environ. Policy, 2019, 22, 11–42 CrossRef.
- M. J. Benotti, B. D. Stanford, E. C. Wert and S. A. Snyder, Water Res., 2009, 43, 1513–1522 CrossRef CAS PubMed.
- J. A. Garrido-Cardenas, B. Esteban-Garcia, A. Aguera, J. A. Sanchez-Perez and F. Manzano-Agugliaro, Int. J. Environ. Res. Public Health, 2019, 17, 170 CrossRef PubMed.
- A. H. Khan, N. A. Khan, S. Ahmed, A. Dhingra, C. P. Singh, S. U. Khan, A. A. Mohammadi, F. Changani, M. Yousefi, S. Alam, S. Vambol, V. Vambol, A. Khursheed and I. Ali, J. Cleaner Prod., 2020, 269, 122411 CrossRef CAS.
- V. Homem and L. Santos, J. Environ. Manage., 2011, 92, 2304–2347 CrossRef CAS PubMed.
- H. Gao, H. Yang, J. Xu, S. Zhang and J. Li, Small, 2018, 14, 1801353 CrossRef PubMed.
- C. V. Nguyen, Y.-T. Liao, T.-C. Kang, J. E. Chen, T. Yoshikawa, Y. Nakasaka, T. Masuda and K. C. W. Wu, Green Chem., 2016, 18, 5957–5961 RSC.
- F. K. Shieh, S. C. Wang, C. I. Yen, C. C. Wu, S. Dutta, L. Y. Chou, J. V. Morabito, P. Hu, M. H. Hsu, K. C. Wu and C. K. Tsung, J. Am. Chem. Soc., 2015, 137, 4276–4279 CrossRef CAS PubMed.
- S. Akbari, J. Mokhtari and Z. Mirjafari, RSC Adv., 2017, 7, 40881–40886 RSC.
- S. Zhao, S. Li, Y. Long, X. Shen, Z. Zhao, Q. Wei, S. Wang, Z. Zhang, X. Zhang and Z. Zhang, Chemosphere, 2021, 280, 130637 CrossRef CAS PubMed.
- S. Jamalifard, J. Mokhtari and Z. Mirjafary, RSC Adv., 2019, 9, 22749–22754 RSC.
- J. Mokhtari and A. Hasani Bozcheloei, Inorg. Chim. Acta, 2018, 482, 726–731 CrossRef CAS.
- H. Zhang, X. Zheng, L. M. Yang and E. Ganz, Inorg. Chem., 2021, 60, 2656–2662 CrossRef CAS PubMed.
- S. Zhao, Z. Ding, C. Wang, S. Wang, S. Li, Z. Zhang and X. Zhang, ACS Omega, 2019, 4, 14294–14300 CrossRef CAS PubMed.
- D. Jiang, J. Xue, L. Wu, W. Zhou, Y. Zhang and X. Li, Appl. Catal., B, 2017, 211, 199–204 CrossRef CAS.
- S. Zhang, S. Zhang, F. Peng, H. Zhang, H. Liu and H. Zhao, Electrochem. Commun., 2011, 13, 861–864 CrossRef CAS.
- J. Liu, Z. Gao, H. Han, D. Wu, F. Xu, H. Wang and K. Jiang, Chem. Eng. J., 2012, 185–186, 151–159 CrossRef CAS.
- Y. Li, Z. Gao, F. Chen, C. You, H. Wu, K. Sun, P. An, K. Cheng, C. Sun, X. Zhu and B. Sun, ACS Appl. Mater. Interfaces, 2018, 10, 30930–30935 CrossRef CAS PubMed.
- M. Zhao, Y. Wang, Q. Ma, Y. Huang, X. Zhang, J. Ping, Z. Zhang, Q. Lu, Y. Yu, H. Xu, Y. Zhao and H. Zhang, Adv. Mater., 2015, 27, 7372–7378 CrossRef CAS PubMed.
- D. T. Lee, J. D. Jamir, G. W. Peterson and G. N. Parsons, Small, 2019, 15, e1805133 CrossRef PubMed.
- A. Kerour, S. Boudjadar, R. Bourzami and B. Allouche, J. Solid State Chem., 2018, 263, 79–83 CrossRef CAS.
- H. Lahmar, F. Setifi, A. Azizi, G. Schmerber and A. Dinia, J. Alloys Compd., 2017, 718, 36–45 CrossRef CAS.
- G. B. Deacon and R. J. Phillips, Coord. Chem. Rev., 1980, 33, 227–250 CrossRef CAS.
- A. H. B. Dourado, A. G. M. da Silva, F. A. C. Pastrián, R. L. Munhos, A. P. de Lima Batista, A. G. S. de Oliveira-Filho, J. Quiroz, D. C. de Oliveira, P. H. C. Camargo and S. I. Córdoba de Torresi, J. Catal., 2019, 375, 95–103 CrossRef CAS.
- K. Wan, A.-d. Tan, Z.-p. Yu, Z.-x. Liang, J.-h. Piao and P. Tsiakaras, Appl. Catal., B, 2017, 209, 447–454 CrossRef CAS.
- S. Tsujimura, M. Oyama, H. Funabashi and S. Ishii, Electrochim. Acta, 2019, 322, 134744 CrossRef CAS.
- Q. Wu, X. Zhang, Y. Lv, L. Lin, Y. Liu and X. Zhou, J. Mater. Chem. A, 2018, 6, 20347–20355 RSC.
- J. C. Yoon, J. Hwang, P. Thiyagarajan, R. S. Ruoff and J. H. Jang, ACS Appl. Mater. Interfaces, 2017, 9, 21457–21463 CrossRef CAS PubMed.
- P. Song, X. He, J. Tao, X. Shen, Z. Yan, Z. Ji, A. Yuan, G. Zhu and L. Kong, Appl. Surf. Sci., 2021, 535, 147755 CrossRef CAS.
- B. Li, X. Wang, L. Chen, Y. Zhou, W. Dang, J. Chang and C. Wu, Theranostics, 2018, 8, 4086–4096 CrossRef CAS PubMed.
- X. Zhang, X. Cui, Y. Sun, K. Qi, Z. Jin, S. Wei, W. Li, L. Zhang and W. Zheng, ACS Appl. Mater. Interfaces, 2018, 10, 745–752 CrossRef CAS PubMed.
- S.-Y. Yu, Y. Gao, F.-Z. Chen, G.-C. Fan, D.-M. Han, C. Wang and W.-W. Zhao, Sens. Actuators, B, 2019, 290, 312–317 CrossRef CAS.
- T. Steinbrecher, C. Zhu, L. Wang, R. Abel, C. Negron, D. Pearlman, E. Feyfant, J. Duan and W. Sherman, J. Mol. Biol., 2017, 429, 948–963 CrossRef CAS PubMed.
- T. Hiemstra, Geochim. Cosmochim. Acta, 2015, 158, 179–198 CrossRef CAS.
- A. Lenz and L. Ojamäe, Chem. Phys. Lett., 2006, 418, 361–367 CrossRef CAS.
- C. H. Lim, Y. H. Lee, Y. S. Kim, H. S. Choi and D. S. Seo, Inhalation Toxicol., 2018, 30, 247–254 CrossRef CAS PubMed.
- A. M. Api, D. Belsito, D. Botelho, M. Bruze, G. A. Burton Jr, J. Buschmann, M. L. Dagli, M. Date, W. Dekant, C. Deodhar, M. Francis, A. D. Fryer, L. Jones, K. Joshi, S. La Cava, A. Lapczynski, D. C. Liebler, D. O'Brien, A. Patel, T. M. Penning, G. Ritacco, J. Romine, N. Sadekar, D. Salvito, T. W. Schultz, I. G. Sipes, G. Sullivan, Y. Thakkar, Y. Tokura and S. Tsang, Food Chem. Toxicol., 2019, 134, 110604 CrossRef CAS PubMed.
- C. Liu, X. Li, Y. Li and X. Wen, Water, Air, Soil Pollut., 2020, 231, 331 CrossRef CAS.
- G. K. Paulus, L. M. Hornstra, N. Alygizakis, J. Slobodnik, N. Thomaidis and G. Medema, Int. J. Hyg. Environ. Health, 2019, 222, 635–644 CrossRef CAS PubMed.
- Q. Wang, P. Wang and Q. Yang, Sci. Total Environ., 2018, 621, 990–999 CrossRef CAS PubMed.
- E. Szekeres, A. Baricz, C. M. Chiriac, A. Farkas, O. Opris, M. L. Soran, A. S. Andrei, K. Rudi, J. L. Balcazar, N. Dragos and C. Coman, Environ. Pollut., 2017, 225, 304–315 CrossRef CAS PubMed.
Footnote |
| † Electronic supplementary information (ESI) available. See DOI: 10.1039/d1ra03049c |
| This journal is © The Royal Society of Chemistry 2021 |

