DOI:
10.1039/D1RA02847B
(Paper)
RSC Adv., 2021,
11, 24144-24155
In-plasma-catalysis for NOx degradation by Ti3+ self-doped TiO2−x/γ-Al2O3 catalyst and nonthermal plasma
Received
12th April 2021
, Accepted 30th June 2021
First published on 8th July 2021
Abstract
In an attempt to realize the efficient treatment of NOx, a mixed catalyst of Ti3+ self-doped TiO2−x and γ-Al2O3 was constructed by reducing commercial TiO2. The degradation effect on NOx was evaluated by introducing the mixed catalyst into a coaxial dual-dielectric barrier reactor. It was found that the synthesized TiO2−x could achieve considerable degradation effects (84.84%, SIE = 401.27 J L−1) in a plasma catalytic system under oxygen-rich conditions, which were better than those of TiO2 (73.99%) or a single plasma degradation process (26.00%). The presence of Ti3+ and oxygen vacancies in TiO2−x resulted in a relatively narrow band gap, which contributed to catalyzing deeply the oxidation of NOx to NO2− and NO3− during the plasma-induced “pseudo-photocatalysis” process. Meanwhile, the TiO2−x showed an improved discharge current and promoted discharge efficiency, explaining its significant activation effect in the reaction. Reduced TiO2−x could achieve an impressive degradation effect in a long-time plasma-catalysis process, and still maintained its intrinsic crystal structure and morphology. This work provides a facile synthesis procedure for preparing Ti3+ self-doped TiO2−x with practical and scalable production potential; moreover, the novel combination with plasma also provides new insights into the low-temperature degradation of NOx.
1. Introduction
Since the 1980s, with rapid economic development, environmental problems derived from an excess of nitrogen sources1 have become increasingly severe. As one of the important manifestations of excess nitrogen, NOx plays a key pollutant role in causing regional environmental problems such as acid rain, photochemical smog, and the greenhouse effect.2 NOx pollution mainly arises from industrial production activities like the preparation of phosphoric acid using the nitric acid method,3 which lead to much higher levels than the NOx produced in natural activities.4 Therefore, there is an urgent need to implement more effective NOx degradation methods to achieve a sustainable development model.
Due to its milder operating conditions, low-temperature plasma can generate high-energy electrons to bombard heavy particles when the macroscopic temperature is close to normal temperature, realizing a reaction process that could only occur at high temperature and high pressure under traditional conditions.5 NTP (non-thermal-plasma) has been widely used in present industrial production, pollution control and other fields, such as the surface etching of nano materials,6 dust-containing gas dust removal,7 high COD wastewater degradation,8 etc. Research studies on the direct degradation of NOx by low-temperature plasma were carried out as early as the 1990s,9 but were hampered by a low degradation efficiency, poor target selectivity, and the creation of by-products causing secondary pollution.10 With the aim of solving the above problems, the integration of heterogeneous catalysts with NTP and their subsequent synergistic effect have gradually become a current research hotspot.11–14
Low-temperature plasma-driven catalysis involves placing the catalyst in the discharge interval of the plasma reactor, wherein the catalyst could more directly utilize the high-energy electrons and active radicals generated during the plasma discharge process.15 The degradation modes of NOx can be divided into reductive degradation16 and oxidative degradation.17 The reductive degradation of NOx often requires the introduction of olefinic reducing gases to achieve good degradation effects at high temperatures.18,19 The application of N-type semiconductors in low-temperature plasma-driven catalysis has provided a new way to achieve oxidative degradation. Notably, a “pseudo-photocatalysis” behavior in the catalytic process is driven by the plasma, that is, the N-type semiconductor is activated by high-energy electrons in the plasma discharge interval, so that electron–hole pairs can be generated without a light source to degrade NOx. Meanwhile, the nature of the catalyst can also affect the discharge characteristics in the plasma discharge process, thereby affecting or even changing the degradation path.20 Therefore, the combination of the plasma and the embedded N-type semiconductor photocatalyst can feasibly synergistically promote the high-efficiency degradation of NOx.
TiO2 is regarded as a promising N-type semiconductor catalyst for industrial applications using photocatalysis due to its advantages of low-toxicity, chemical and thermal stability, and corrosion resistance.21,22 Chen et al.23 revealed the relationship between the band gap of an N-type semiconductor and the NOx degradation efficiency in the process of DBD (Dielectric Barrier Discharge) synergistic catalytic oxidation to remove NOx, thus it is very important to find a simple and effective modification method for TiO2. Recently, hydrogenated black titanium dioxide24–26 has aroused widespread research interest due to its narrow band gap and high-efficiency full-spectrum response characteristics. The reduction of TiO2 is different from the common modification methods of TiO2 (non-metal doping27–29 and noble metal doping30–32); herein abundant Ti3+ and oxygen vacancies was generated through Ti3+ self-doped method for reduced TiO2 to enhance the absorption of visible light. In addition, black titanium dioxide has high electrical conductivity and it is recognized as a photocatalyst with good prospects. Therefore, the application potential of reducing TiO2 in an in-plasma-catalysis process is worth exploring.
Inspired by the above ideas, we chose γ-Al2O3 as the carrier because of its good adsorption performance and regular morphology. The Ti3+ self-doped TiO2−x was prepared by a simple NaBH4 reduction process. We then investigated and compared the degradation effect of TiO2 before and after reduction in the plasma-driven catalysis process, and the discharge characteristics before and after the catalyst was placed in the discharge interval were analyzed to prove the synergy between the plasma and the catalyst. In order to further explain the reaction phenomena, we combined a variety of characterization and analysis methods to compare the physical and chemical properties of the TiO2 before and after reduction. The crystalline form and morphology changes of TiO2−x before and after the reaction were explored to verify the stability of the process. Meanwhile, ion chromatography was used to analyze the surface products of the catalyst after discharge, and a possible mechanism was proposed.
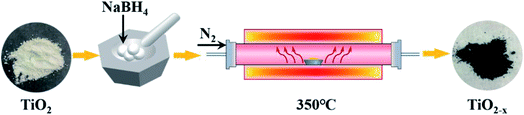 |
| | Fig. 1 Schematic diagram of the typical TiO2−x preparation process. | |
2. Experiments
2.1 Synthesis of Ti3+ self-doped TiO2−x
The catalysts used in this experiment include P25, TiO2 and TiO2−x. The P25 (particle size: 21 nm; purity: 99.50%) was produced by Evonik Deguset Chemical Co., Ltd, and TiO2 (anatase; particle size: 30 m; purity: 99.98%) was produced by Shanghai Aladdin Biochemical Technology Co., Ltd. The typical preparation process (Fig. 1) of Ti3+ self-doped TiO2−x was as follows: first, 2.00 g of commercial TiO2 and 4.00 g of NaBH4 (AR grade; purity: 98.00%) were weighed, and both were thoroughly ground in a mortar for 15 minutes. Then, the mixture was heated to 350 °C at a heating rate of 6–7 °C min−1 in N2, retained at 350 °C for 2 h, and then naturally cooled to room temperature. The calcined mixture was washed three times with a large amount of deionized water to remove unreacted NaBH4 and washed three times with absolute ethanol (AR grade) to prevent agglomeration. The mixed liquid was vacuum dried at 60 °C after decompression filtration to obtain black TiO2−x.
2.2 In-plasma-catalysis procedure for degrading NOx
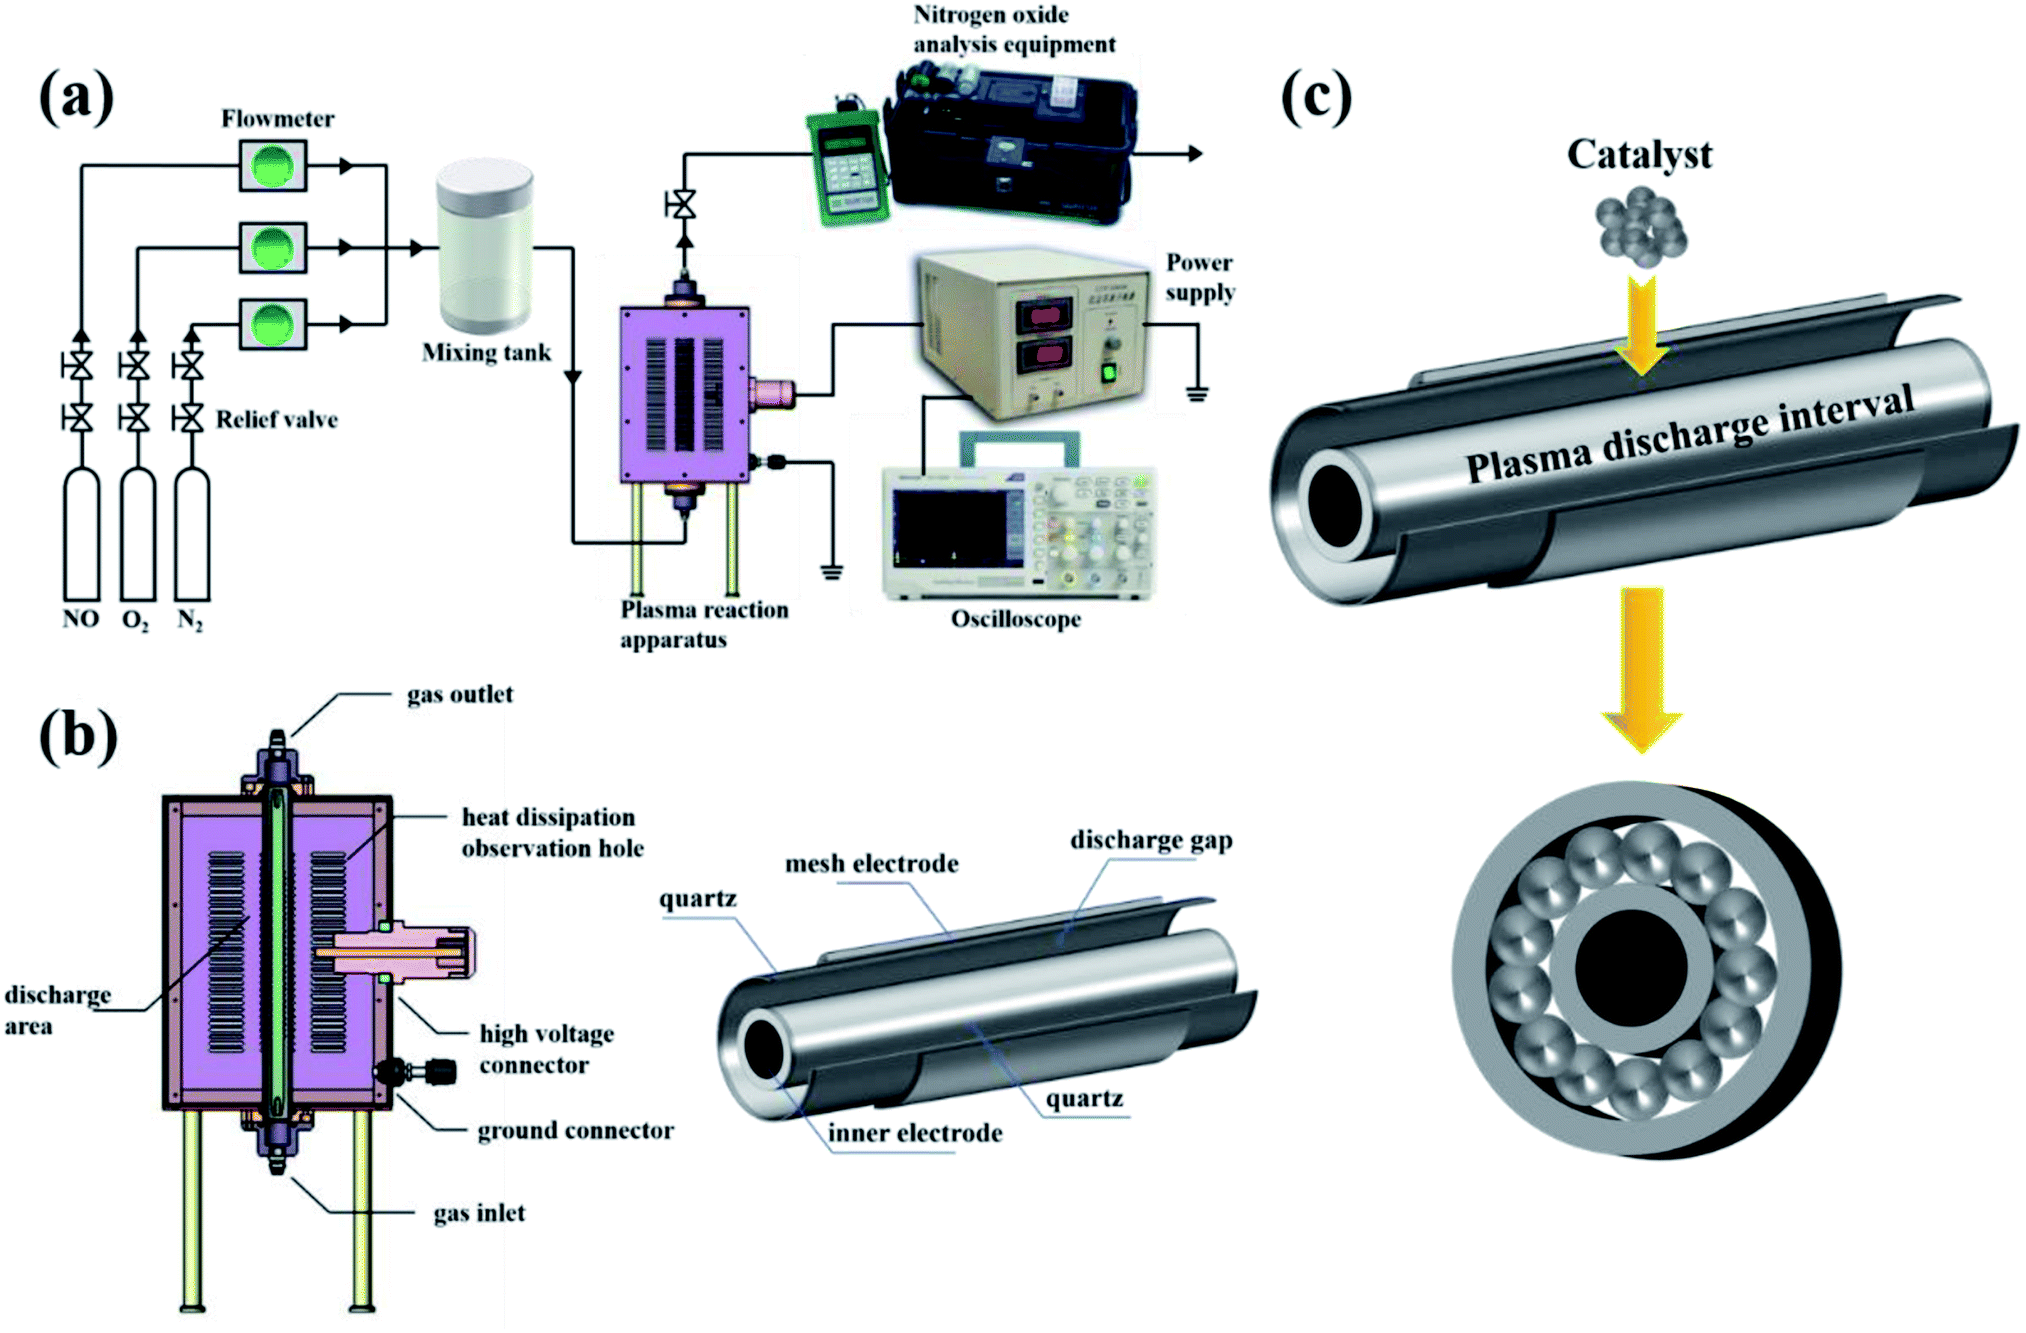
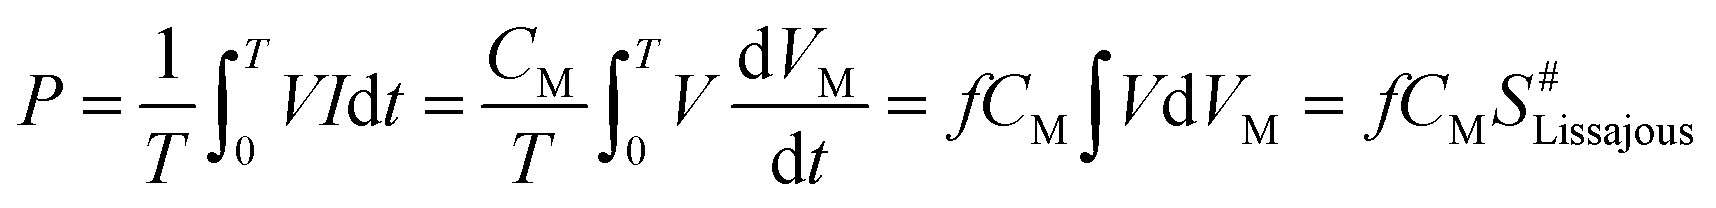
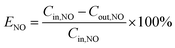
A schematic diagram of the in-plasma-catalysis procedure for degrading NOx is shown in Fig. 2(a). N2 (volume fraction: 99.999%), O2 (volume fraction: 99.999%) and NO (volume fraction: 10.000%; balanced gas: N2) were fully mixed in certain proportions in the gas cylinder as simulated gas, and the flow rate of the simulated gas was controlled by a mass flow control valve (MFC300, Wuxi Aitoly Electric Technology Co., Ltd.) at 1.50 L min−1. Based on the flue gas composition in industry,33 the N2 was considered as the background gas and the N2/O2/NO system was considered as the simulated gas in this work. As shown in Table 1, the NO concentration was controlled at 500 ± 10 ppm, the volume percentage of oxygen was controlled at 6 ± 0.05%, and the gas temperature at the inlet of the reactor was controlled at 25 °C, respectively. It is worth noting that before the start of the reaction, we first introduced N2 for one hour to remove the residual air in the reactor. As shown in Fig. 2(b) and Table 2, the dual dielectric coaxial DBD reactor used a quartz electrode (outer diameter: 12.00 mm) as a high-voltage electrode, the unilateral discharge gap of the device was 4 mm, and the outer quartz tube (outer diameter: 25.00 mm) was covered with a wire mesh with a length of 150.00 mm as a ground electrode. The plasma reactor was driven by a modulated pulse power system (CTP-2000K, Nanjing Suman Electronics Co., Ltd.), the output voltage range was 0–30 kV, the input pulse frequency was set to 75 Hz, and the input pulse duty cycle was set to 70%. In this experiment, the energy density (J L−1) was controlled by adjusting the output voltage. The current value, voltage value and waveform during the reaction were recorded by a digital oscilloscope (TBS1000B, Tektronix Technology Co., Ltd.). The output power (J s−1) in the reaction process was calculated using the area of the voltage–charge Lissajous figure.34 In order to evenly put the catalyst into the reactor, 1.50 g of catalyst and 15.00 g of commercial γ-Al2O3 pellets (particle size: 2 mm) were mixed vigorously in a constant temperature oscillator (TS-100B, Shanghai Jiecheng Experimental Instrument Co., Ltd.) for 10 minutes. In this way, the catalyst could be better supported on the γ-Al2O3 pellets, and the process of filling the catalyst into the DBD discharge interval is shown in Fig. 2(c).
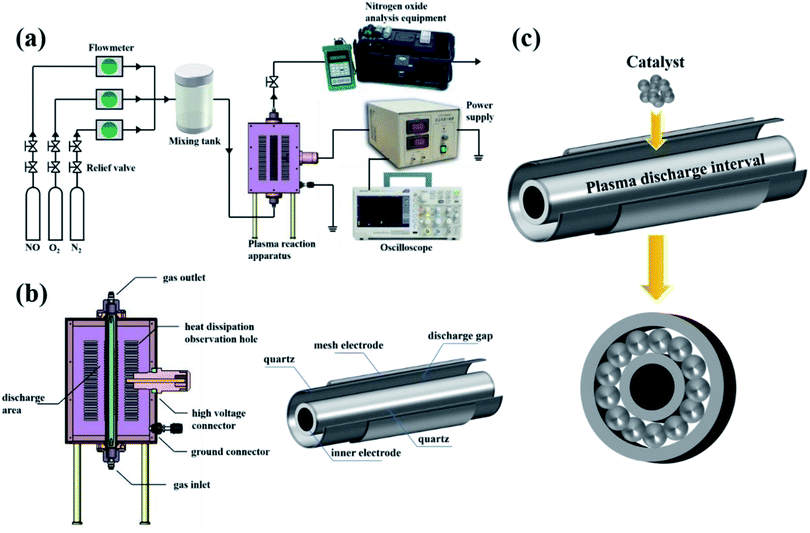 |
| | Fig. 2 (a) Schematic diagram of the in-plasma-catalysis procedure for degrading NOx. (b) Schematic diagram of a coaxial dual medium DBD reactor. (c) Schematic diagram of catalyst filling into the discharge interval. | |
Table 1 Gas composition of inlet gas in the experiment
| N2 (L min−1) |
O2 (L min−1) |
NO (mL min−1) |
O2 (%) |
NO (ppm) |
NO2 (ppm) |
NOx (ppm) |
T (°C) |
| 1.365 |
0.135 |
13.50 |
5.96 |
503 |
271 |
774 |
25.0 |
Table 2 Parameters of the coaxial dual medium DBD reactor
| Parameters of reactor |
Accurate value |
| Material of outer medium |
Quartz |
| Outer diameter of outer medium (mm) |
25.00 |
| Inner diameter of outer medium (mm) |
20.00 |
| Material of inner medium |
Quartz |
| Outer diameter of inner medium (mm) |
12.00 |
| Inner diameter of inner medium (mm) |
7.50 |
| Material of inner electrode |
Stainless steel |
| Outer diameter of inner electrode (mm) |
7.50 |
| Unilateral discharge gap (mm) |
4.00 |
| Length of discharge interval (mm) |
150.00 |
| Reactor volume (cm3) |
60.28 |
During the reaction, the concentrations of NO, NO2, and NOx and the oxygen volume fraction were measured by a flue gas analyzer (KM9206, Kane International Limited, UK). Since a thermocouple would interfere with the discharge phenomenon in the reactor, the temperature of the reaction process was measured by an infrared thermometer (AS700, Xima Technology Co., Ltd.). The levels of NO2− and NO3− on the surface of the catalyst were measured by ion chromatography (Dionex ICS-600, ThermoFisher Scientific).
2.3 Characterization of the catalyst
X-ray diffraction (EMPYREAN, PANalytical B.V.) was used to characterize the crystal form and phase of the catalyst. The target source was Cu Kα radiation (λ = 1.540598), and the scan was carried out between 15° and 90° at a rate of 0.4° s−1. Laser Raman spectrometry (LabRAM HR, HORIBA Jobin Yvon) was used to characterize the structure of the catalyst. The excitation source wavelength was 532.17 nm and the excitation wavelength range was 100–900 cm−1. Scanning electron microscopy (ZEISS Gemini 300, Carl Zeiss AG) was used to characterize the microscopic morphology of the catalyst. X-ray photoelectron spectrometry (Thermo Scientific K-Alpha, ThermoFisher Scientific) was used to characterize the surface elemental composition, valence state distribution and valence band information of the catalyst. Ultraviolet-visible spectrophotometry (UV-3600, Shimadzu Corporation) was used to analyze the light response range of the catalyst, and the test wavelength range was 200–800 nm. BET measurement (ASAP2460, McMuritik Instruments) was used to determine the specific surface area of the catalyst, and the pore size distribution of the catalyst was calculated according to the BJH (Barrett–Joyner–Halenda) model. EPR spectrometry (MiniScope MS5000 EPR spectrometer, Freiberg Instruments) was used to measure the electron spin resonance spectrum of the catalyst.
3. Results and disscuion
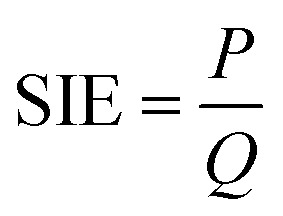
The specific input energy (SIE) can be defined using eqn (1) and (2) as follows.| |
 | (1) |
| |
 | (2) |
The NO removal efficiency (ENO) is defined in eqn (3).
| |
 | (3) |
The concentration of NOx is defined in eqn (4).
The NOx removal efficiency (ENOx) is defined in eqn (5).
| |
 | (5) |
3.1 Catalyst characterization
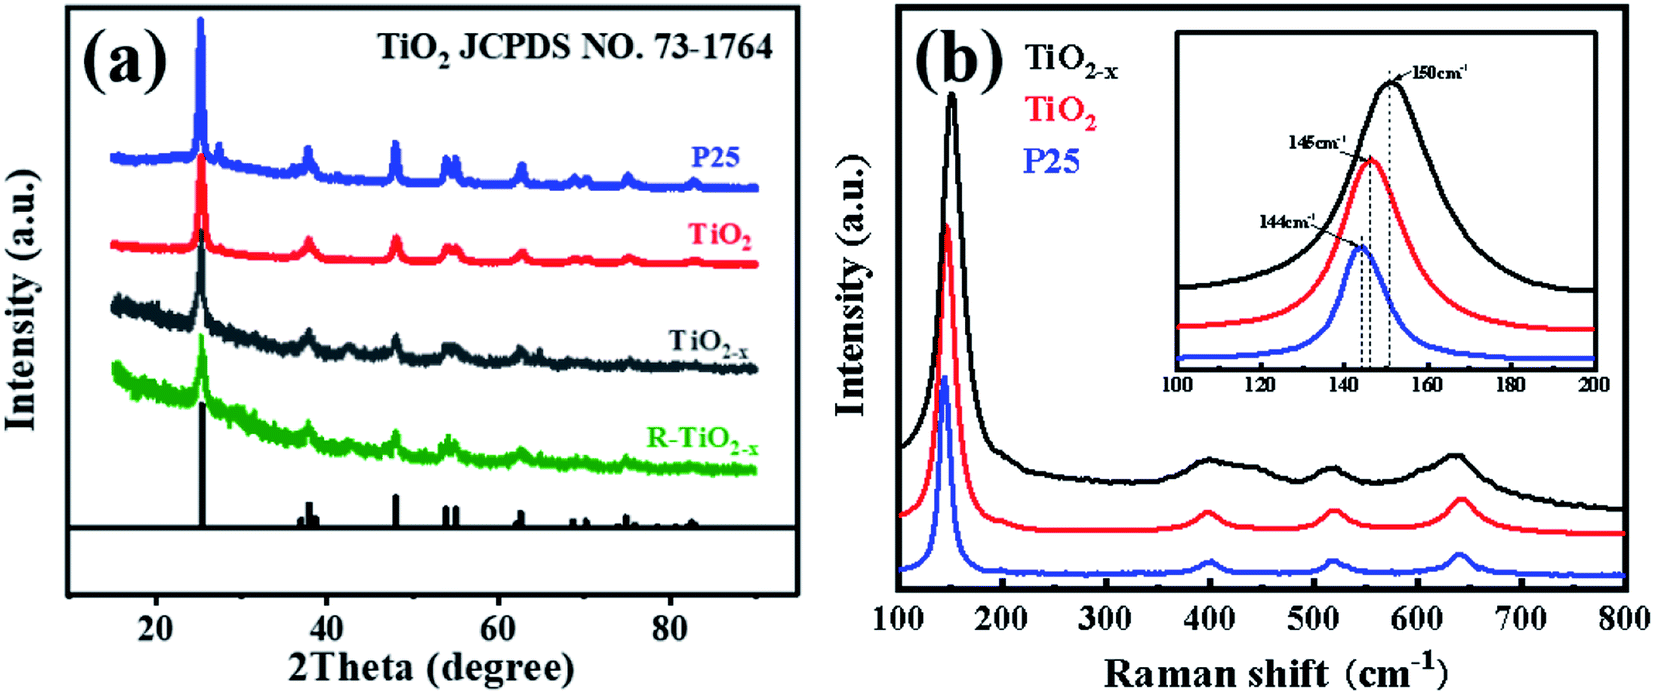
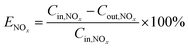
X-ray diffraction analysis clearly showed that the TiO2 and reduced TiO2−x were in anatase phases; the diffraction peaks at 2θ = 25.3°, 37.8°, 48.1°, 54.1°, 54.9°, 62.7°, 68.9°, 70.2° and 75.1° corresponded to the (101), (004), (200), (105), (211), (204), (116), (220) and (215) crystal planes of anatase TiO2, respectively (PDF card 731764, JCPDS). Commercial P25 contained a mixture of rutile and anatase phases. As shown in Fig. 3(a), the crystal form of TiO2−x still well maintained its crystalline structure during the reduction process using sodium borohydride at 350 °C. It could be found that the diffraction peaks of TiO2−x at 25.3°, 54.1°, and 54.9° became weaker and wider, which was caused by disorder of the crystal lattice caused by the formation of Ti3+ and oxygen vacancies.35 The X-ray diffraction pattern of the reacted TiO2−x further confirmed that the crystal structure of TiO2−x was relatively stable during the plasma discharge process (SIE = 680.2957 J L−1). Raman spectroscopy is an effective means to compare the structural differences of P25, TiO2 and TiO2−x, as shown in Fig. 3(b). The frequencies of the Raman active modes of the three titanium dioxides were approximately 144, 198, 399, 518, and 640 cm−1, which corresponded to the vibrations of the anatase phase.36 In the range of 100–200 cm−1, it could be seen that the Eg mode of the reduced TiO2−x appeared at 150 cm−1, which was higher than the frequency of commercial TiO2 (144 cm−1) because of the presence of oxygen vacancies.36
 |
| | Fig. 3 (a) XRD patterns of the catalysts. (b) Raman spectra of the catalysts. | |
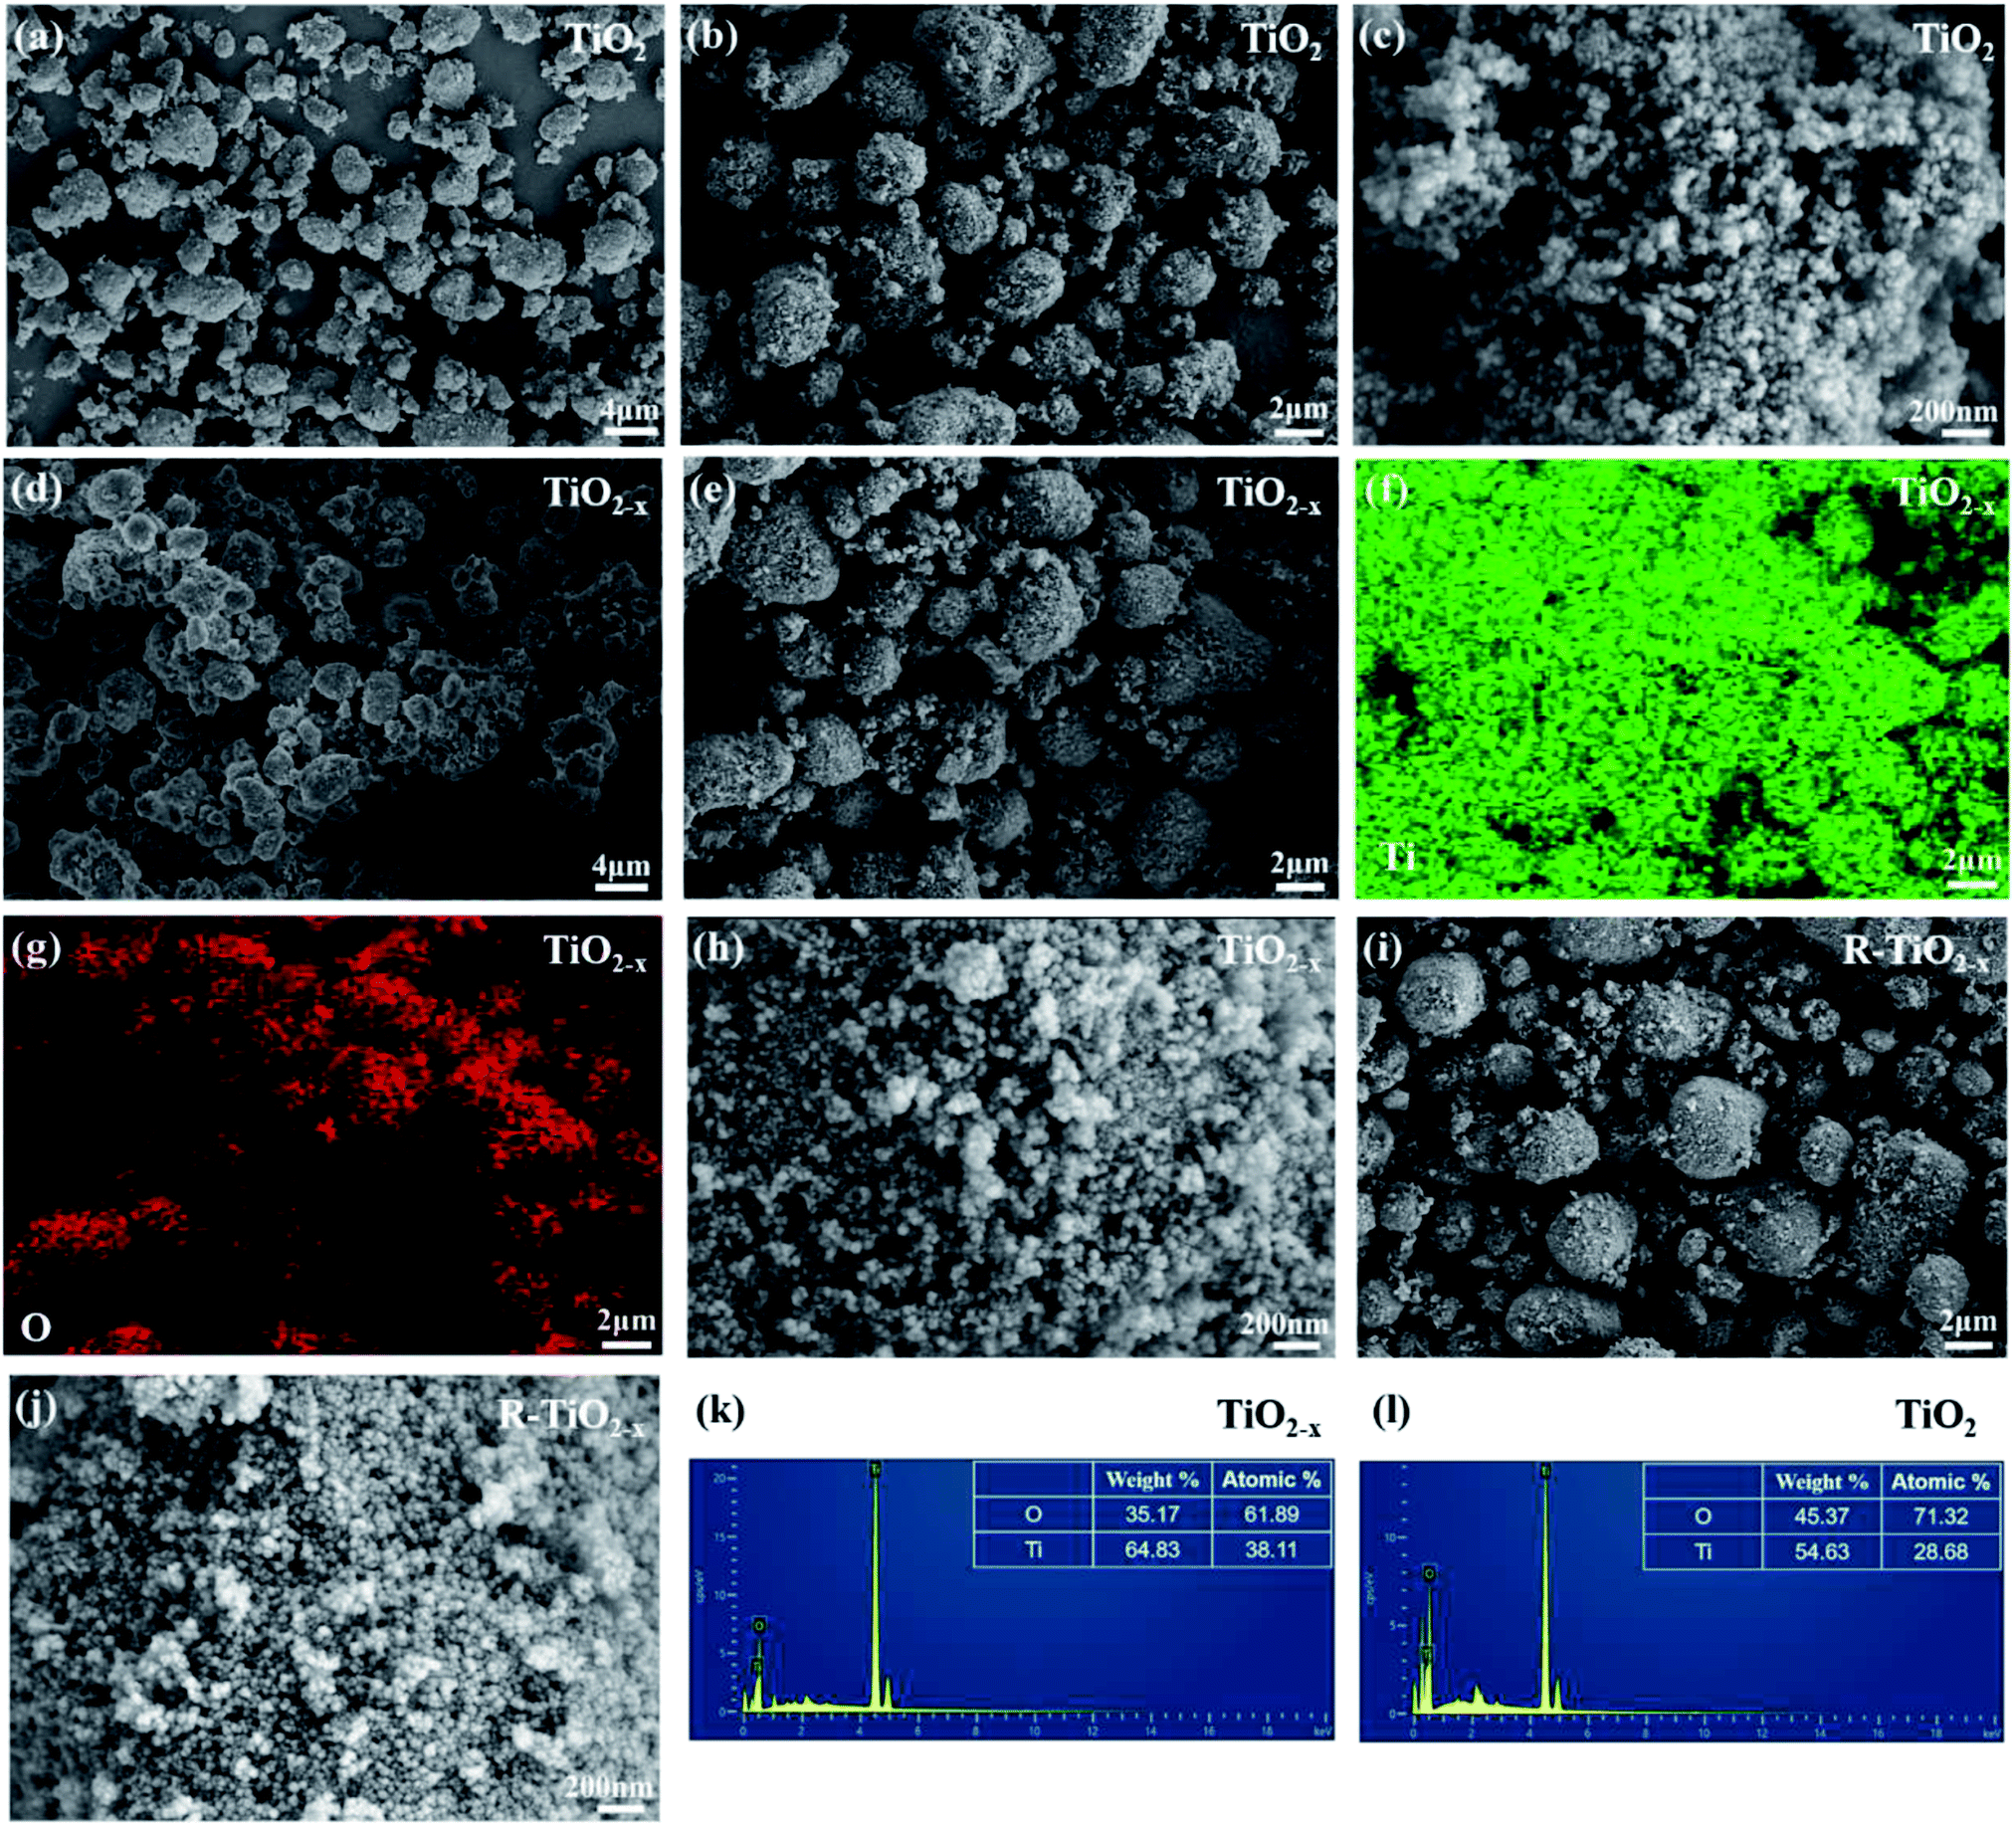
The morphologies and microstructures of the samples were investigated using scanning electron microscopy (SEM) and energy dispersive X-ray (EDX) analysis. As shown in Fig. 4, it was observed that the TiO2 samples before and after reduction were all composed of spherical particles, which showed no obvious deformation after reduction. The EDX analysis revealed a decrease in O content of TiO2−x, which was attributed to the existence of oxygen vacancies. It should be mentioned that the morphology of the reacted TiO2−x remained spherical, as shown in Fig. 4(i), which confirmed the morphological stability of TiO2−x during the DBD discharge process.
 |
| | Fig. 4 (a–c) SEM images of TiO2. (d–h) SEM images of TiO2−x. (f) Ti elemental mapping images of TiO2−x. (g) O elemental mapping images of TiO2−x. (i and j) SEM images of reacted TiO2−x. (k) EDX images of TiO2−x. (l) EDX images of TiO2. | |
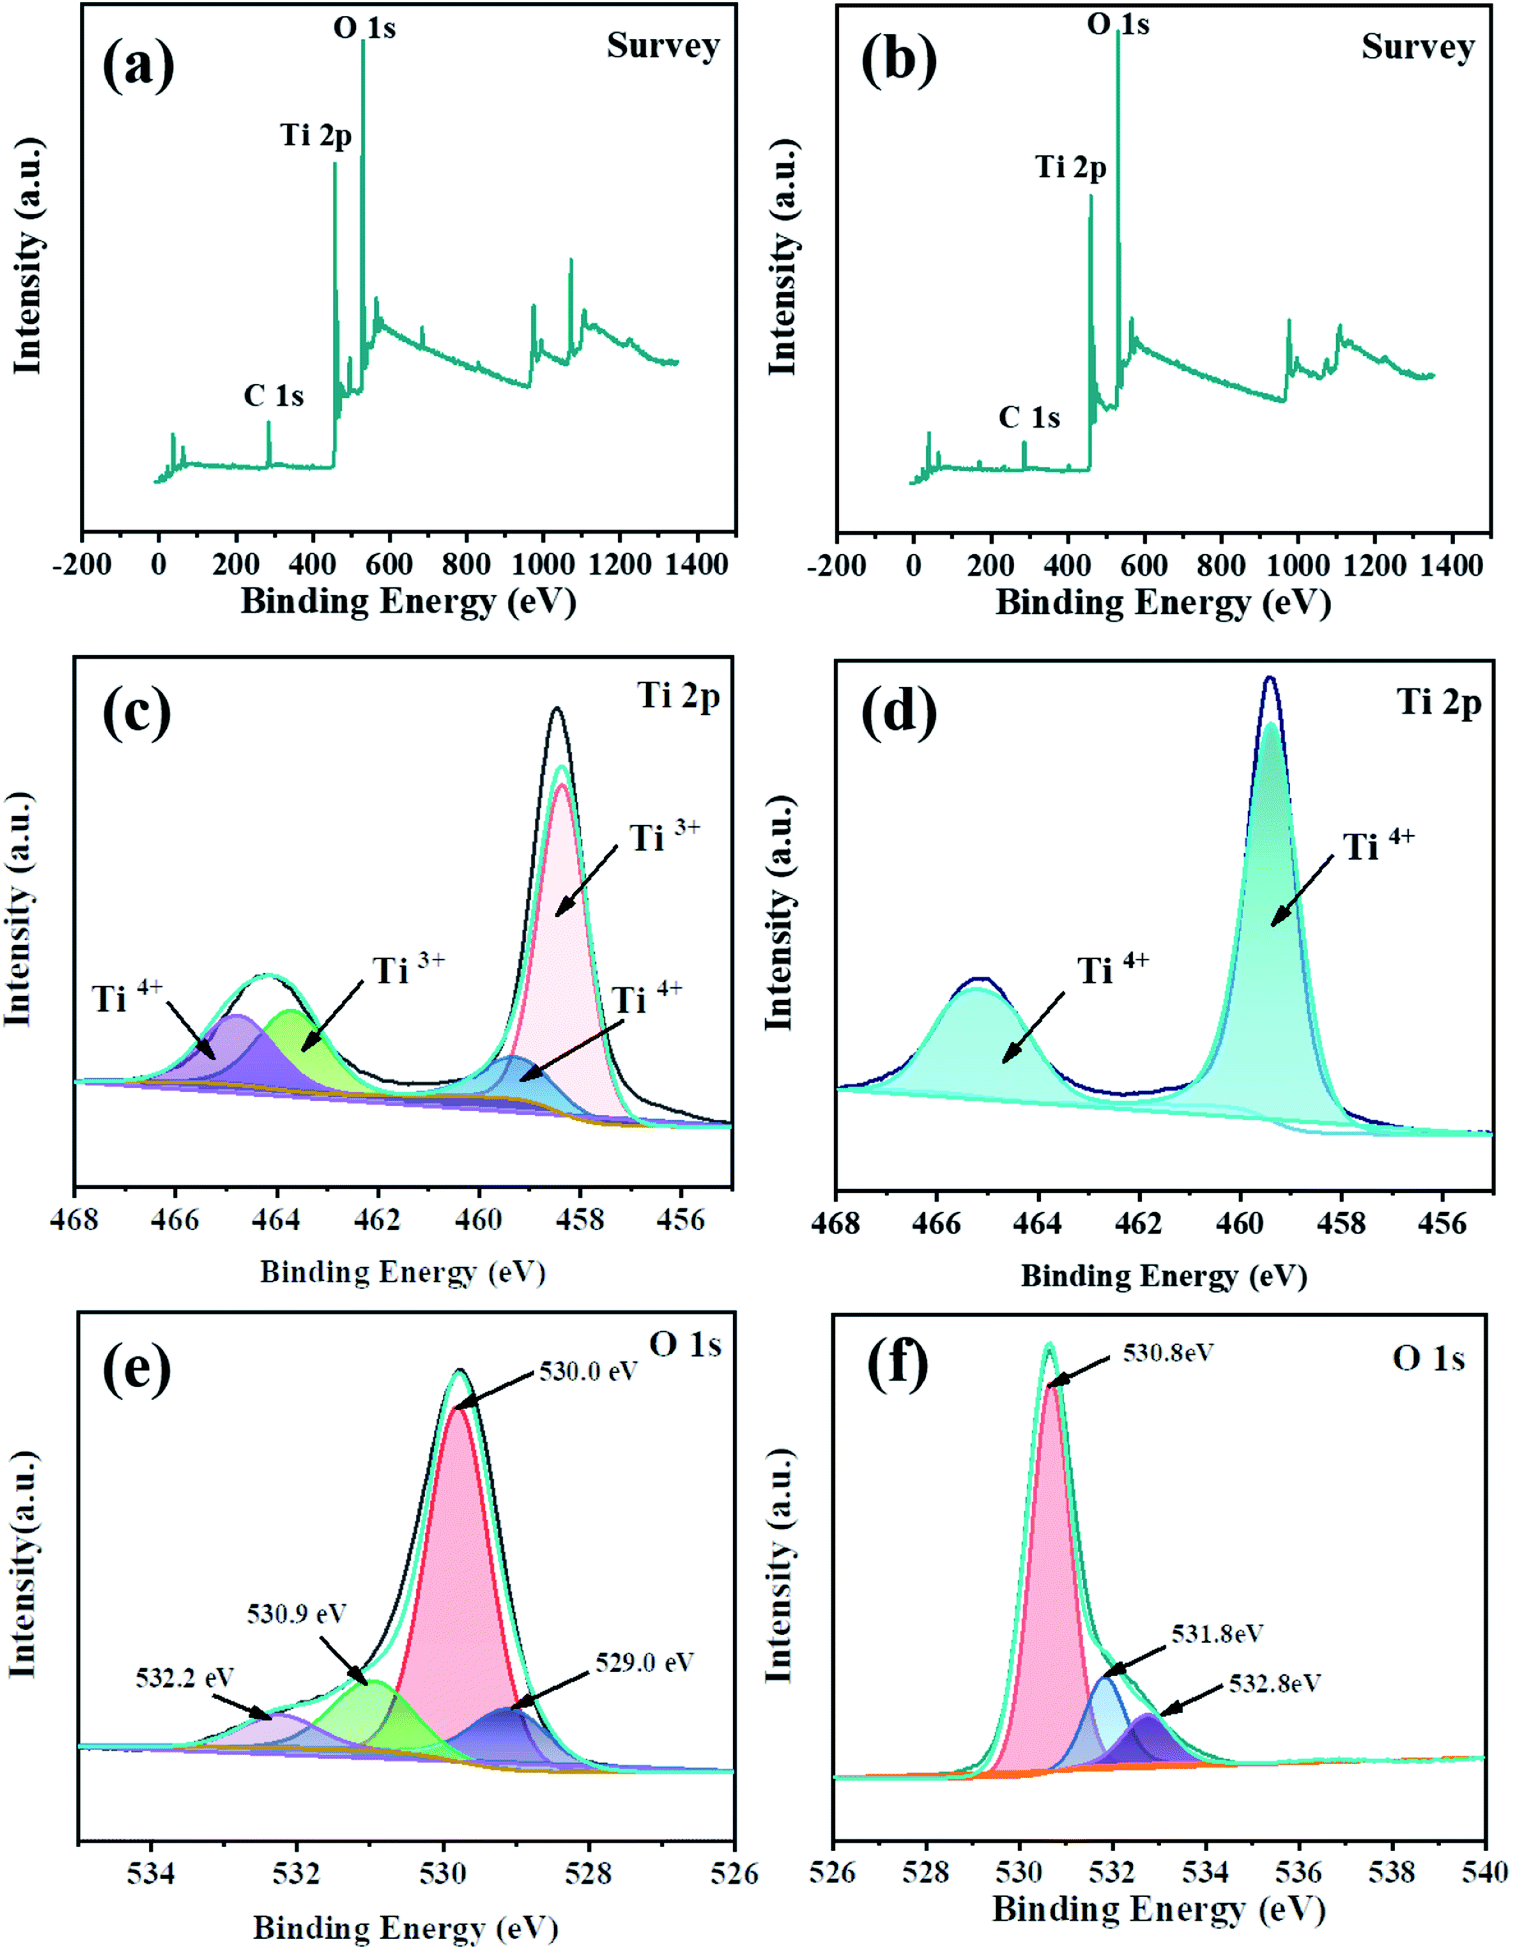
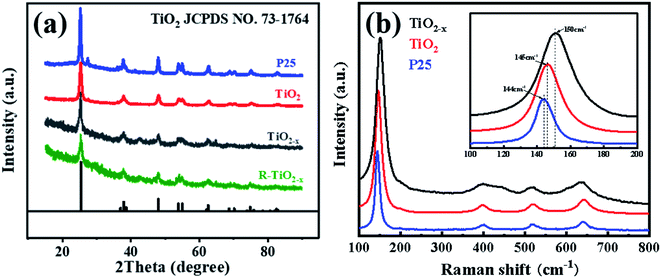
The XPS survey scan further confirmed the successful doping of Ti3+. Deconvolution of the Ti 2p profile of TiO2 (Fig. 5(d)) revealed two peaks at 459.0 and 465.0 eV, respectively, which indicated the presence of Ti4+. On the other hand, the Ti 2p spectrum (Fig. 5(c)) of TiO2−x exhibited two new peaks (458.4 and 463.9 eV), which were attributed to the successful implantation of Ti3+. Deconvolution of the O 1s profile of TiO2−x (Fig. 5(e)) revealed four peaks at 529.4, 530.0, 530.9 and 532.2 eV, which corresponded to Ti3+–O, Ti–OH, surface defects and peroxide groups, respectively, which indicated that there were oxygen vacancies in TiO2−x. Due to the limited methods for quantitatively determining the concentration of oxygen vacancies,37 we focused on qualitatively verifying the existence of oxygen vacancies in TiO2−x. It is worth noting that research studies38,39 reported the binding energy of N 1s of N-doped TiO2−x to be around 400.0 eV. As shown in Fig. 5(a), the XPS spectrum of TiO2−x verified that the preparation method adopted in this work did not lead to the doping of N, and N2 played the role of providing a protective atmosphere during the preparation process.
 |
| | Fig. 5 XPS spectra of the catalysts (a, c, e: TiO2−x; b, d, f: TiO2). | |
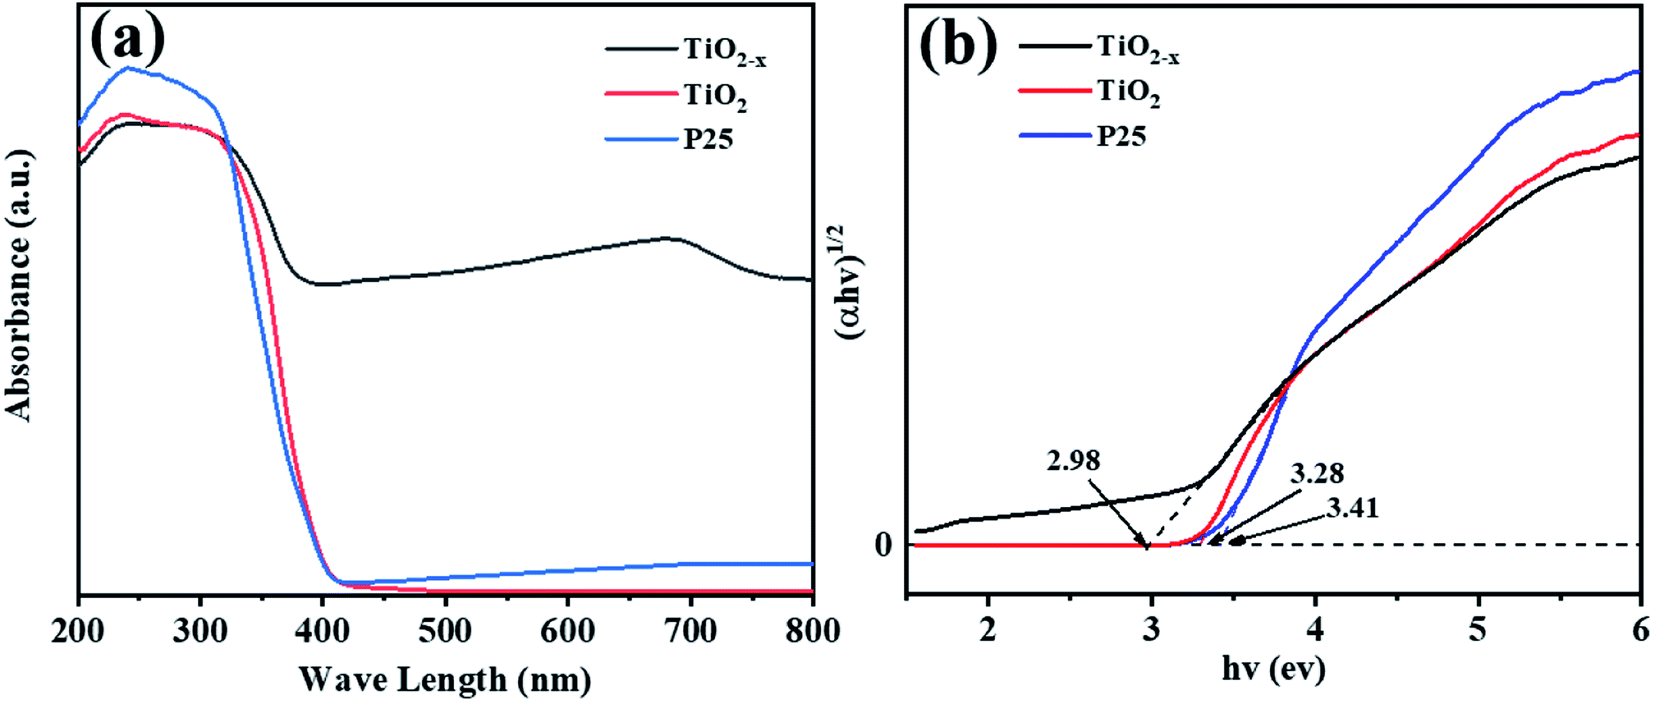
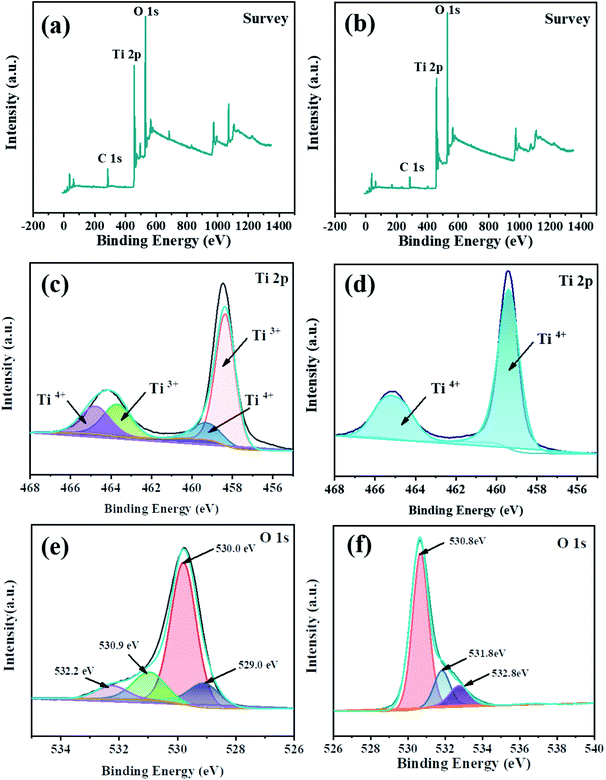
Compared with commercial TiO2, the reduced TiO2−x has considerable photoresponse characteristics in the ultraviolet-visible light spectrum. As shown in Fig. 6(a), the absorption peak in the range of 400–800 nm of TiO2−x was significantly higher than that of the other two catalysts, which was consistent with the black color of TiO2−x. Meanwhile, considerable visible light absorption also provided direct proof that TiO2−x contained a large number of oxygen vacancies.40 The band gap of TiO2−x was found to be 2.98 eV, which was lower than that of commercial TiO2 (3.29 eV), as shown in Fig. 6(b). This was due to the variation induced by the self-doped Ti3+ that increased an isolated energy level in the band gap of TiO2, rather than shifting the valence band or conduction band position, which is caused by doping other atoms.41
 |
| | Fig. 6 UV-vis spectra of P25, TiO2 and TiO2−x. | |
Table 3 Specific surface area and pore volumes of the catalysts
| |
TiO2 |
TiO2−x |
| Specific surface area (m2 g−1) |
105.2569 |
101.1016 |
| Pore volume (cm3 g−1) |
0.2960 |
0.3367 |
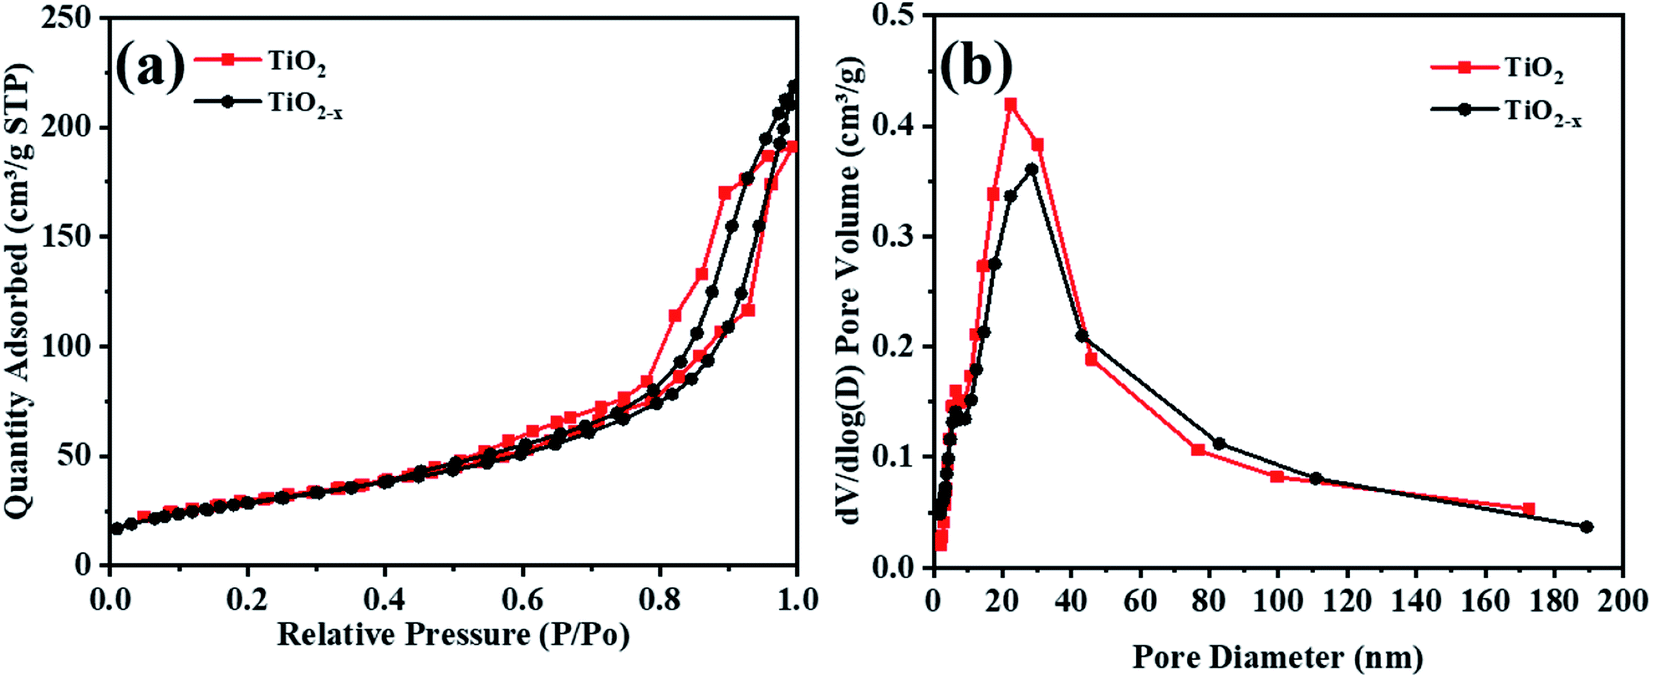
The N2 adsorption–desorption isotherms and pore size distributions of the original TiO2 and reduced TiO2−x are shown in Fig. 7. The isotherms of TiO2 and TiO2−x are both type IV isotherms with H2-type hysteresis loops, and the capillary condensation phenomenon under higher pressure proved that both catalysts are mesoporous materials. According to the BJH (Barrett–Joyner–Halenda) model, the pore size distribution and specific surface area of the catalysts were calculated (Table 3). It was found that the pore size distributions of TiO2 and TiO2−x both mainly located in the range of 2–50 nm, indicating that both of the materials possess mesoporous structures. Additionally, the specific surface areas of the two materials were relatively similar, which corresponded well with the SEM results, implying that the physical structure remained basically unchanged after reduction treatment.
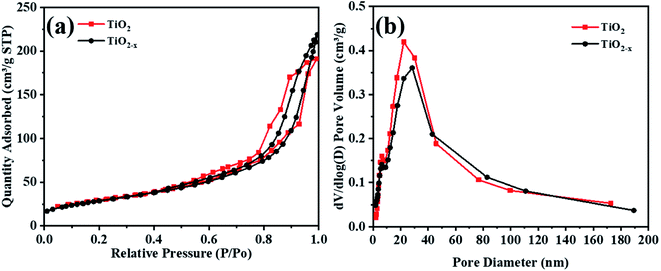 |
| | Fig. 7 BET analysis of TiO2 and TiO2−x. | |
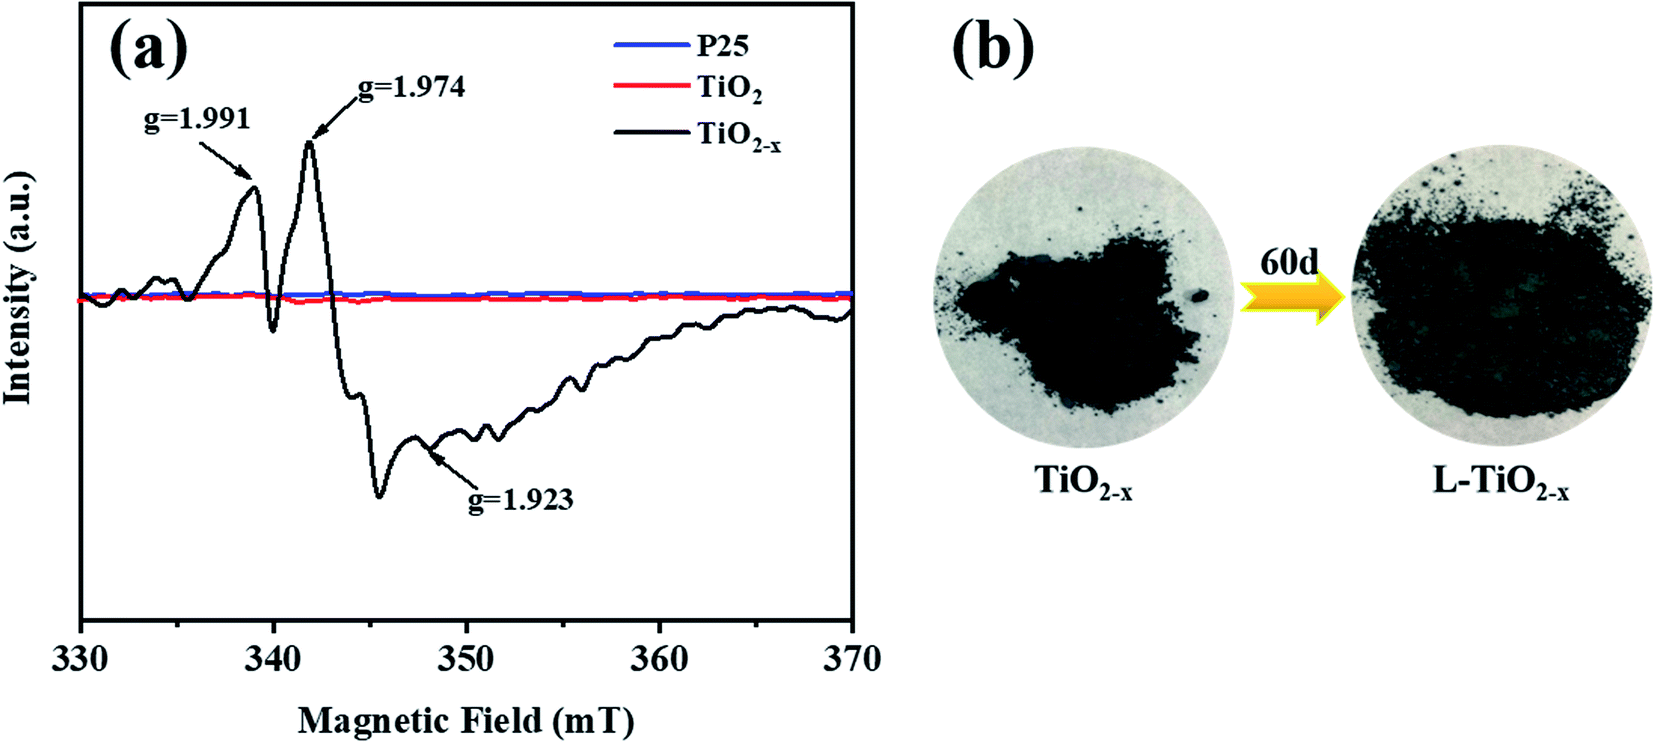
The electron paramagnetic resonance (EPR) spectrum was used to further identify the existence of Ti3+ and oxygen vacancies, as shown in Fig. 8(a). According to the spectrum, TiO2−x produced strong signals at g = 1.991, 1.974 and 1.923. In contrast, the EPR spectra of the unreduced TiO2 and P25 did not produce strong paramagnetic signals. For TiO2−x, the signal of g = 1.991 may come from oxygen vacancies, which arose due to the removal of oxygen atoms from the lattice of TiO2 during the reduction of TiO2.42 The signals generated at g = 1.974 and g = 1.923 may be caused by electrons trapped by the lattice Ti3+.43 It is worth mentioning that the samples characterized were stored at room temperature for two months without any fading phenomenon and still showed strong paramagnetic signals, indicating the stability of Ti3+ inside TiO2−x.
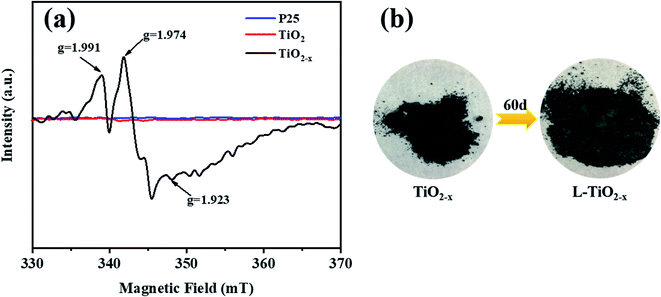 |
| | Fig. 8 (a) EPR pattern of P25, TiO2 and TiO2−x. (b) Physical picture of the color of TiO2−x changing over time. | |
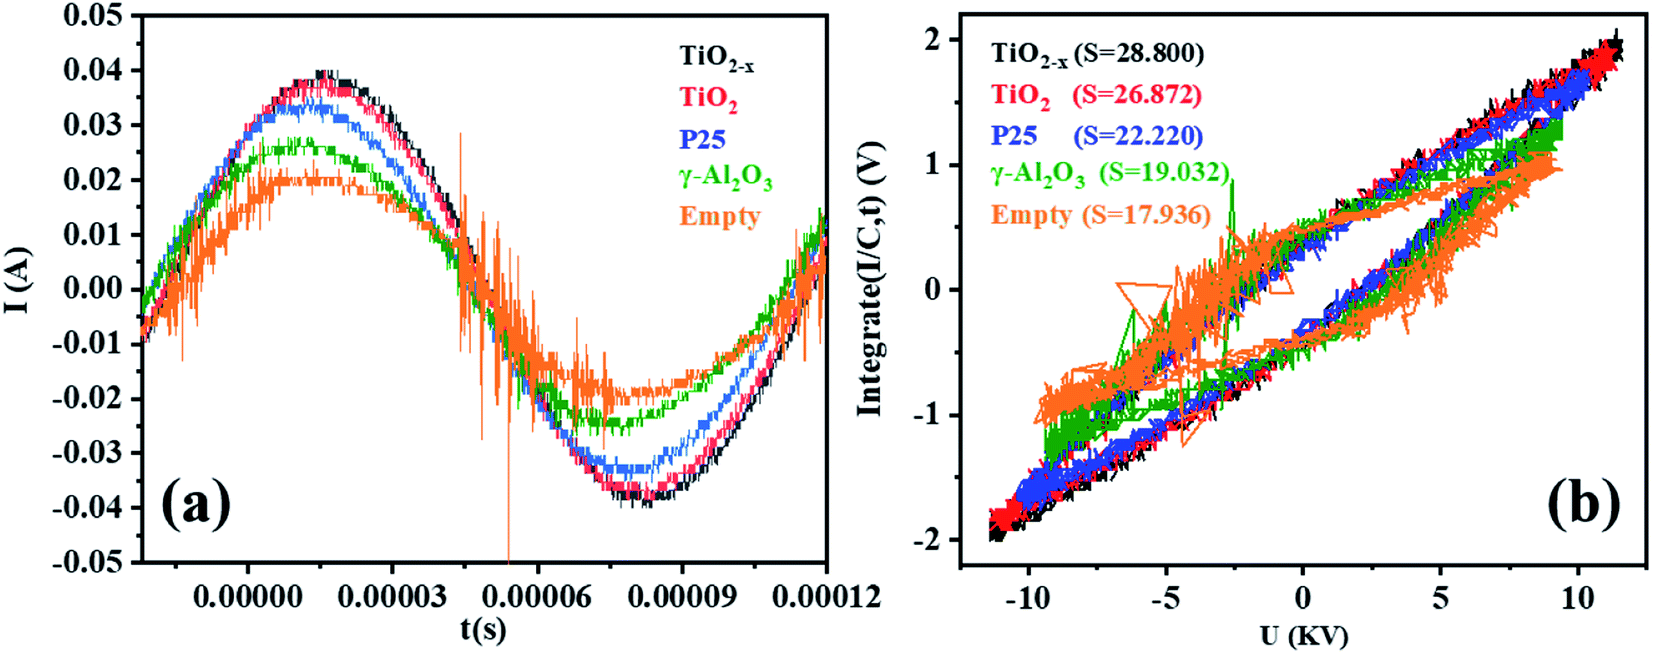
3.2 Discharge characteristics
Micro-discharges formed in the pores of the catalyst in the in-plasma-catalysis process, thereby affecting the discharge process. It is worth noting that the discharge brightness of γ-Al2O3 and the other catalysts filled into the reactor showed an obvious decrease, which was due to the shortening of the discharge gap by the spherical medium. In this case, the filamentary discharge mode was transformed into a combination of the particle surface discharge mode and space gap filamentary discharge mode.44 As shown in Fig. 9(a), compared with the discharge current of the empty tube, the discharge current signals under the co-operation of the catalysts were significantly enhanced. It is noted that the dielectric barrier discharge reactor was equivalent to a capacitor, and the discharge characteristics were mainly affected by the dielectric barrier material, the discharge gap, and the relative dielectric constant of the filling medium.45 The dielectric constants of commercial TiO2 (anatase) and γ-Al2O3 were 48 and 12.6, respectively. Therefore, the catalysts containing TiO2−x accumulated more charges on the surface of the dielectric barrier, thereby enhancing the entire electric field.46 Moreover, as shown in Fig. 9(b), the discharge output power measured by the V–Q Lissajous method34 showed that the discharge efficiency after the introduction of the catalyst was higher than that without the introduction of the catalyst. This indicated that with the introduction of the titanium-based catalyst, most of the applied voltage was used for gap discharge during the plasma discharge process under the condition of a certain input power.
 |
| | Fig. 9 (a) Current–time curves of different catalysts in a single discharge cycle in the DBD reactor (single cycle). (b) Lissajous figures of different catalysts in the DBD reactor (single cycle). | |
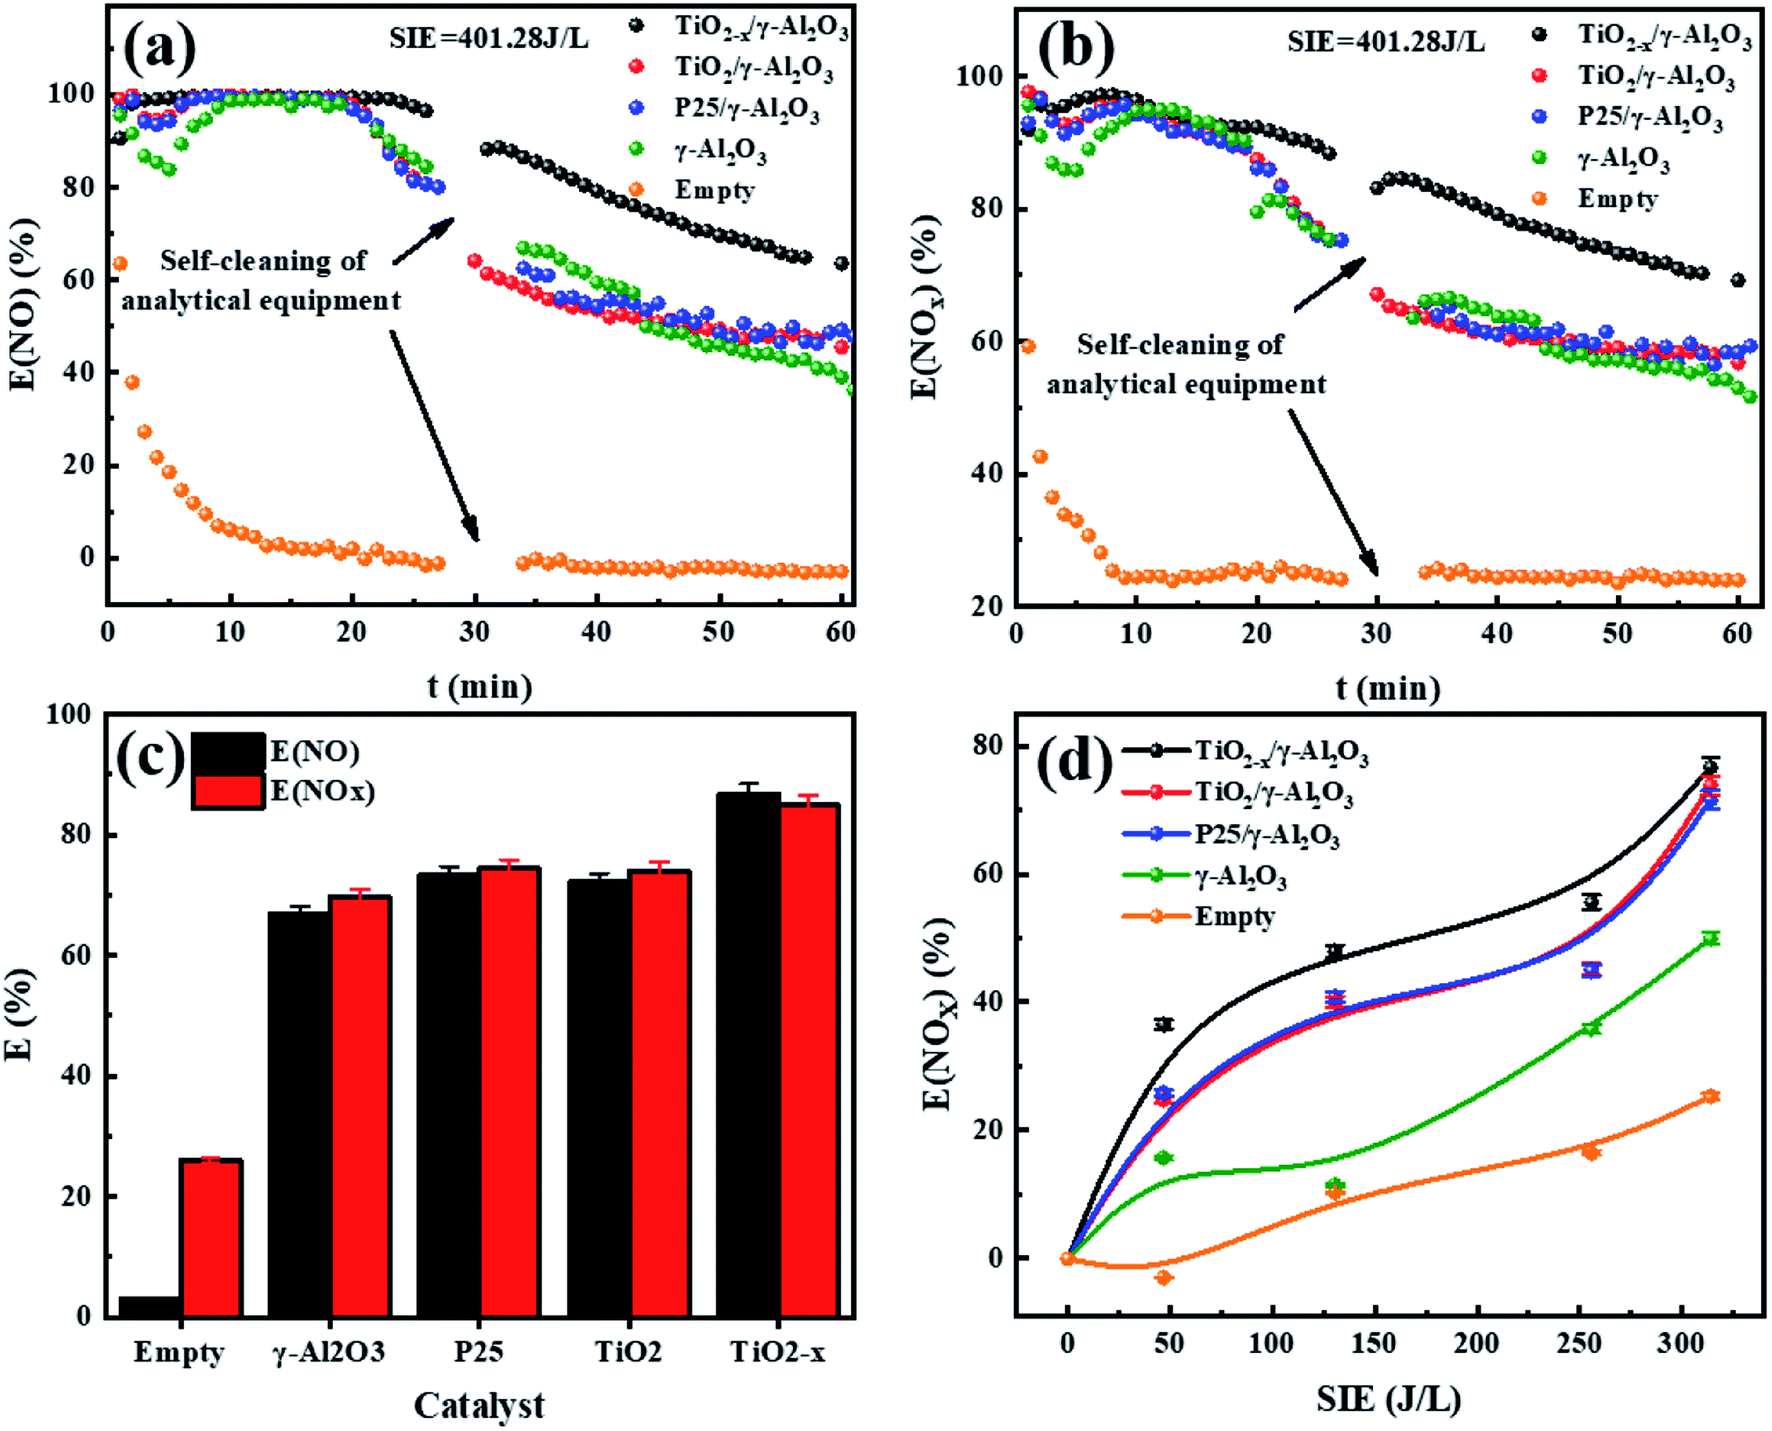
3.3 Effect of NOx degradation by the catalyst
The performance of the catalysts was evaluated by an experiment using the in-plasma-catalysis procedure. First of all, regardless of whether there were catalysts in the plasma, the degradation efficiency showed a positive correlation with the specific input energy. This was due to the high electron density at high power, which led to an increase in the frequency of ionization and decomposition of NOx. The effect of introducing four kinds of catalysts to degrade NOx is shown in Fig. 10. TiO2−x/γ-Al2O3 exhibited an 86.69% NO degradation effect (average in 1 h) and 84.84% NOx degradation effect (average in 1 h) at 401.27 J L−1, which was better than that of TiO2/γ-Al2O3 (72.14% NO degradation effect and 73.99% NOx degradation effect at 401.27 J L−1). Moreover, the empty tube reactor without any catalysts had the worst degradation effect on NO and NOx, where the higher oxygen content contributed to the not expected re-production of NO and NOx, delivering degradation efficiencies (SIE = 401.27 J L−1) of 2.91% and 26.00%, respectively. We believe that the main reason for the optimal degradation effect of TiO2−x may be that its lower band gap made it easier to excite, thus the catalytic effect of TiO2−x exceeded that of the typical TiO2. Meanwhile, its adsorption ability of ultraviolet light and visible light in a wider wavelength range made it more likely to generate abundant “electron holes” and ˙OH to oxidize NOx. In consideration of the similar morphology and crystal type of TiO2−x and TiO2, we explain the promoted NOx oxidation by TiO2−x as due to the high concentration of oxygen vacancies and Ti3+. Combined with the absorption of γ-Al2O3, TiO2−x synergized with plasma to achieve an improved NOx degradation effect.
 |
| | Fig. 10 (a) Real-time monitoring of NO degradation by plasma synergized with different catalysts (SIE = 401.28 J L−1). (b) Real-time monitoring of NOx degradation by plasma synergized with different catalysts (SIE = 401.28 J L−1). (c) 1 h average degradation rate of different catalysts (SIE = 401.28 J L−1). (d) Different kinds of catalysts degrade NOx under different specific input energies. | |
In order to further test the feasibility of the DBD synergy with TiO2−x in practical operation, a long-term cyclic degradation of NOx performance test was carried out. TiO2−x could achieve a long lasting and efficient degradation of NOx through water washing regeneration, as shown in Fig. 11(a). Ion chromatography (IC) was applied to measure the products accumulated on the catalyst surface during the degradation of NOx. As shown in Fig. 11(b), the main products on the catalyst surface were NO2− and NO3−. It was observed that the change trend of NO2− and NO3− contents on the surface of different catalysts was consistent with that of the NOx degradation effect. Herein, the degradation products of the empty tube were detected by introducing glass beads (SiO2) into the discharge interval, and it could be observed that the NO3− content on the surface was very low and the presence of NO2− was not detected. For the in-plasma-catalysis system, it could be observed that the content of NO3− and NO2− on the surface of the Ti-based catalyst was higher than that of γ-Al2O3 during the discharge process, which confirmed that the photocatalyst containing TiO2−x was activated in the plasma field to achieve the deep oxidation of NOx. Previous researchers47 have pointed out that the intensity of ultraviolet rays generated during the plasma discharge process is basically insufficient to excite the photocatalytic process. Meanwhile, Chen et al.23 believed that one of the key factors in the process of plasma-assisted N-type semiconductor catalysis was the forbidden band width of the catalyst. Thus, TiO2−x has a lower forbidden band gap that positively accelerates the catalysis process of the plasma-assisted N-type semiconductor.
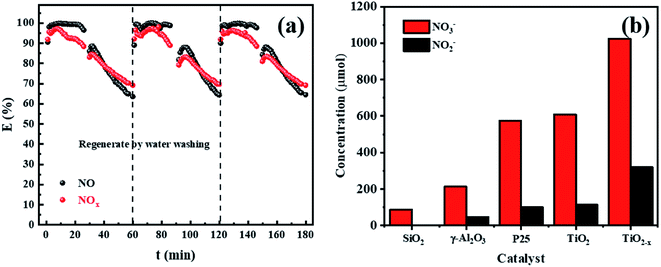 |
| | Fig. 11 (a) Long-term cyclic degradation of NOx performance test of TiO2−x. (b) Levels of NO3− and NO2− on the surface of different catalysts after discharge. | |
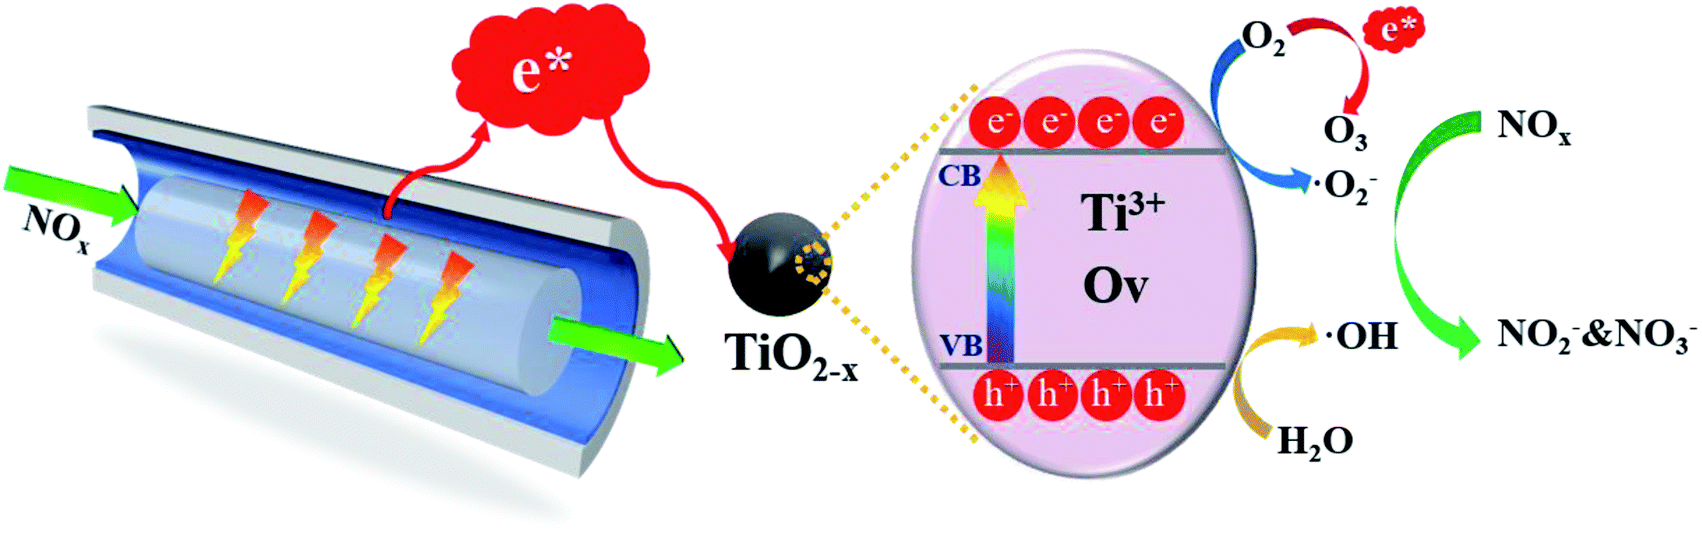
3.4 Mechanism of NOx degradation
3.5.1 TiO2−x driven by low-temperature plasma. On the basis of the above discussion, a possible reaction mechanism for the in-plasma-catalysis process achieved by TiO2−x/γ-Al2O3 is shown in Fig. 12. Firstly, the plasma provided a large number of high-energy electrons, which excited TiO2−x to generate electron–hole pairs (e− and h+) through the “pseudo-photocatalytic” process. Electrons and holes respectively reacted with H2O/O2 on the surface of TiO2−x to generate large amounts of ·OH and ·O2−. The NO absorbed on the surface of TiO2−x was firstly oxidized to NO2 by the generated ·OH, and then to NO2− and NO3−. Meanwhile, the NO2 adsorbed on the surface of TiO2−x was directly oxidized to NO2− and NO3− by the generated ·OH. In addition, a certain concentration of O3 was produced during the discharge process, which further promoted the oxidation of NOx. The importance of ·OH was emphasized in this work, however no water was introduced into the experimental process. It is worth noting that the air tightness of the reaction device was good, and the catalysts were all dried. We believe that the water in the reaction process may come from the cylinder gas, or surface adsorbed water on the catalysts or the reactor.48–50 The XPS spectrum of Fig. 5(e) also supported the possibility of adsorbed water on the catalyst surface.51 It is worth noting that the introduction of TiO2−x/γ-Al2O3 into the in-plasma-catalysis process improved the electric field intensity and energy density of the plasma discharge to a certain extent, thereby increasing the average electron energy and making TiO2−x easier to excite.
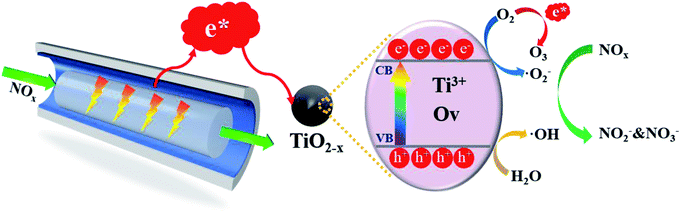 |
| | Fig. 12 Schematic diagram of the reaction mechanism of the catalytic degradation of NOx by. | |
4. Conclusions
Ti3+ self-doped TiO2−x was successfully constructed through a simple and gentle NaBH4 reduction process, and the existence of Ti3+ and oxygen vacancies was confirmed by a variety of characterization methods. Compared with the plasma alone, the introduction of TiO2−x/γ-Al2O3 into the system effectively improved the discharge intensity and energy efficiency of the reactor, achieving a considerable degradation effect on NOx. The in-plasma-catalysis process achieved by TiO2−x/γ-Al2O3 exhibited 86.69% NO and 84.84% NOx degradation effects at 401.27 J L−1. It was confirmed that TiO2−x has a smaller forbidden band width, and more abundant Ti3+ and oxygen vacancies, enabling it to exhibit a better and more stable degradation effect when compared to the characteristics of TiO2 before and after reduction. Moreover, the rapidly increased levels of NO3− and NO2− on the surface of the catalysts further confirmed the superiority of TiO2−x. The innovative combination of plasma and Ti3+ self-doped TiO2−x should inspire more opportunities for low-temperature NOx degradation. Furthermore, herein, a facile synthesis procedure of TiO2−x was provided for industrial applications.
Nomenclature
| P | Discharge power, W |
| T | Discharge cycle, s |
| V | Discharge voltage between electrodes, V |
| I | Discharge current, A |
| CM | Additional capacitance, F |
| VM | Voltage at both ends of the additional capacitor, V |
| f | Power frequency, Hz |
| SLissajous | Area of Lissajous figure |
| SIE | Specific input energy, J L−1 |
| Q | Gas flow, L min−1 |
| Cin,NO | NO concentration at the inlet of the reactor, ppm |
| Cout,NO | NO concentration at the outlet of the reactor, ppm |
| Cin,NOx | NOx concentration at the inlet of the reactor, ppm |
| Cout,NOx | NOx concentration at the outlet of the reactor, ppm |
Conflicts of interest
There are no conflicts to declare.
Acknowledgements
The authors gratefully acknowledge financial support from the Chinese National Key Research and Development Plan (2018YFC1900203-03), Chinese National Natural Science Foundation (21776181), Sichuan University innovation spark project (2018SCUH0012), Special Fund Project for Cooperation between Sichuan University and Panzhihua City (2018CDPZH-12) and Science and Technology Plan Project of Sichuan Province (2021YFG0285).
References
- D. R. Kanter and T. D. Searchinger, Nat. Sustain., 2018, 1, 544–552 CrossRef.
- X. J. Liu, W. Xu, E. Z. Du, A. H. Tang, Y. Zhang, Z. Wen, T. X. Hao, Y. P. Pan, L. Zhang, Y. Zhao, J. L. Shen, F. Zhou, Z. L. Gao, Y. H. Chang, K. Goulding, J. L. Collett, Jr, P. M. Vitousek, F. S. Zhang, Y. Y. Zhang, B. J. Gu and Z. Z. Feng, Philos. Trans. R. Soc., A, 2020, 378, 1–23 Search PubMed.
- F. Lin, Z. Wang, Z. Zhang, Y. He, Y. Zhu, J. Shao, D. Yuan, G. Chen and K. Cen, Chem. Eng. J., 2020, 382, 123030–123059 CrossRef CAS.
- X. Lu, L. Zhang, Y. Chen, M. Zhou, B. Zheng, K. Li, Y. Liu, J. Lin, T.-M. Fu and Q. Zhang, Atmos. Chem. Phys., 2019, 19, 8339–8361 CrossRef CAS.
- P. Talebizadeh, M. Babaie, R. Brown, H. Rahimzadeh, Z. Ristovski and M. Arai, Renew. Sustain. Energy Rev., 2014, 40, 886–901 CrossRef CAS.
- G. Chen, E. J. H. Cheung, Y. Cao, J. Pan and A. J. Danner, Nanoscale Res. Lett., 2021, 16, 32–40 CrossRef CAS.
- X. Huang, F. Guo, J. Chen, S. Wang, Z. Hu, L. Wang, Z. Chen and M. Liu, IEEE Trans. Plasma Sci., 2016, 44, 1341–1348 Search PubMed.
- Y. S. Mok, J.-O. Jo, H.-J. Lee, H. T. Ahn and J. T. Kim, Plasma Chem. Plasma Process., 2007, 27, 51–64 CrossRef CAS.
- M. A. Jani, K. Takaki and T. Fujiwara, Rev. Sci. Instrum., 1998, 69, 1847–1849 CrossRef CAS.
- V. R. Chirumamilla, W. F. L. M. Hoeben, F. J. C. M. Beckers, T. Huiskamp, E. J. M. Van Heesch and A. J. M. Pemen, Plasma Chem. Plasma Process., 2016, 36, 487–510 CrossRef CAS.
- H. Pan, Y. Guo, Y. Jian and C. He, Energy Fuels, 2015, 29, 5282–5289 CrossRef CAS.
- B. S. Rajanikanth and A. D. Srinivasan, IEEE Trans. Dielectr. Electr. Insul., 2007, 14, 302–311 CAS.
- H. Wang, J. Wang, L. Zhang, Q. Yu, Z. Chen and S. Wu, Chem. Res. Chin. Univ., 2019, 35, 1062–1069 CrossRef CAS.
- M. Zangouei and B. S. Haynes, Plasma Chem. Plasma Process., 2019, 39, 89–108 CrossRef CAS.
- A. M. Harling, D. J. Glover, J. C. Whitehead and K. Zhang, Appl. Catal. B Environ., 2009, 90, 157–161 CrossRef CAS.
- J. L. Hueso, A. R. Gonzalez-Elipe, J. Cotrino and A. Caballero, J. Phys. Chem. A, 2007, 111, 1057–1065 CrossRef CAS PubMed.
- I. Jogi, E. Stamate, C. Irimiea, M. Schmidt, R. Brandenburg, M. Holub, M. Bonislawski, T. Jakubowski, M.-L. Kaariainen and D. C. Cameron, Fuel, 2015, 144, 137–144 CrossRef CAS.
- T. Wang, H. Liu, X. Zhang, Y. Guo, Y. Zhang, Y. Wang and B. Sun, Fuel Process. Technol., 2017, 158, 199–205 CrossRef CAS.
- C. Shi, Z.-s. Zhang, M. Crocker, L. Xu, C.-y. Wang, C. Au and A.-m. Zhu, Catal. Today, 2013, 211, 96–103 CrossRef CAS.
- Z. Chang, C. Wang and G. Zhang, Plasma Processes Polym., 2020, 17, 1–24 Search PubMed.
- M. Humayun, F. Raziq, A. Khan and W. Luo, Green Chem. Lett. Rev., 2018, 11, 86–102 CrossRef CAS.
- S. M. Gupta and M. Tripathi, Chin. Sci. Bull., 2011, 56, 1639–1657 CrossRef CAS.
- S. Chen, H. Wang, M. Shi, H. Ye and Z. Wu, Environ. Sci. Technol., 2018, 52, 8568–8577 CrossRef CAS PubMed.
- X. Chen, L. Liu, P. Y. Yu and S. S. Mao, Science, 2011, 331, 746–750 CrossRef CAS PubMed.
- Q. Bi, X. Huang, Y. Dong and F. Huang, Catal. Lett., 2020, 150, 1346–1354 CrossRef CAS.
- T.-D. Nguyen, J. Li, E. Lizundia, M. Niederberger, W. Y. Hama and M. J. MacLachlan, Adv. Funct. Mater., 2019, 29, 1904639–1904648 CrossRef.
- X. Hou, C.-W. Wang, W.-D. Zhu, X.-Q. Wang, Y. Li, J. Wang, J.-B. Chen, T. Gan, H.-Y. Hu and F. Zhou, Solid State Sci., 2014, 29, 27–33 CrossRef CAS.
- C. McManamon, J. O'Connell, P. Delaney, S. Rasappa, J. D. Holmes and M. A. Morris, J. Mol. Catal. Chem., 2015, 406, 51–57 CrossRef CAS.
- X. Wu, S. Yin, Q. Dong, C. Guo, H. Li, T. Kimura and T. Sato, Appl. Catal. B Environ., 2013, 142, 450–457 CrossRef.
- A. A. Ismail and D. W. Bahnemann, J. Phys. Chem. C, 2011, 115, 5784–5791 CrossRef CAS.
- J. Fang, S.-W. Cao, Z. Wang, M. M. Shahjamali, S. C. J. Loo, J. Barber and C. Xue, Int. J. Hydrogen Energy, 2012, 37, 17853–17861 CrossRef CAS.
- D. Yang, Y. Sun, Z. Tong, Y. Tian, Y. Li and Z. Jiang, J. Phys. Chem. C, 2015, 119, 5827–5835 CrossRef CAS.
- Z. Wang, H. Kuang, J. Zhang, L. Chu and Y. Ji, RSC Adv., 2019, 9, 5402–5416 RSC.
- H. Jiang, T. Shao, C. Zhang, W. Li, P. Yan, X. Che and E. Schamiloglu, IEEE Trans. Dielectr. Electr. Insul., 2013, 20, 1101–1111 Search PubMed.
- X. Yan, Z. Xing, Y. Cao, M. Hu, Z. Li, X. Wu, Q. Zhu, S. Yang and W. Zhou, Appl. Catal. B Environ., 2017, 219, 572–579 CrossRef CAS.
- Q. Zhu, Y. Peng, L. Lin, C.-M. Fan, G.-Q. Gao, R.-X. Wang and A.-W. Xu, J. Mater. Chem. A, 2014, 2, 4429–4437 RSC.
- K. Ye, K. Li, Y. Lu, Z. Guo, N. Ni, H. Liu, Y. Huang, H. Ji and P. Wang, TrAC, Trends Anal. Chem., 2019, 116, 102–108 CrossRef CAS.
- G. Li, J. Li, G. Li and G. Jiang, J. Mater. Chem. A, 2015, 3, 22073–22080 RSC.
- K. Zhang, W. Zhou, L. Chi, X. Zhang, W. Hu, B. Jiang, K. Pan, G. Tian and Z. Jiang, ChemSusChem, 2016, 9, 2841–2848 CrossRef CAS PubMed.
- X. Liu, G. Dong, S. Li, G. Lu and Y. Bi, J. Am. Chem. Soc., 2016, 138, 2917–2920 CrossRef CAS.
- S. Hoang, S. P. Berglund, N. T. Hahn, A. J. Bard and C. B. Mullins, J. Am. Chem. Soc., 2012, 134, 3659–3662 CrossRef CAS PubMed.
- X. Liu, S. Gao, H. Xu, Z. Lou, W. Wang, B. Huang and Y. Dai, Nanoscale, 2013, 5, 1870–1875 RSC.
- Z. Pei, L. Ding, H. Lin, S. Weng, Z. Zheng, Y. Hou and P. Liu, J. Mater. Chem. A, 2013, 1, 10099–10102 RSC.
- T. Butterworth and R. W. K. Allen, Plasma Sources Sci. Technol., 2017, 26, 065008–065023 CrossRef.
- O. Guaitella, F. Thevenet, C. Guillard and A. Rousseau, J. Phys. Appl. Phys., 2006, 39, 2964–2972 CrossRef CAS.
- N. Lu, Y. Hui, K. Shang, N. Jiang, J. Li and Y. Wu, Plasma Chem. Plasma Process., 2018, 38, 1239–1258 CrossRef CAS.
- H.-H. Kim, Y. Teramoto, A. Ogata, H. Takagi and T. Nanba, Plasma Chem. Plasma Process., 2016, 36, 45–72 CrossRef CAS.
- S. Chen, Y. Zhou, J. Li, Z. Hu, F. Dong, Y. Hu, H. Wang, L. Wang, K. K. Ostrikov and Z. Wu, ACS Catal., 2020, 10, 10185–10196 CrossRef CAS.
- G. Dong, L. Yang, F. Wang, L. Zang and C. Wang, ACS Catal., 2016, 6, 6511–6519 CrossRef CAS.
- G. Dong, W. Ho, Y. Li and L. Zhang, Appl. Catal. B Environ., 2015, 174–175, 477–485 CrossRef CAS.
- B. Li, X. Zhu, J. Wang, R. Xing, Q. Liu, X. Shi, Y. Luo, S. Liu, X. Niu and X. Sun, Chem. Commun., 2020, 56, 1074–1077 RSC.
|
| This journal is © The Royal Society of Chemistry 2021 |
Click here to see how this site uses Cookies. View our privacy policy here. 
 Open Access Article
 This Open Access Article is licensed under a Creative Commons Attribution-Non Commercial 3.0 Unported Licence
 *
*