
 Open Access Article
 This Open Access Article is licensed under a Creative Commons Attribution-Non Commercial 3.0 Unported Licence
Improving light absorption and photoelectrochemical performance of thin-film photoelectrode with a reflective substrate†
Jingran Xiao *a,
Lingling Penga,
Le Gaoa,
Jun Zhonga,
Zhongliang Huanga,
Enxian Yuanb,
Vijayan Srinivasapriyanc,
Shu-Feng Zhoua and
Guowu Zhan*a
*a,
Lingling Penga,
Le Gaoa,
Jun Zhonga,
Zhongliang Huanga,
Enxian Yuanb,
Vijayan Srinivasapriyanc,
Shu-Feng Zhoua and
Guowu Zhan*a
aCollege of Chemical Engineering, Huaqiao University, 668 Jimei Blvd, Xiamen, Fujian 361021, P. R. China. E-mail: xjr@hqu.edu.cn; gwzhan@hqu.edu.cn
bSchool of Chemistry and Chemical Engineering, Yangzhou University, Yangzhou, Jiangsu 225002, P. R. China
cKey Laboratory of Nanosystem and Hierarchical Fabrication, CAS Center for Excellence in Nanoscience, National Center for Nanoscience and Technology, Beijing 100190, China
First published on 5th May 2021
Abstract
The charge separation/transport efficiency is relatively high in thin-film hematite photoanodes in which the distance for charge transport is short, but simultaneously the high loss of light absorption due to transmission is confronted. To increase light absorption in thin-film Fe2O3:Ti, commercial substrates such as Cu foil, Ag foil, and a mirror are adopted acting as back-reflectors and individually integrated with the Fe2O3:Ti electrode. The promotion effect of the commercial back-reflectors on the light absorption efficiency and photoelectrochemical (PEC) performance of the hydrothermally prepared Fe2O3:Ti electrodes with a variety of film thicknesses is investigated. As a result, Ag foil and the mirror show favorable and equal efficacy while the promoting effect of Cu foil is limited. In addition, the photocurrent increment achieved by the Ag back-reflector decreases linearly along with the logarithmic of the film thickness and the optimized film thickness of the Fe2O3:Ti electrode is decreased from 520 to 290 nm. The high durability of Ag foil in the alkaline electrolyte during solar light irradiation is demonstrated. Furthermore, the reflective substrate also shows a promotion effect on the BiVO4 photoanode and CuBi2O4 photocathode, as well as the unbiased photocurrent from a tandem cell constituted by TiO2 and CuBi2O4.
1. Introduction
The photoelectrochemical (PEC) water splitting process is one of the most promising options for solar light conversion direct into available chemicals and has attracted extensive attention in the research field.1–3 Researchers focus particularly on the water oxidation reaction since it involves four electrons and is of higher difficulty than the water reduction counterpart. Various photoanode materials have been intensively studied, including TiO2, BiVO4, α-Fe2O3, WO3, etc, among which α-Fe2O3 possesses superiority in that it is low cost, non-toxic and has high stability in neutral and basic electrolytes, and most importantly is one of the most applicable photoanode materials with a theoretical photocurrent density up to 12.6 mA cm−2.4–9 However, the known practical photocurrent density of the α-Fe2O3 photoanode is still less than 3 mA cm−2 at 1.23 VRHE (versus reversible hydrogen electrode).10,11 This should be partly due to the low charge transfer efficiency and high onset potential caused by sluggish water oxidation kinetics with the strong Fermi level pinning effect of surface states.12,13 Besides, the carrier mobility in α-Fe2O3 is merely 0.01 cm2 V−1 s−1 due to its poor intrinsic conductivity. Therefore, severe bulk charge recombination occurs in hematite photoanode which thereby limits the charge separation and transport efficiency.14,15To address this issue, an intensive effort has been denoted to reduce the onset potential of α-Fe2O3 photoanode by passivation of surface states with a functional oxide layer (e.g. TiO2,16 Ga2O3,17 Al2O3,18 etc.) or acceleration of the oxidation reaction kinetics by the assistance of an oxygen evolution reaction (OER) catalyst.19–22 For instance, an impressively low onset potential of 0.45 VRHE has been reported by Wang's group realized by a re-growth α-Fe2O3 photoanode loaded by NiFeOx catalyst.23 In the meantime, the low-bias performance of α-Fe2O3 photoanodes is seen to have significant progress,24 and that the high-bias surface charge transfer efficiency can reach 100%.25,26 It appears that to conquer the bulk charge27 recombination is more challenging since the bulk charge separation/transport efficiency is still lower than 30%,28,29 though conventional efforts including element doping,30–32 nanostructure control,33,34 and heterojunction fabrication35–37 have been devoted.
Computational and experimental work has been focused on the super-thin α-Fe2O3 photoanode. The hole collection depth in α-Fe2O3 is only ∼12 nm, with hole diffusion length of ∼5 nm and space charge layer width of ∼7 nm.38 In the super-thin α-Fe2O3 photoanode, film thickness matches the hole collection length, thereby reducing the probability of charge recombination and improving the charge transport efficiency.39 However, most photons are wasted due to strong light transmission through super-thin α-Fe2O3, thus limiting the light absorption efficiency. To address this problem, researchers have been attempting to enhance light absorption efficiency by optical means. The concept is to either construct a light diffuse layer to trap the photons on the electrode by changing the direction of photons or adopt a specular reflection layer to simply accomplish secondary light absorption by light reflection. Li et al.40 and Kim et al.41 prepared α-Fe2O3 thin-film photoanodes on a three-dimensional (3D) FTO substrate, which achieved significant improvement in light absorption and PEC performance. As a fact, the applications of optical patterning substrate for tunable optical reflectance has been successfully applied in photovoltaic, PEC, and light-emitting diode fields.42,43 Dotan et al.44 provided a strategy by deposition of a back-reflection layer between the FTO layer and glass substrate, which also efficiently heightened the light availability in super-thin α-Fe2O3 photoanode. However, it must be admitted that the manufacturing of 3D FTO or deposition of a reflective sub-layer is highly equipment dependent, technically difficult and too costly for real industrial applications.
Herein, to avoid using the costly equipment, we report a facile and versatile strategy by adopting commercial light-reflective substrates such as Cu foil, Ag foil and mirror which were individually assembled with the FTO glass acting as back-reflectors. The thickness of the Fe2O3:Ti nanorod electrode prepared hydrothermally was controlled from 180 to 650 nm via a hydrothermal method and the light absorption efficiency and PEC performance affected by film thickness were fully discussed. Also, the promoting effect of the back-reflectors was determined, which decreased as increasing the film thickness. The high stability of the reflective substrate provides a long-term guarantee for performance improvement. Besides, the reflective substrate shows high flexibility and universality in various photoelectrodes and tandem system. We put a concept here that a simple integration of photoanode with a reflective substrate can significantly improve the PEC performance.
2. Experimental section
2.1 Chemicals
The chemicals and reflective substances were purchased and used without any further purification, including the iron(III) chloride hexahydrate (FeCl3·6H2O, 99.0%, Aladdin), titanium(IV) butoxide (C16H36O4Ti, 99%, Adamas), methanol (CH3OH, 99.9%, Adamas), anhydrous sodium acetate (CH3COONa, 98.0%, Guangfu), sodium ferrocyanide (Na4Fe(CN)6, AR, Macklin), cupric nitrate trihydrate (Cu(NO3)2·H2O, AR, Xilong), bismuth nitrate pentahydrate (Bi(NO3)3·5H2O, 98%, Sigma-Aldrich), nitric acid (HNO3, 70%, Sinopharm), ammonium vanadate (NH4VO3, 99%, Adamas), hydrochloric acid (HCl, 37%, Sinopharm), ethanol (CH3CH2OH, AR, Xilong), acetic acid (CH3COOH, 99%, Adamas).2.2 Synthesis of the Fe2O3:Ti electrodes
The synthesis and modification methods of the Fe2O3:Ti electrodes on FTO substrates were similar to our previous report.45 Briefly, clean FTO glasses were immersed in a solution of 0.09 M FeCl3·6H2O and 0.1 M CH3COONa (230 uL HCl added to adjust pH to 1.45) and hydrothermally treated at 95 °C before immersing in 0.5% v/v titanium(IV) butoxide ethanol solution for ∼2 s and calcined at 550 °C for 2 h and further annealed at 750 °C for 15 min. Then, the obtained Fe2O3:Ti electrodes were solvothermal treated in absolute methanol at 180 °C for 12 h. For thickness adjustment, the hydrothermal time was controlled to 120, 130, 135, 150, and 180 min. The reflective substrate was integrated with each Fe2O3:Ti electrodes independently by overlaying at the back-side of FTO.The Au deposition on the Fe2O3:Ti electrode was done on a sputter coater (Cressington 108Auto).
2.3 Synthesis of other electrodes
TiO2 electrode was prepared hydrothermally according to the previous report.46 In brief, FTO was immersed in a mixture of 0.4 mL titanium(IV) butoxide, 15 mL DI water and 15 mL concentrated HCl under stirring. After the hydrothermal reaction at 160 °C for 4 h and calcination at 600 °C for 2 h, the TiO2 electrode was obtained. BiVO4 electrode was prepared by a seed layer assisted hydrothermal reaction at 180 °C for 12 h with Bi(NO3)3·5H2O and NH4VO3 as the Bi and V sources, followed by calcination at 450 °C for 2 h.47 The CuBi2O4 electrode was made by drop-casting the solution of Cu(NO3)2·H2O and Bi(NO3)3·5H2O dissolving in ethanol/acetic acid mixture on FTO with an amount of 20 μL cm−2 and then calcining at 550 °C for 2 h.2.4 Photoelectrochemical measurements
The PEC measurements of the electrodes for Fe2O3:Ti, TiO2 and CuBi2O4 electrodes were performed at room temperature on the electrochemical workstation (CHI 660D, CH Instruments) with a three-electrode connection of platinum mesh as the counter electrode, Hg/HgO (1 M KOH) as the reference electrode, 1 M NaOH solution (pH 13.6) as the electrolyte with the electrodes facing to simulated sunlight (AM 1.5G, 100 mW cm−2). The BiVO4 electrode was tested similarly but in PBS solution (pH 7.4) with Ag/AgCl (3 M KCl) as the reference electrode. Tandem PEC cell contains a two-electrode configuration of TiO2 as the working electrode and CuBi2O4 as the counter electrode. The bias-free photocurrent was measured at 0 V with light irradiating on the TiO2 photoanode and then the rear CuBi2O4 photocathode. The light was irradiated from a xenon lamp (PerfectLight, PLS-SXE300D) which was equipped with an AM 1.5G light filter and a light shutter.The polarization curves were scanned at 20 mV s−1. Chronoamperometry was tested at 1.23 VRHE to verify the stability of the Fe2O3:Ti photoanodes with and without the reflective substance.
Cyclic voltammetry (CV) test was performed at scan rates from 20 to 120 mV s−1 and the electrochemical surface area (ECSA) was calculated with half the linear slope of the capacitive current versus scan rate.48
Incident-photon-to-current conversion efficiency (IPCE) was measured at 1.23 VRHE using bandpass filtered light from 350 to 700 nm and calculated by eqn (1):49
| IPCE = (1240J)/(λJlight) | (1) |
Theoretical photocurrent density (Jabs) was estimated by eqn (2):50
 | (2) |
Charge transfer efficiency (ηtran) was defined as the generated photocurrent density to Jabs (ηtran = J/Jabs).
All the potentials were relative to the reversible hydrogen electrode (RHE) by using the Nernst equation:
| ERHE = EHg/HgO + Erefθ + 0.0592 pH | (3) |
2.5 Characterizations
The X-ray diffraction (XRD) patterns of the samples were measured at a scan rate of 8° min−1 on a Rigaku SmartLab X-ray diffractometer with the Cu Kα radiation (40 kV × 30 mA). The surface and cross-section morphology of the electrodes were measured on a HITACHI SU5000 thermal field emission scanning electron microscope (SEM). The light-harvesting efficiency of the electrodes and light reflection efficiency of the reflective substrates were investigated on an Agilent Cary500 spectrometer in diffuse reflection pattern.3. Results and discussion
3.1 Fe2O3:Ti electrodes with different thicknesses
The Fe2O3:Ti electrodes fabricated hydrothermally with a variation of the hydrothermal time were photographed and showed a tendency of colour to get deeper from light yellowish-brown to dull red (inset in Fig. 1), indicating the increase of film thickness. The XRD pattern of the electrodes in Fig. 1 was well-indexed to tetragonal SnO2 and hexagonal Fe2O3. The intensity of the strong peaks of SnO2 stemmed from the FTO substrate was identical for all the samples. It is noted that Fe2O3 showed a highly dominant orientation of (110) crystal plane along with a weak peak of (330) plane and a negligible peak of (104) plane. The increase in the intensity of (110) and (330) planes was in coincidence with the prolonged hydrothermal time, which also suggests the constant orientation of Fe2O3 during growth.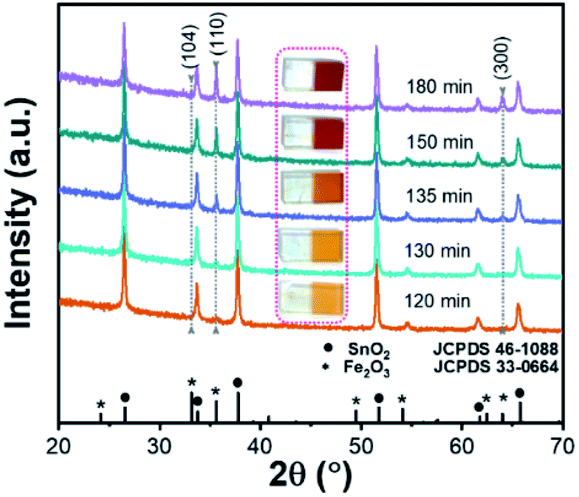 | ||
| Fig. 1 XRD patterns and photographs (inset) of the Fe2O3:Ti electrodes prepared by adjusting the hydrothermal time. | ||
SEM images of the Fe2O3:Ti electrodes in vertical and cross-section views are displayed in Fig. 2, all showing a nanorod morphology with a diameter of tens of nanometres. However, as hydrothermal time increases, the nanorods became more compact and the diameter of the nanorods increased (from ∼50 to ∼80 nm), which was especially evidenced from the comparison of Fig. 2b and c. Fig. 2d and e give evidence that adhesion among the nanorods occurred when the film is too thick. The thickness of the electrodes was measured to 180, 250, 330, 520, and 650 nm, respectively, according to the cross-section images (Fig. 2f–j). According to the correlation between Fe2O3:Ti film thickness and hydrothermal reaction time (Fig. S1†), film thickness increase was fast at the beginning and then became slower, which conforms to common growth kinetics.
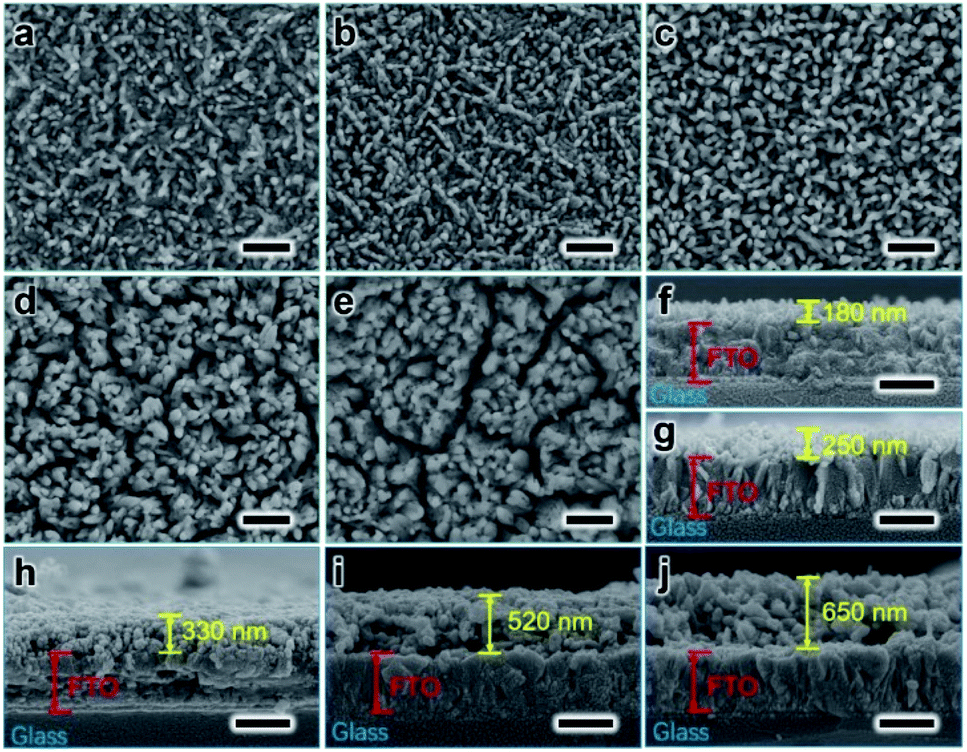 | ||
| Fig. 2 Verticle (a–e) and cross-section (f–j) SEM view of the Fe2O3:Ti electrodes prepared by adjusting the hydrothermal time; (a and f) 120 min; (b and g) 130 min; (c and h) 135 min; (d and i) 150 min; (e and j) 180 min. Scale bars are 500 nm. | ||
The nanostructure morphology of the Fe2O3:Ti electrodes contributes to a relatively high electrochemical specific surface area (ECSA), as seen from the CV curves in Fig. S2a–e† and the calculated results in Fig. 3a and S2f.† The ECSA was increased as the film became thicker. However, the increase rate of ECSA was rapid for the thin films and slowed down gradually when the film gets thick, which is understandable because the incremental amount and length of the nanorods in the thin films dedicated to most of the surface areas while the adhesion of nanorods in thick films was inconducive to the surface area, as indicated in Fig. 2. An enhancement in light-harvesting efficiency (LHE) of the Fe2O3:Ti electrodes was achieved with increasing film thickness, which was well expressed at a range of 350 to 610 nm (the absorption edge of Fe2O3:Ti), as illustrated in Fig. 3b. The inescapable tail of LHE at 610 to 800 nm is due to the absorption of bare FTO (Fig. S3a†). As an apparent view in Fig. 3b, the LHE of Fe2O3:Ti650 exceeded absorbance of 90% below 610 nm, where the waste of the rest photons should be due to inevitable reflectance rather than transmission, as suggested by the stagnant absorptance in the UV range. That is, the transmittance of prepared Fe2O3:Ti electrodes varied from a high level to zero.
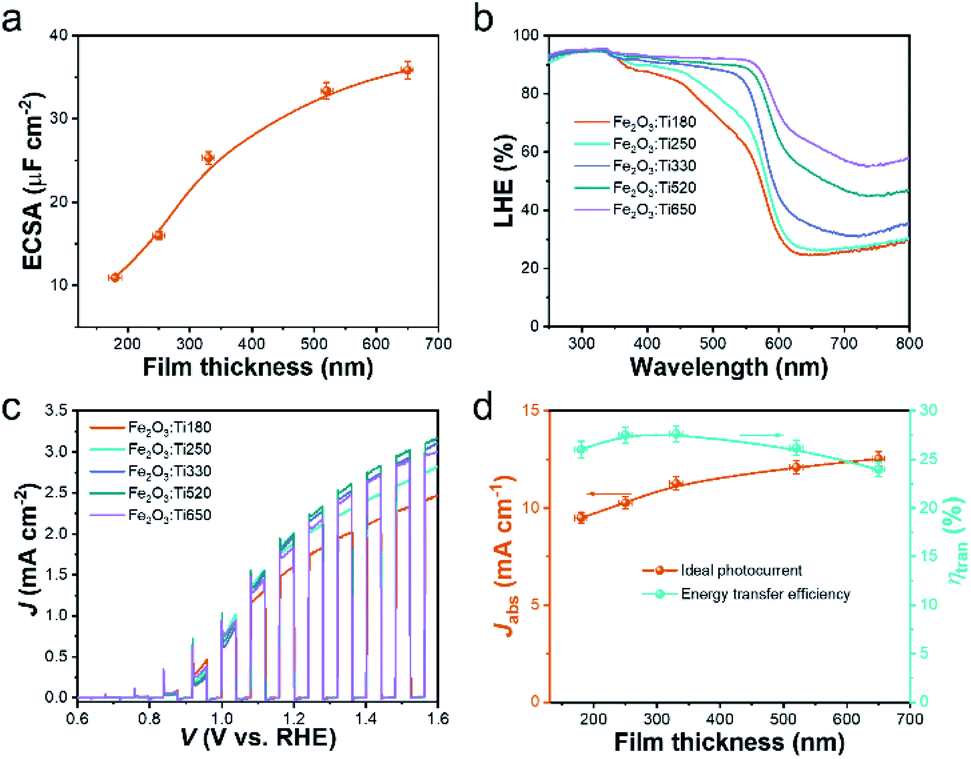 | ||
| Fig. 3 (a) The estimated electrochemical specific surface area (ECSA), (b) the light-harvesting efficiency (LHE), and (c) the polarization curve of the Fe2O3:Ti electrodes with the thickness of 180, 250, 330, 520 and 650 nm (named as Fe2O3:Tin, n represents the film thickness); (d) variation of the calculated theoretical photocurrent (Jabs) and charge transfer efficiency (ηtran) as a function of the film thickness. All the Y-axis error bars in this work were counted by measurements of three parallel specimens and the X-axis error bars were the measuring error of 10 nm. | ||
The PEC performance of the Fe2O3:Ti electrodes was measured in terms of the light chopped polarization curve scanned at 20 mV s−1 and plotted in Fig. 3c. All the samples showed a typical curve of the Ti-doped Fe2O3 photoanode with an onset potential of ∼0.85 V and a negligible dark current. The Fe2O3:Ti180 electrode showed a favorable photocurrent density of 2.3 mA cm−2 at 1.6 VRHE. As increasing the thickness, the photocurrent was enhanced to a maximum of 3.0 mA cm−2 at 1.6 VRHE by the Fe2O3:Ti520 electrode and then decreased marginally. The highest photocurrent density achieved by the Fe2O3:Ti520 electrode was a result of balancing the light absorption and charge transfer efficiency. Assuming 100% absorbed photon-to-current efficiency, the theoretical photocurrent densities (Jabs) were simulated by weighing the solar light irradiance with LHE (Fig. S3b†). Then the experimental photon-to-current efficiency, that is the charge transfer efficiency (ηtran), was calculated with the photocurrent density at 1.6 VRHE divided by Jabs. The values of Jabs and ηtran following film thicknesses are compared in Fig. 3d. The Jabs increased considerably when thickness increased from 180 to 330 nm while less increase was seen for the thicker films, indicating that a thin part of the Fe2O3:Ti film contributes to most of the light absorbance. As for the ηtran, it showed in a volcano shape with a maximum achieved by the Fe2O3:Ti290 electrode. Since the ηtran is promoted in the nanorods where the hole diffusion distance is short, the increase in the thin films and the decrease in the thick films of ηtran along with film thickness are attributed to the formation of more nanorods and the adhesion of nanorods, respectively. Considering both the Jabs and ηtran, the excess increase of film thickness contributes little to light-harvesting and is at a cost of a loss of charge transfer efficiency.
3.2 The improvement effect of reflective substances
To lift the light absorption of the Fe2O3:Ti electrodes, we simply integrated a reflective substance along with the FTO glass to reflect the transmitted photon for reabsorption by Fe2O3:Ti. The polished Cu foil, Ag foil and the CM were used, and their photography and reflectance spectra are depicted in Fig. S4a.† It shows that each has a degree of reflex in UV-visible range, but Cu foil exhibited a weak reflection of photons with λ < 550 nm and the Ag foil and CM showed a favorable reflection of photons with wavelengths above 330 and 350 nm respectively. Moreover, CM had higher reflection than the Ag foil in wavelength between 360 and 530 nm. Fig. 4a exhibits the reflection result of the three reflective substances on the Fe2O3:Ti180 electrode. It is observed that the Ag foil and CM showed a similar promoting effect on the light absorption of the Fe2O3:Ti electrode. The higher light absorption of Cu foil supported electrode was unreliable since Cu had strong self-ability of absorption, which can be confirmed by the PEC performance shown in Fig. 4b. The improvement of photocurrent was merely 2% assisted by Cu foil, while that was 15% for electrodes with Ag and CM back-reflectors. Regarding that Ag foil and CM showed an almost equal effect on both light-harvesting and the photocurrent density, their function is indicated to merely result from the light reflection effect. Then, the performance of the electrodes of different thickness with and without Ag back-reflector was compared (Fig. S5†). As a whole, all the electrodes realized a performance enhancement after assembling the Ag back-reflector except for the Fe2O3:Ti650 which should have reached saturation of light absorption, and the photocurrent increment decreases as increasing the film thickness. For the performance comparison of the Ag foil supported electrodes depicted in Fig. 4c, although the performance has been remarkably enhanced of the Fe2O3:Ti180 and Fe2O3:Ti250 electrodes with thinner films, the championship of the Fe2O3:Ti520 electrode was not shaken. However, it is undeniable that the Fe2O3:Ti260 and Fe2O3:Ti290 electrodes showed comparable and equal performance in comparison with Fe2O3:Ti520. It suggests that the Ag back-reflector indeed expressed its availability, but still with limited effectiveness on performance enhancement of the Fe2O3:Ti electrode. On a view of the photocurrent increment of the electrodes with Ag reflector at certain bias potentials, as indicated in Fig. 4d, the photocurrent increment at 1.25 and 1.5 V was similar and decreased from about 15% of the Fe2O3:Ti180 electrode to zero of the Fe2O3:Ti650. An approximate linear relation was found between the photocurrent increment and the logarithmic of the film thickness, which is coincident with the previous result that the photon flux in a layer of Fe2O3:Ti follows a logarithmic relationship with the film thickness.44 A control sample with a deposition of an Au reflective layer on the back-side of Fe2O3:Ti180 was also prepared. As seen in Fig. S6,† there was a 4% photocurrent increase after Au layer deposition, much less than the Ag reflector, indicating that the light reflection efficiency of a reflective substrate can be much higher than the deposited reflective layer. | ||
| Fig. 4 (a) LHE and (b) polarization curve of the bare Fe2O3:Ti180 electrode and those supported by Cu foil, Ag foil and commercial mirror (CM); (c) the polarization curves of the Fe2O3:Ti electrodes with Ag back-reflector; (d) the calculated photocurrent density increment at certain bias potentials as a function of the logarithm of film thickness (dF) thanks to the light reflection of Ag foil. | ||
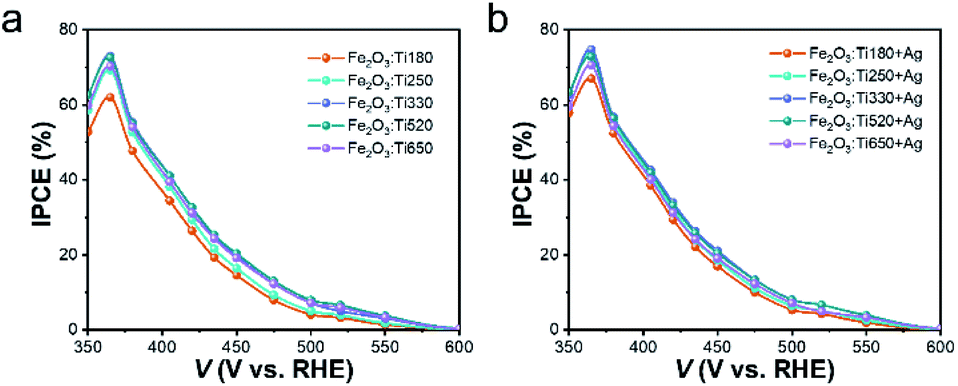
The incident photon-to-electron conversion efficiency (IPCE) of the Fe2O3:Ti electrodes without the Ag back-reflector are plotted in Fig. 5a. With the film thickness increases from 180 to 250 nm, the enhancement of IPCE was approximately equivalent to 10% at each wavelength of the incident photon. Meanwhile, the enhancement at the UV range was negligible but became more significant at the visible light range when the film thickness further increased, which is observably told as comparing the Fe2O3:Ti260 and Fe2O3:Ti290 electrodes. This phenomenon is coincident with the UV-vis spectra, again confirming that light absorption at short wavelength is easier to reach a saturation state. It is also noted that the quantum efficiency of photoanode Fe2O3:Ti650 was lower at the whole wavelength of photons than Fe2O3:Ti520, which is due to the low charge conversion efficiency rather than the light absorption and thus independent of the photon wavelength. When the Ag back-reflector was adopted, the escalation of IPCE for each photoanode of different film thickness, as can be observed in Fig. S7,† followed the same trend with photocurrent density, which again expressed the boosted photon conversion. It also indicated that the back-reflector was effective in the whole tested light absorption range. As a result (Fig. 5b), the difference in IPCE among the various Fe2O3:Ti electrodes using an Ag back-reflector dwindled, no matter at the UV or the visible light range. The approximately identical IPCE of the Fe2O3:Ti260, Fe2O3:Ti290 and Fe2O3:Ti520 were found with a maximum of around 74.8%.
 | ||
| Fig. 5 Comparison of the incident photon-to-electron conversion efficiency (IPCE) of the Fe2O3:Ti electrodes of different thicknesses (a) with and (b) without Ag back-reflector. | ||
Based on the above results, Fig. 6 depicts a simplified sketch of Ag back-reflector affecting the PEC performance of the Fe2O3:Ti photoanode. For a thin layer of bare Fe2O3:Ti nanorod photoanode, the light conversion efficiency is high, but the light absorption efficiency is limited due to strong transmission. With the increase of the film thickness, the light absorption is enhanced but at a loss of charge transfer efficiency. A trade-off between light absorption and charge transfer efficiency appears to be inevitable. In the meantime, the absorption of UV light reaches saturation for the film with a thickness of 260 nm, so the further increase of film thickness enhances light absorption more significantly in the visible light region. However, encouragingly, when an Ag foil (or a commercial mirror) is integrated acting as a light back-reflector, the transmitted photons of λ > 350 nm can be reflected through the Fe2O3:Ti layer to achieve re-absorption and then improve the PEC performance. As a fact, the promoting effect of the Ag reflector is very similar to the increase of film thickness except for the independence of photon wavelength.
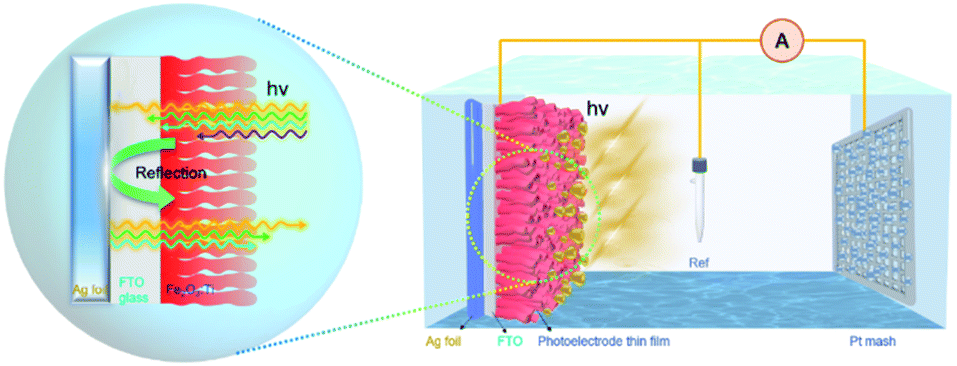 | ||
| Fig. 6 Schematic diagram of the PEC water splitting system and the promoting effect of the Ag reflective substance on the light absorption of Fe2O3:Ti electrode. | ||
3.3 Stability and universal applications of the reflective substance
The promoting effect of the reflective substrate has been proved. To verify its durability during photoirradiation in the highly alkaline electrolyte, the prolonged photocurrent of the Fe2O3:Ti180 photoanode with and without the Ag reflector was measured (Fig. 7a). A photocurrent decay of Fe2O3:Ti180 was observed, which is similar to our previous result.45 After the integration of Ag foil, a higher photocurrent was achieved, and the decreasing variation of photocurrent followed the same trend as the bare one. Therefore, the high stability of the Ag reflector during the PEC test is determined.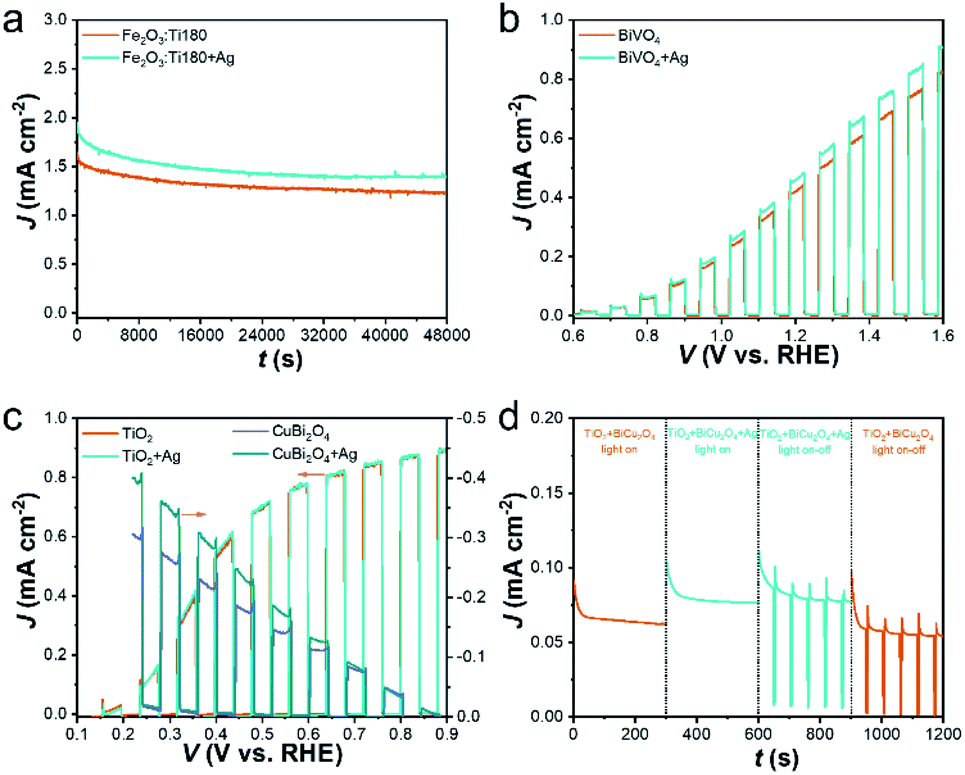 | ||
| Fig. 7 (a) Long-term stability of photoanode Fe2O3:Ti180 with and without the Ag reflective substrate; comparison of the polarization curves of the (b) BiVO4 photoanode, (c) TiO2 photoanode and CuBi2O4 photocathode with and without the Ag reflective substrate; (d) chronoamperometry test of the TiO2//CuBi2O4 tandem cell under zero bias with and without the Ag reflective substrate integrated with CuBi2O4. | ||
Since the promotion effect of the reflective substrate is attributed by light reflection, theoretically it can show availability on all the photoelectrodes with a thin-film or incomplete light absorption. The extensively studied BiVO4, TiO2 photoanode and CuBi2O4 photocathode were prepared and used as additional photoelectrode models. The SEM images (Fig. S8†) indicate that polyhedral BiVO4, nanorod-like TiO2 and porous CuBi2O4 were obtained, which showed a thickness of ∼360, ∼750, and ∼500 nm, respectively. According to UV-vis spectra (Fig. S9†), the absorption edge of BiVO4, TiO2 and CuBi2O4 are around 520, 415 and 675 nm, respectively. With the integration of an Ag reflector, the electrodes showed enhanced light absorption to a different extent, among which the enhancement of CuBi2O4 was much stronger than TiO2 and BiVO4. The difference in light-harvesting efficiency is related to the intrinsic absorption property, film compactness in addition to film thickness. Then, the promotion effect of the Ag reflective substrate on the PEC performance of these photoelectrodes was evaluated (Fig. 7b and c). A slight photocurrent enhancement of the BiVO4 photoanode was achieved, with a 10% increase at 1.2 VRHE (Fig. 7b). A much stronger photocurrent increase of the CuBi2O4 photocathode was observed, with an increase of 30% at 0.4 VRHE. However, there was little change in the performance of TiO2, which is reasonable since TiO2 has a narrow absorption range in the UV region and the contribution of the light reflector was very small.
Tandem cells by connecting a photoanode and a photocathode to achieve bias-free water splitting have been regarded as an ideal path for solar conversion, which will the key direction of future research in the field.51,52 Herein, there was a wide overlap between the polarization curves of TiO2 photoanode and CuBi2O4 photocathode (Fig. 7c), which also have a large difference in the light absorption range (Fig. S9b and c†), a tandem cell can be constructed with TiO2 facing at the light irradiation to utilize UV light and the rear CuBi2O4 exploiting the rest visible light (see schematic in Fig. S10†). From the UV-vis spectrum in Fig. S9d,† superimposed absorption of TiO2 and CuBi2O4 was achieved by TiO2//CuBi2O4. Note that when the Ag reflective substrate was integrated with the rear CuBi2O4, absorption enhancement was also achieved, indicating the availability of reflective substrate in tandem cells. Accordingly, the unbiased photocurrent of TiO2//CuBi2O4 tandem cell along time was measured (Fig. 7d). The generated photocurrent is much lower than that in the polarization curve due to the strong light blocking of TiO2. A 25% increase of photocurrent was achieved from 0.062 to 0.078 mA cm−2 when the Ag reflective substrate is adopted, which approaches that of individual CuBi2O4 photocathode. Table 1 summarizes the photocurrent density increment by Ag reflector of the recorded photoelectrodes and highlights the universal applicability and conspicuous promoting effect of adopting a reflective substance.
| Samples | Jelectrode (mA cm−2) | Jelectrode+Ag (mA cm−2) | Jincrement (%) |
|---|---|---|---|
| a Bias potential of 1.23 VRHE.b Bias potential of 0.3 VRHE.c Bias-free photocurrent after 200 s run. | |||
| Fe2O3:Ti (dF = 180 nm)a | 1.61 | 1.85 | 15.0 |
| TiO2a | 0.95 | 0.96 | 10.5 |
| BiVO4a | 0.44 | 0.48 | 9.1 |
| CuBi2O4b | −0.26 | −0.35 | 34.6 |
| TiO2 + CuBi2O4c | 0.064 | 0.077 | 20.3 |
4. Conclusions
In summary, we first prepared Fe2O3:Ti nanorod electrodes with film thickness from 180 to 650 nm. As the film thickness increased, the light absorption efficiency was heightened but the charge transfer efficiency was essentially decreased, and thus the PEC performance reached a maximum before decreasing. The optimized film thickness of the Fe2O3:Ti electrode was 520 nm. To implement enhancement of light absorption, reflective substances of Cu foil, Ag foil and a mirror were adopted acting as light back-reflectors, among which the Ag foil and mirror performed equally and considerably. The promoting effect of the Ag back-reflector was decreased with increasing film thickness. With the assistance of the Ag back-reflector, the optimized film thickness of the Fe2O3:Ti photoanode was decreased to 290 nm, and the 260 nm-thick Fe2O3:Ti also exhibited a comparable performance. More importantly, the long-term durability and universal application of the Ag reflective substrate for promoting the PEC performance of BiVO4 and TiO2 photoanodes, CuBi2O4 photocathode, and TiO2 photoanode//CuBi2O4 photocathode tandem cell were confirmed. Therefore, this simple and feasible strategy is promising for future study of the PEC system and easy for scale-up applications without limitation of device manufacturing equipment. It is noted that the reflectance of the Ag foil was merely 50% in the UV-vis range and the promoting effect on the light absorption and PEC performance of the super-thin Fe2O3:Ti layer (180 nm) was indeed incomplete. Therefore, seeking other powerful back-reflectors is currently underway in our group to promote the performance of the Fe2O3 and other photoelectrodes to a higher level.Conflicts of interest
There are no conflicts to declare.Acknowledgements
This work was supported by the Start-Up Scientific Research Funds for Newly Recruited Talents of Huaqiao University (No. 605-50Y19013), the Key Laboratory of Fujian Province in Huaqiao University and Program for Innovative Research Team in Science and Technology in Fujian Province University.References
- M. Gratzel, Nature, 2001, 414, 338–344 CrossRef CAS PubMed.
- W.-Y. Yu, D.-K. Ma, D.-P. Yang, X.-G. Yang, Q.-L. Xu, W. Chen and S. Huang, Phys. Chem. Chem. Phys., 2020, 22, 20202–20211 RSC.
- D. He, R.-T. Gao, S. Liu, M. Sun, X. Liu, K. Hu, Y. Su and L. Wang, ACS Catal., 2020, 10, 10570–10576 CrossRef CAS.
- Y. Zhang, S. Jiang, W. Song, P. Zhou, H. Ji, W. Ma, W. Hao, C. Chen and J. Zhao, Energy Environ. Sci., 2015, 8, 1231–1236 RSC.
- F. E. Bedoya-Lora, A. Hankin, I. Holmes-Gentle, A. Regoutz, M. Nania, D. J. Payne, J. T. Cabral and G. H. Kelsall, Electrochim. Acta, 2017, 251, 1–11 CrossRef CAS.
- Y. Lu, X. Ou, W. Wang, J. Fan and K. Lv, Chin. J. Catal., 2020, 41, 209–218 CrossRef CAS.
- Y. Dong and X. Fei, Mater. Technol., 2020, 35, 102–111 CrossRef CAS.
- R.-T. Gao and L. Wang, Angew. Chem., Int. Ed., 2020, 59, 23094–23099 CrossRef CAS PubMed.
- R.-T. Gao, D. He, L. Wu, K. Hu, X. Liu, Y. Su and L. Wang, Angew. Chem., Int. Ed., 2020, 59, 6213–6218 CrossRef CAS PubMed.
- H. Zhang, W. Y. Noh, F. Li, J. H. Kim, H. Y. Jeong and J. S. Lee, Adv. Funct. Mater., 2019, 29, 1805737 CrossRef.
- G. Liu, Y. Zhao, R. Yao, N. Li, M. Wang, H. Ren, J. Li and C. Zhao, Chem. Eng. J., 2019, 355, 49–57 CrossRef CAS.
- B. Klahr, S. Gimenez, F. Fabregat-Santiago, T. Hamann and J. Bisquert, J. Am. Chem. Soc., 2012, 134, 4294–4302 CrossRef CAS PubMed.
- A. P. Singh, R. B. Wang, C. Tossi, I. Tittonen, B. Wickman and A. Hellman, RSC Adv., 2021, 11, 4297–4307 RSC.
- K. Sivula, F. Le Formal and M. Grätzel, ChemSusChem, 2011, 4, 432–449 CrossRef CAS PubMed.
- L. Wang, J. Zhu and X. Liu, ACS Appl. Mater. Interfaces, 2019, 11, 22272–22277 CrossRef CAS PubMed.
- M. G. Ahmed, I. E. Kretschmer, T. A. Kandiel, A. Y. Ahmed, F. A. Rashwan and D. W. Bahnemann, ACS Appl. Mater. Interfaces, 2015, 7, 24053–24062 CrossRef CAS PubMed.
- T. Hisatomi, F. Le Formal, M. Cornuz, J. Brillet, N. Tetreault, K. Sivula and M. Gratzel, Energy Environ. Sci., 2011, 4, 2512–2515 RSC.
- F. Le Formal, N. Tetreault, M. Cornuz, T. Moehl, M. Gratzel and K. Sivula, Chem. Sci., 2011, 2, 737–743 RSC.
- J. F. Zhang, R. Garcia-Rodriguez, P. Cameron and S. Eslava, Energy Environ. Sci., 2018, 11, 2972–2984 RSC.
- J. Xiao, L. Fan, Z. Huang, J. Zhong, F. Zhao, K. Xu, S.-F. Zhou and G. Zhan, Chin. J. Catal., 2020, 41, 1761–1771 CrossRef CAS.
- Q. J. Bu, S. Li, K. Zhang, Y. H. Lin, D. J. Wang, X. X. Zou and T. F. Xie, ACS Sustain. Chem. Eng., 2019, 7, 10971–10978 CrossRef CAS.
- T.-T. Li, Q. Zhou, J. Qian, Y. Hu and Y.-Q. Zheng, Electrochim. Acta, 2019, 307, 92–99 CrossRef CAS.
- J.-W. Jang, C. Du, Y. Ye, Y. Lin, X. Yao, J. Thorne, E. Liu, G. McMahon, J. Zhu, A. Javey, J. Guo and D. Wang, Nat. Commun., 2015, 6, 1–5 CrossRef.
- Y. B. Park, J. H. Kim, Y. J. Jang, J. H. Lee, M. H. Lee, B. J. Lee, D. H. Youn and J. S. Lee, ChemCatChem, 2019, 11, 443–448 CrossRef CAS.
- J. Xie, P. Yang, X. Liang and J. Xiong, ACS Appl. Energy Mater., 2018, 1, 2769–2775 CrossRef CAS.
- C. Wang, X. Long, S. Wei, T. Wang, F. Li, L. Gao, Y. Hu, S. Li and J. Jin, ACS Appl. Mater. Interfaces, 2019, 11, 29799–29806 CrossRef CAS PubMed.
- A. Srivastav, A. Verma, A. Banerjee, S. A. Khan, M. Gupta, V. R. Satsangi, R. Shrivastav and S. Dass, Phys. Chem. Chem. Phys., 2016, 18, 32735–32743 RSC.
- S.-S. Yi, B.-R. Wulan, J.-M. Yan and Q. Jiang, Adv. Funct. Mater., 2019, 1801902, 1–9 Search PubMed.
- J. Xiao, L. Fan, F. Zhao, Z. Huang, S.-F. Zhou and G. Zhan, J. Catal., 2020, 381, 139–149 CrossRef CAS.
- M. Li, Y. Yang, Y. Ling, W. Qiu, F. Wang, T. Liu, Y. Song, X. Liu, P. Fang, Y. Tong and Y. Li, Nano Lett., 2017, 17, 2490–2495 CrossRef CAS PubMed.
- K. D. Malviya, H. Dotan, D. Shlenkevich, A. Tsyganok, H. Mor and A. Rothschild, J. Mater. Chem. A, 2016, 4, 3091–3099 RSC.
- H. J. Pan, X. Y. Meng, D. Y. Liu, S. Li and G. W. Qin, Phys. Chem. Chem. Phys., 2015, 17, 22179–22186 RSC.
- A. Kay, I. Cesar and M. Grätzel, J. Am. Chem. Soc., 2006, 128, 15714–15721 CrossRef CAS PubMed.
- M. Ji, J. Cai, Y. Ma and L. Qi, ACS Appl. Mater. Interfaces, 2016, 8, 3651–3660 CrossRef CAS PubMed.
- D. Chen, Z. Liu, Z. Guo, M. Ruan and W. Yan, Chemsuschem, 2019, 12, 3286–3295 CrossRef CAS PubMed.
- S. L. Bai, X. J. Yang, C. Y. Liu, X. Xiang, R. X. Luo, J. He and A. F. Chen, ACS Sustain. Chem. Eng., 2018, 6, 12906–12913 CrossRef CAS.
- L. Wang, N. T. Nguyen, X. Huang, P. Schmuki and Y. Bi, Adv. Funct. Mater., 2017, 27, 1703527 CrossRef.
- I. S. Cho, H. S. Han, M. Logar, J. Park and X. Zheng, Adv. Energy Mater., 2016, 6, 1501840 CrossRef.
- K. X. Wang, Z. Yu, V. Liu, M. L. Brongersma, T. F. Jaramillo and S. Fan, ACS Photonics, 2014, 1, 235–240 CrossRef CAS.
- J. Li, Y. Qiu, Z. Wei, Q. Lin, Q. Zhang, K. Yan, H. Chen, S. Xiao, Z. Fan and S. Yang, Energy Environ. Sci., 2014, 7, 3651–3658 RSC.
- K. Kim, I.-H. Kim, K.-Y. Yoon, J. Lee and J.-H. Jang, J. Mater. Chem. A, 2015, 3, 7706–7709 RSC.
- W. Wang and L. Qi, Adv. Funct. Mater., 2019, 29, 1807275 CrossRef.
- Q.-D. Ou, H.-J. Xie, J.-D. Chen, L. Zhou, Y.-Q. Li and J.-X. Tang, J. Mater. Chem. A, 2016, 4, 18952–18962 RSC.
- H. Dotan, O. Kfir, E. Sharlin, O. Blank, M. Gross, I. Dumchin, G. Ankonina and A. Rothschild, Nat. Mater., 2013, 12, 158–164 CrossRef CAS PubMed.
- J. Xiao, F. Zhao, J. Zhong, Z. Huang, L. Fan, L. Peng, S.-F. Zhou and G. Zhan, Chem. Eng. J., 2020, 402, 126163 CrossRef CAS.
- J. W. Yoon, D. H. Kim, J. H. Kim, H. W. Jang and J. H. Lee, Appl. Catal., B, 2019, 244, 511–518 CrossRef CAS.
- S. C. Wang, P. Chen, J. H. Yun, Y. X. Hu and L. Z. Wang, Angew. Chem., Int. Ed., 2017, 56, 8500–8504 CrossRef CAS PubMed.
- R. Chong, G. Wang, Y. Du, Y. Jia, X. Wang, C. Li, Z. Chang and L. Zhang, Chem. Eng. J., 2019, 366, 523–530 CrossRef CAS.
- S. Wang, S. Li, W. Wang, M. Zhao, J. Liu, H. Feng, Y. Chen, Q. Gu, Y. Du and W. Hao, Sens. Actuators, B., 2019, 291, 34–41 CrossRef CAS.
- K. H. Ye, H. Li, D. Huang, S. Xiao, W. Qiu, M. Li, Y. Hu, W. Mai, H. Ji and S. Yang, Nat. Commun., 2019, 10, 3687 CrossRef PubMed.
- L. Pan, Y. Liu, L. Yao, R. Dan, K. Sivula, M. Grätzel and A. Hagfeldt, Nat. Commun., 2020, 11, 318 CrossRef CAS PubMed.
- S. Wang, P. Chen, Y. Bai, J. H. Yun, G. Liu and L. Wang, Adv. Mater., 2018, 30, 1800486 CrossRef PubMed.
Footnote |
| † Electronic supplementary information (ESI) available: Additional light harvesting efficiency spectra, SEM images and PEC performance. See DOI: 10.1039/d1ra02826j |
| This journal is © The Royal Society of Chemistry 2021 |