 Open Access Article
A highly efficient chemical approach to producing green phosphorylated cellulosic macromolecules†
El-Houssaine Ablouh *a,
François Brouilletteb,
Moha Taourirtec,
Houssine Sehaquia,
Mounir El Achaby
 a and
Ahmed Belfkirac
aMaterials Science, Energy and Nanoengineering Department (MSN), Mohammed VI Polytechnic University (UM6P), Lot 660 – Hay Moulay Rachid, Benguerir, 43150, Morocco. E-mail: elhoussaine.ablouh@um6p.ma; lhoussainiblah@gmail.com
bInnovations Institute in Ecomaterials, Ecoproducts, and EcoEnergies – Biomass Based (I2E3), Université du Québec à Trois-Rivières, Box 500, Trois-Rivières, QC G9A 5H7, Canada
cLaboratory of Bioorganic and Macromolecular Chemistry, Department of Chemistry, Faculty of Sciences and Technology, Cadi Ayyad University, Marrakesh, 40000, Morocco
First published on 9th July 2021
Abstract
The introduction of phosphate groups into cellulosic fibers allows for the tuning of their fire resistance, chelating and metal-adhesion properties, enabling the development of flame-retardant adhesive and adsorbent materials. Toward that end, the major challenge is developing a novel efficient and environmentally friendly phosphorylation route that offers an alternative to existing methods, which can achieve the targeted properties. For this purpose, cellulosic fibers were chemically modified herein using solid-state phosphorylation with phosphoric acid and urea without causing substantial damage to the fibers. The morphological, physicochemical, structural and thermal characterisations were examined using FQA, SEM, EDX, FTIR, 13C/31P NMR, conductometric titration, zeta potential measurement and thermogravimetric analysis. All the characterisations converge towards a crosslinked polyanion structure, with about 20 wt% grafted phosphates, a nitrogen content of about 5 wt% and a very high charge density of 6608 mmol kg−1. Phosphate groups are linked to cellulose through a P–O–C bond in the form of orthophosphate and pyrophosphates. Furthermore, thermal properties of the phosphorylated cellulosic fibers were investigated and a new degradation mechanism was proposed.
1. Introduction
Recently, scientific research has focused significant efforts on the use of natural cellulosic fibers that can replace synthetic-based products.1–3 The production of performant functional materials is a significant challenge due to the increasing demand for sustainable and eco-friendly products.4–7 Within this philosophy, the most abundant biopolymer available on earth has attracted considerable attention and offers many advantages, such as its biodegradability, recyclability and renewable character.8 Cellulose fibers are a type of a biopolymeric material that has been used by humans for a long time in a wide range of applications, such as clothing,8 packaging,9 textiles,10 food,11 drug release,12 the energy sector13–15 and the environment.16–18 However, their hydrophilic nature and their high flammability can be problematic for many applications.4 Consequently, there is a renewed and emergent interest in cellulose derivatives due to the inexhaustibility of this raw material. Among the more prominent cellulose derivatives are cellulose phosphates,19 which can be obtained by chemical treatments that introduce phosphate groups onto cellulose fibers.20–24 This modification is an essential step in order to obtain some needed properties, which are not normally found in the original cellulose structure. Thus, phosphorylated cellulose fibers have many advantageous properties that render them highly promising in many applications, such as composites,25 flame retardant materials3,5,26–28 and filters for the removal of heavy metals.29,30The hydroxyl groups in the cellulosic chain can be modified and functionalised via diverse chemical pathways, some requiring low energy consumption that is necessary to produce greener fibers with new and required properties. Chemical phosphorylation is one of these methods,3,5,8,24,31 which are categorised based on the location of the attack: either on the hydroxyl groups or by anhydroglucose unit (AGU) ring opening.32 This chemical method has been well-documented in recent studies that have frequently employed phosphorylating agents, such as phosphate esters,33 (NH4)2HPO4,3 H3PO4 (ref. 25) and P2O5.34 This method can be performed under homogeneous conditions or heterogeneous conditions with or without a swelling step in order to achieve the partial or uniform functionalisation of the biopolymer chains.35 Many routes for the phosphorylation of cellulosic materials have been developed, such as phosphorylation assisted by microwaves,13 the mechanochemical ball-milling method5 and heterogeneous or homogeneous media using a phosphate salt and phosphoric acid.22,24,31,36,37 The latter approaches are usually applied as chemical reactions using organic solvent or urea.38,39
In other methods, it is necessary to use non-toxic compounds to ensure that the fibers chains have the desired properties.11 Therefore, a promising green ecological approach is the modification by the phosphoric acid–urea reaction system using water as the solvent. The reactivity of the cellulosic chains in this route is increased, while the cellulose degradation is decreased through the incorporation of urea as a catalyst and a swelling agent.40 However, the phosphorylation efficiency is improved by incorporating phosphate groups into the cellulosic structure; this results in a high phosphorus content in terms of the highest degree of substitution, which is defined as the average number of substituted functional groups per AGU unit.8 Moreover, the heterogenic reaction occurs solvent-free in a urea melt with phosphoric acid.22,32 According to previous studies, the problem with this method is that there is a significant risk of degradation of the cellulosic materials; therefore, there is a low degree of substitution.24 Only a few studies have tried to improve this route by optimising the molar ratio of the reagent (cellulosic fibers/phosphoric acid/urea), time, temperature and functionality in order to achieve a high degree of substitution without fibers degradation.22,36 One of the solutions to this problem is to develop this approach in such a way that there is good contact between the fibers and the phosphorylating agent under the homogenisation temperature with a short reaction time.
In this respect, our study aimed to describe a simple, greener and previously unexplored route for direct phosphorylation of cellulosic fibers in order to increase the phosphorus content and avoid degradation of the structure of the fibers. Toward that end, the alternative phosphorylated samples were obtained by reacting cellulosic fibers with phosphoric acid and urea in two consecutive steps: (1) mixing the reagents with water to enhance the fibers swelling followed by water evaporation and (2) curing the dried sample under vacuum conditions at an optimised temperature to prevent the degradation phenomenon and to achieve structurally well-defined phosphorylated fibers. Detailed characterisation of the prepared phosphorylated fibers was obtained by solid-state nuclear magnetic resonance (31P and 13C NMR), Fourier transform infra-red attenuated total reflectance (FTIR-ATR) spectroscopy, scanning electron microscopy coupled with energy-dispersive X-ray analysis (SEM-EDX), fibers length distribution (FQA) thermogravimetric analysis (TGA) and zeta-potential measurement. Finally, we employed conductometric titration to define the total charge density.
2. Experimental section
2.1 Materials
The cellulosic materials used in this study are bleached softwood Kraft (PK) fibers supplied by Kruger Wayagamack (Trois Rivières, Canada). All chemical reagents were used as received from Sigma Aldrich suppliers: phosphoric acid (85%) and urea (ACS reagent 99%). Deionized water was used in all reactions. Hydrochloric acid and sodium hydroxide are of analytical grade, supplied by Analar Normapur.2.2 Phosphorylation of cellulosic fibers
The cellulosic fibers (PK) are first washed with sodium hydroxide solution (0.1 M) to remove low molecular weight organic acids. In a flask containing 50 mL of deionized water, we introduced the three components: dry cellulosic fibers (PK), H3PO4 and urea (Table 1). To keep the molar ratio constant and to have intimate contact between the different components of the phosphorylation reaction, 1 g of PK fibers was impregnated with the reaction mixture. After 24 hours, the water is evaporated off under vacuum using a rotavapor (Heidolph Hei-VAP, Germany) at 90 °C. Once the water has been removed, the remaining solid is heated in the flask by raising the temperature of the rotavapor bath to 120 °C for 2 hours under vacuum. The phosphorylated cellulosic fibers (PKP) are dispersed and washed several times with deionized water to remove unreacted reagents.| Samples | PKP1 | PKP2 | PKP3 | PKP4 | PKP5 |
Molar ratio (PK![[thin space (1/6-em)]](https://www.rsc.org/images/entities/char_2009.gif) : :![[thin space (1/6-em)]](https://www.rsc.org/images/entities/char_2009.gif) H3PO4 H3PO4![[thin space (1/6-em)]](https://www.rsc.org/images/entities/char_2009.gif) : :![[thin space (1/6-em)]](https://www.rsc.org/images/entities/char_2009.gif) urea) urea) |
1![[thin space (1/6-em)]](https://www.rsc.org/images/entities/char_2009.gif) : :![[thin space (1/6-em)]](https://www.rsc.org/images/entities/char_2009.gif) 2 2![[thin space (1/6-em)]](https://www.rsc.org/images/entities/char_2009.gif) : :![[thin space (1/6-em)]](https://www.rsc.org/images/entities/char_2009.gif) 4 4 |
1![[thin space (1/6-em)]](https://www.rsc.org/images/entities/char_2009.gif) : :![[thin space (1/6-em)]](https://www.rsc.org/images/entities/char_2009.gif) 2 2![[thin space (1/6-em)]](https://www.rsc.org/images/entities/char_2009.gif) : :![[thin space (1/6-em)]](https://www.rsc.org/images/entities/char_2009.gif) 10 10 |
1![[thin space (1/6-em)]](https://www.rsc.org/images/entities/char_2009.gif) : :![[thin space (1/6-em)]](https://www.rsc.org/images/entities/char_2009.gif) 2 2![[thin space (1/6-em)]](https://www.rsc.org/images/entities/char_2009.gif) : :![[thin space (1/6-em)]](https://www.rsc.org/images/entities/char_2009.gif) 16 16 |
1![[thin space (1/6-em)]](https://www.rsc.org/images/entities/char_2009.gif) : :![[thin space (1/6-em)]](https://www.rsc.org/images/entities/char_2009.gif) 3 3![[thin space (1/6-em)]](https://www.rsc.org/images/entities/char_2009.gif) : :![[thin space (1/6-em)]](https://www.rsc.org/images/entities/char_2009.gif) 4 4 |
1![[thin space (1/6-em)]](https://www.rsc.org/images/entities/char_2009.gif) : :![[thin space (1/6-em)]](https://www.rsc.org/images/entities/char_2009.gif) 2 2![[thin space (1/6-em)]](https://www.rsc.org/images/entities/char_2009.gif) : :![[thin space (1/6-em)]](https://www.rsc.org/images/entities/char_2009.gif) 0 0 |
2.3 Characterization techniques
3. Results and discussion
3.1 Morphological and length distribution of phosphorylated cellulosic fibers
The surface state of unmodified and modified fibers was studied by means of SEM. The images obtained gave us an idea on the degree of modification undergone by the fibers. For the native fibers (Fig. 1a), we have images similar to those observed by other authors in previous studies.22,36,41 A smooth surface can be seen without damaged areas. On the other hand, the SEM micrographs of the phosphorylated cellulosic fibers, for different molar ratios (1/2/4, 1/2/10 and 1/3/4), show surfaces with modifications related to the molar ratio of the different components of the phosphorylation reaction. During the reaction, the cellulose chains constituting the fibers, especially the amorphous regions, in addition to the grafting of phosphate groups, undergo degradation reactions, essentially chain cuts. These two combined actions, in addition to the phenomenon of osmosis, contributes to the erosion, thinning or even degradation of fibers. At high magnification, it is possible to observe the degree of modification undergone by the fibers according to the urea and phosphoric acid level. The surfaces of fibers obtained using the molar ratios 1/2/4 and 1/2/10, represented in Fig. 1b and c, respectively, suffered little damage compared to the fibers obtained with a molar ratio of 1/3/4. The image corresponding to this latter ratio (Fig. 1d), shows an accentuated degradation of the fibers. We can say, by referring to the surface state of the fibers, that the ideal phosphorylation ratio is 1/2/10. This is confirmed by the other analyses. The length of the fibers is not affected enough, and the fixed phosphate level is optimum for this ratio (around 20%).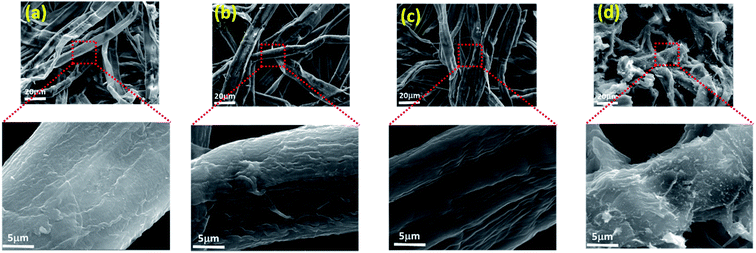 | ||
| Fig. 1 Scanning electron microscopy micrographs at different magnifications of the surface view of (a) PK, (b) PKP1, (c) PKP2 and (d) PKP4. | ||
The length and distribution of the cellulosic fibers of the various samples were determined using a Fiber Quality Analyser (FQA). Table 2 gives the average fiber length and the percentage of fines, measured before and after phosphorylation. These measurements make it possible to evaluate the effect of the cleavage of the fibers with the chemical reactions carried out on the fiber. The increase in fine percentage is due to erosion of the fiber surfaces, as we have discussed before. In addition to degradation during phosphorylation reaction, the grafting of phosphates at the fiber surfaces makes them hydrophilic, which causes a strong absorption of water with the phenomenon of osmosis. The combined action of the various mechanical operations during the reaction (stirring, filtration, washing, etc.) causes the phenomena of the erosion of the surfaces of the fibers and, consequently, an increase in fines. The results grouped in Table 2 are in agreement with the images obtained with SEM. Fibers treated with a 1/2/10 molar ratio (PKP2) have a greater average length than those of other phosphorylated fibers. The increased amount of acid (PKP4) does more damage by causing the severe degradation of the fibers. Also, the diameter of the treated fibers, compared to that of the untreated fibers, is slightly larger. This is likely due to swelling caused by osmosis.
| Samples | Average length (mm) | Average diameter (μm) | Arithmetic length (mm) | Average fine fibers (%) | Arithmetic fine (%) |
|---|---|---|---|---|---|
| PK | 1.523 ± 0.026 | 28.6 ± 1.072 | 0.824 | 47.5 | 97.4 |
| PKP1 | 0.666 ± 0.011 | 32.0 ± 2.103 | 0.481 | 62.0 | 97.5 |
| PKP2 | 0.856 ± 0.023 | 29.5 ± 1.922 | 0.594 | 42.9 | 96.3 |
| PKP3 | 0.655 ± 0.016 | 28.1 ± 1.180 | 0.476 | 60.3 | 97.5 |
| PKP4 | 0.510 ± 0.009 | 35.1 ± 2.263 | 0.381 | 86.7 | 99.3 |
3.2 Elemental analysis and mapping of modified cellulosic fibers
Energy dispersive X-ray, ICP-OES and Kjeldahl method analyses were performed to determine chemical composition of phosphorylated fibers. The comparison of the percentages of the various elements likely to be present at the surface, before and after the phosphorylation reaction, allows us to determine the degree of the grafting of the phosphate and nitrogen groups. The EDX spectrum of unmodified fibers (PK), taken as a reference, shows only two peaks corresponding to the elements C and O (Fig. S1†). In addition, the phosphorylated samples show other peaks corresponding to phosphorus and nitrogen. The intensities of the different peaks are proportional to their presence on the surface. There is a decrease in the percentages of carbon and oxygen to the detriment of a proportional increase in phosphorus and nitrogen. The levels of these two elements depend on the molar ratio of cellulosic unit, phosphoric acid and urea. The results of the analyses performed using three techniques of the various prepared samples are grouped in Table 3. It is clear that the presence of urea is necessary to carry out phosphorylation (1![[thin space (1/6-em)]](https://www.rsc.org/images/entities/char_2009.gif) :
:![[thin space (1/6-em)]](https://www.rsc.org/images/entities/char_2009.gif) 2
2![[thin space (1/6-em)]](https://www.rsc.org/images/entities/char_2009.gif) :
:![[thin space (1/6-em)]](https://www.rsc.org/images/entities/char_2009.gif) 0). The other samples show a phosphate content greater than 10%. The most interesting result is that obtained for PKP2. In fact, in addition to the high phosphate content, the length of the phosphorylated fibers is the greatest and the level of fines is lower (Table 2). The quantification of the amount of grafted phosphorus as a function of the amount of urea used clearly shows that a large proportion of the cellulosic fibers have been phosphorylated with a high percentage compared to the previous works, which do not exceed 13% of P.20–22,36,42–47
0). The other samples show a phosphate content greater than 10%. The most interesting result is that obtained for PKP2. In fact, in addition to the high phosphate content, the length of the phosphorylated fibers is the greatest and the level of fines is lower (Table 2). The quantification of the amount of grafted phosphorus as a function of the amount of urea used clearly shows that a large proportion of the cellulosic fibers have been phosphorylated with a high percentage compared to the previous works, which do not exceed 13% of P.20–22,36,42–47
| Samples | Nitrogen content (%) | Phosphorus content (%) | ||||||
|---|---|---|---|---|---|---|---|---|
| EDX | Kjeldahl method | EDX | ICP | |||||
| N | DSN(EDX) | N | DSN(KJ) | P | DSP(EDX) | P | DSP(ICP) | |
| PK | — | — | — | — | — | — | — | — |
| PKP1 | 4.09 ± 2.06 | 0.54 | 5.21 ± 0.01 | 0.71 | 14.87 ± 3.70 | 1.26 | 16.17 ± 3.30 | 1.44 |
| PKP2 | 4.94 ± 2.75 | 0.67 | 5.41 ± 0.27 | 0.75 | 19.23 ± 4.77 | 1.99 | 22.08 ± 0.61 | 2.68 |
| PKP3 | 6.85 ± 2.94 | 1.00 | 7.81 ± 0.37 | 1.19 | 18.92 ± 5.20 | 1.93 | 21.59 ± 1.06 | 2.54 |
| PKP4 | 4.37 ± 3.06 | 0.58 | 5.67 ± 0.06 | 0.79 | 11.05 ± 5.11 | 0.80 | 12.02 ± 1.41 | 0.90 |
| PKP5 | 0.00 | 0.00 | 0.56 ± 0.12 | 0.06 | 0.00 | 0.00 | 2.01 ± 0.49 | 0.11 |
Moreover, we carried out several tests by varying the concentration of phosphoric acid, considering the degradation effects of cellulosic chains, which can be generated by the release of acid at high temperatures.3 It was found that the content of the P element in the phosphorylated samples (PKP1 and PKP4) decreased sharply from 14.87 to 11.05% in an acid concentration of 2 and 3 M, respectively. A further increase in the concentration of acid affected the phosphorus content and caused severe degradation of the fibers. Therefore, the presence of urea is essential to introduce phosphate moiety to the cellulosic chains without damaging the fibers, which is confirmed by the elemental analyses performed for sample PKP5 (Table 3) where the molar ratio used is 1![[thin space (1/6-em)]](https://www.rsc.org/images/entities/char_2009.gif) :
:![[thin space (1/6-em)]](https://www.rsc.org/images/entities/char_2009.gif) 2
2![[thin space (1/6-em)]](https://www.rsc.org/images/entities/char_2009.gif) :
:![[thin space (1/6-em)]](https://www.rsc.org/images/entities/char_2009.gif) 0.
0.
Fig. 2 represents the elementary mapping of the various atoms present at the surface of the phosphorylated fibers (PKP2). It can be seen that the phosphorus density is high and uniformly distributed. It completely covers the fibers. Likewise, nitrogen also uniformly covers the surface of the fibers with a lower density. This result is in agreement with the percentages of the various chemical elements that are present. The proposed phosphorylation method is an efficient way to homogeneously incorporate the phosphate groups on the surfaces of the PK without significant damage.
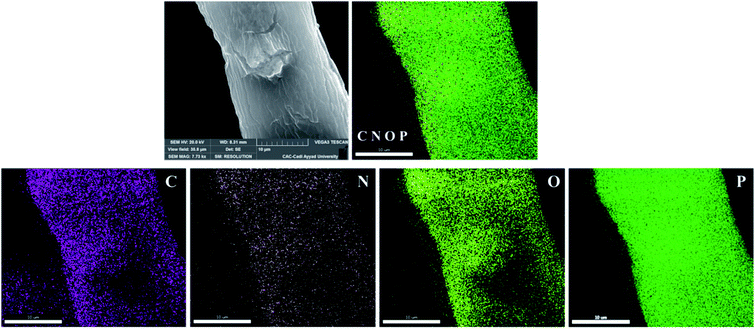 | ||
| Fig. 2 Elemental mapping for carbon, oxygen, nitrogen, and phosphorus in phosphorylated cellulosic fibers PKP2. | ||
The degrees of substitution, DSP and DSN, per unit of glucose, were calculated with the two equations, respectively ((1) and (2)), using the phosphorus and nitrogen contents measured with elemental analysis (EDX).10,21 The two degrees, DSP and DSN, of substitution are reported in Table 3. A maximum substitution is obtained for the 1/2/10 reaction mixture. This result constitutes the best compromise between a high phosphorus content and an minimum cleavage of the fibers. It is also in agreement with the mapping images since phosphorus density at the surface level is extremely high. For nitrogen, the highest value of DSN (1.19) is obtained with the conditions of the phosphorylation of PKP3. It is probably related to the amount of urea used.
 | (1) |
 | (2) |
3.3 Chemical structure of phosphorylated cellulosic fibers
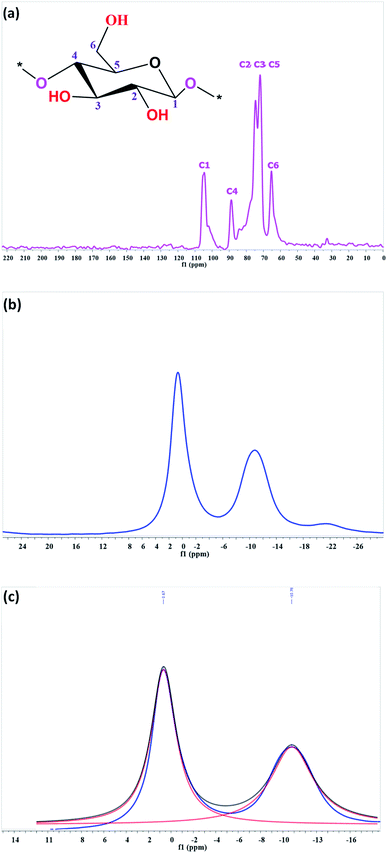
FTIR and NMR spectroscopy analyses, zeta-potential measurements and conductometric titration of native and various phosphorylated cellulosic fibers were performed in order to confirm the phosphorylation reaction. To provide more information on the structure of the phosphorylated compounds, the 13C NMR analysis was carried out. Chemical shifts are sensitive to changes in the environments of each carbon. The 13C NMR spectrum informs us of the modifications undergone by the carbons and the changes in their environments. The 13C NMR spectrum of phosphorylated fibers shows no difference in chemical shift from that of unmodified fibers. As can be seen from the spectrum (Fig. 3a), signal and broad peak perceptible between 57 and 68 ppm correspond to the C6 of the primary alcohol group in the cellulosic cycle. The bulk chemical shift between 69 and 82 ppm is attributed to C5, C3 and C2, and the peak between 102 and 108 ppm is attributed to C1. These results are consistent with the data reported in the literature and indicate that the grafted phosphate groups do not generate specific changes in the chemical shifts of 13C.3,24,36,48The grafting of the phosphate groups on the cellulosic fibers is indicated by the presence of peaks in the 31P NMR spectrum. According to the 31P NMR data published on phosphorylated cellulosic materials, phosphorus groups appear in the region of 0–10 and −5 to 10 ppm for orthophosphate and pyrophosphates, respectively.5,22,49,50 In our case, the spectrum of phosphorylated PKP2, using 10 moles of urea, showed clear peaks. An intense signal at 0.67 ppm is attributed to the orthophosphate groups and a less intense signal at −10.76 ppm is due to the presence of pyrophosphate groups (Fig. 3b). However, peak identification in solid-state spectra was developed with their deconvolution, resulting in one peak for orthophosphate diesters and one for pyrophosphate (Fig. 3c). The absence of a phosphoric acid peak confirmed the efficiency of the washing process with deionised water after the reaction to remove any unbound phosphate groups.
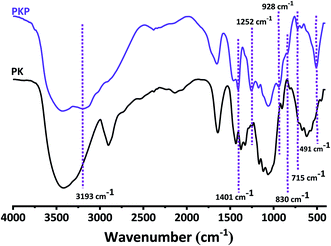
The results of the 31P and 13C NMR analyses were confirmed by FTIR spectroscopy (Fig. 4). The spectra all show glucosidic units. The characteristic bands at 3427, 2898 and 1051 cm−1 correspond to the stretching vibrations of O–H, C–H and C–O–C of the glucosidic units, respectively.21,36,51 Another absorption around 1649 cm−1 is attributed to the O–H bending of the adsorbed water.51 The sharp peak at 1428 cm−1 can be attributed to the C–H bending vibrations. The 667 cm−1 band is characteristic of the OH vibration band.52
The grafting of phosphate groups is accompanied by the appearance of new bands in the FTIR spectrum of phosphorylated fibers. As we have already seen with EDX, in addition to carbon and oxygen, phosphorylated fibers contain phosphorus and nitrogen. These two elements are present in the form of P![[double bond, length as m-dash]](https://www.rsc.org/images/entities/char_e001.gif) O, O–P–OH, P–O–C, P–OH, –P–NH2, –P–NH–. The most intense of these bands is at 1401 and 1252 cm−1, assigned to the vibration of P
O, O–P–OH, P–O–C, P–OH, –P–NH2, –P–NH–. The most intense of these bands is at 1401 and 1252 cm−1, assigned to the vibration of P![[double bond, length as m-dash]](https://www.rsc.org/images/entities/char_e001.gif) O of the orthophosphate diester19,38,44,53 and P
O of the orthophosphate diester19,38,44,53 and P![[double bond, length as m-dash]](https://www.rsc.org/images/entities/char_e001.gif) O stretching vibrations,36,49,51 respectively. The formation of –P–NH2 structures was confirmed by the appearance of two bands at 715 and 3193 cm−1, assigned respectively to P–NH groups and stretching vibrations of N–H.53 In addition, with regard to the phosphorylated fibers (PKP), the IR spectra exhibit new bands at 497 cm−1, corresponding to the bending vibration of O–P–OH.45 The FTIR spectrum of PKP, which also presents a characteristic absorption of 830 and 928 cm−1, is indicative of the stretching mode of the P–O–C aliphatic bond5,22 and P–OH.42,43,51
O stretching vibrations,36,49,51 respectively. The formation of –P–NH2 structures was confirmed by the appearance of two bands at 715 and 3193 cm−1, assigned respectively to P–NH groups and stretching vibrations of N–H.53 In addition, with regard to the phosphorylated fibers (PKP), the IR spectra exhibit new bands at 497 cm−1, corresponding to the bending vibration of O–P–OH.45 The FTIR spectrum of PKP, which also presents a characteristic absorption of 830 and 928 cm−1, is indicative of the stretching mode of the P–O–C aliphatic bond5,22 and P–OH.42,43,51
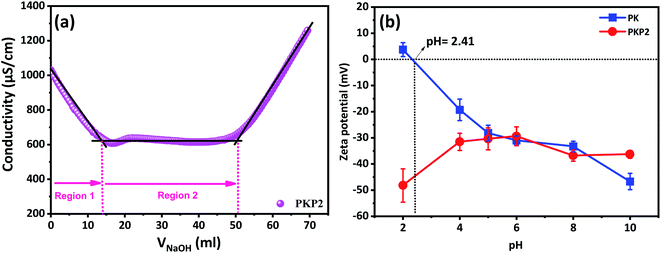
In addition to the sulphonate, the grafting of the phosphate groups confers the fibers a polyanionic character. It is possible to measure the rate of charge carried by these fibers with conductimetric titration. After being washed with deionised water several times, the phosphorylated cellulosic samples are titrated with a 0.1 N sodium hydroxide solution. The groups present at the surface of phosphorylated fibers are of three types. In addition to the acidic functions of the phosphate groups grafted onto the surface of the fibers, there are also the sulphonates and carboxylates originating from oxidation, essentially of the primary alcohol of the fibers, from chemical treatment during their production. The neutralisation of these acid functions allow us to determine the total charge content of the phosphate groups, which can provide information on the structure of phosphorylated fibers.3,22 The change in potential as a function of the volume of the sodium hydroxide solution is shown in Fig. 5a.
The dosage of acid groups in unmodified fibers is approximately 100 μeq. g−1.33 The dosed acid functions are those of the sulfonate and carboxylate functions originating from the oxidative treatment of the fibers during the isolation and bleaching of the cellulosic fibers. Therefore, they are the first to be neutralised in an assay. The first segment (zone 1) is attributable to the neutralisation of these acid functions. The second segment, in the form of a straight line, is attributable to the neutralisation of the protons of the phosphate groups. The volume consumed during the neutralisation of these groups allows us to calculate the number of equivalents or, in other words, the charge rate. The found load rate is 6608 mmol kg−1, i.e. 66 times more than with unmodified fibers. A large increase was generally observed in total charge content upon phosphorylation, which reached an optimal value using a molar ratio of 1/2/10 at 120 °C for two hours. To the best of our knowledge, this is among the highest charge content reported in literature for phosphorylated cellulosic fibers (Table 4).
| Cellulosic materials | Phosphorylating agent | Total charge contents (mmol kg−1) | References |
|---|---|---|---|
| Cellulose nanocrystals | P2O5 | 3300 | 5 |
| Cellulose fiber | (NH4)2HPO4 | 1180 | 24 |
| Cellulose nanofibrils | (NH4)2HPO4 | 2000 | 28 |
| Nanocellulose | H3PO4 | 1173 | 48 |
| Cellulose fiber | H3PO4 | 500 | 47 |
| Cellulose nanofibrils | NaH2PO4 | 900 | 54 |
| Cellulose nanofiber | NH4H2PO4 | 1230 | 55 |
| Cellulosic fibers | H3PO4 | 6608 | This study |
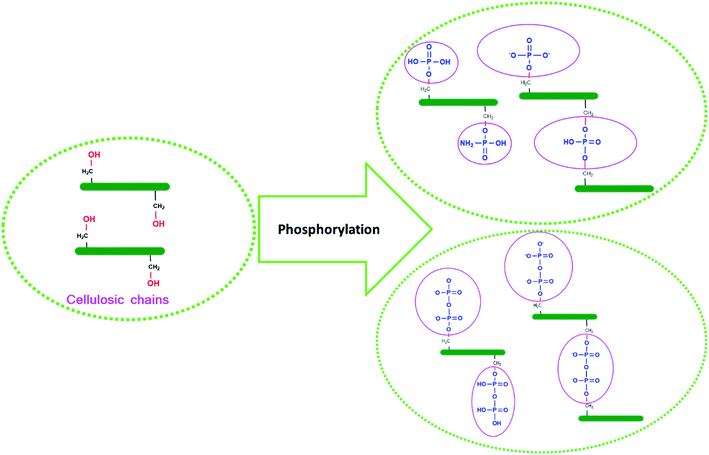
To understand the surface charge characteristics of fibers before and after the phosphorylation process, an evolution of zeta potential, as a function of pH, was determined (Fig. 5b). The obtained results indicate that PK have positive zeta potential values with acidic pH (pH < 2.41) but are negatively charged with basic pH. This result is similar to that of previous studies, which reveal that negative charge must originate from deprotonation.56 On the other hand, the negative charge present in PKP2 was found to be higher in absolute value than that of PK due to the increase in the contents of the introduced phosphoric groups. Most importantly, surface charge characterisation by zeta potential not only further confirms the successful phosphorylation of PK but is also more sensitive to show surface changes from the introduced phosphates groups. The potential applications of this type of materials are numerous, for instance, cation exchange medium with its high charge and large hydrodynamic volume in aqueous media. Moreover, such materials can be used in different formulations: in water-based paints as a dispersing agent, stabiliser and rheological agent. The problems with the stability of emulsions and products can be solved with this type of product. The results of structural characterisation and the physico-chemical analysis of the PKP led us to propose an approximate structure after phosphorylation (Fig. 6).
3.4 Thermal studies of phosphorylated fibers
Phosphorylated fibers are products that have anti-fire properties. Several studies have shown that the presence of phosphate groups prevent the spread of flames by preventing the diffusion of the oxidant, oxygen, inside the material.25,27,40,57 The phosphate groups form a protective shell. To better understand the mechanism of decomposition and the formation of the protective layer by the phosphate groups, we refer to what has already been done in this field.The monitoring of the decomposition of cellulose as a function of temperature and the analysis of the products formed during decomposition have shown that, primarily, dehydration, rearrangements and depolymerisation occur. At temperatures below 400 °C, the monomeric repeating unit cellobiose mainly transforms into levoglucosan.33,45 The examination of Fig. 7 and S2† shows that the introduction of phosphate groups lowers the onset of decomposition towards low temperatures. We have recorded the various successive losses in Table 5 and the temperature intervals at which they occur.
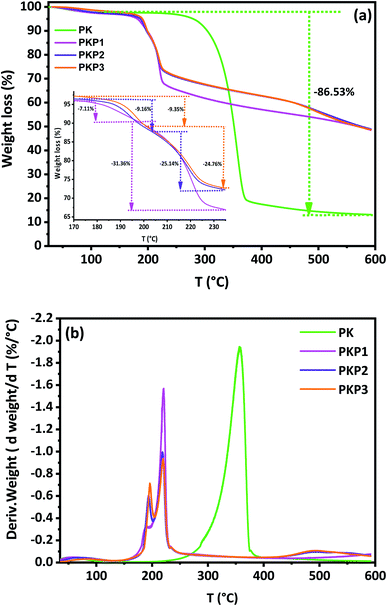 | ||
| Fig. 7 TG (a) and DTG (b) curves of untreated (PK) and treated cellulosic fibers (PKP1, PKP2, PKP3). | ||
| Samples | First stage | Second stage | Third stage | Fourth stage | Residue at 600 °C (%) | ||||
|---|---|---|---|---|---|---|---|---|---|
| Tmax (°C) | Δm (%) | Tmax (°C) | Δm (%) | Tmax (°C) | Δm (%) | Tmax (°C) | Δm (%) | ||
| PK | 54 | 1.87 | 357 | 84.66 | — | — | — | — | 13.46 |
| PKP1 | 60 | 2.86 | 189 | 7.11 | 221 | 31.36 | — | 10.30 | 48.37 |
| PKP2 | 71 | 2.73 | 193 | 9.16 | 218 | 25.14 | 490 | 13.08 | 49.89 |
| PKP3 | 82 | 2.62 | 196 | 9.35 | 220 | 24.76 | 492 | 15.02 | 48.25 |
| PKP4 | 74 | 2.13 | 193 | 5.44 | 225 | 29.01 | — | 16.54 | 46.88 |
| PKP5 | 62 | 1.97 | 340 | 86.91 | — | — | — | — | 11.12 |
While unmodified cellulosic fibers are characterised by two maximum mass-loss temperatures, phosphorylated cellulosic fibers displayed four degradation stages (Fig. 7b). The two temperatures (Tmax/°C) of PK are 54 °C and 357 °C, which correspond successively to the mass losses (Δm/%) of water adsorbed by the fibers (1.87%) and the decomposition of cellulose chains (84.66%). In addition to the loss of water, the phosphorylated fibers exhibit three degradation stages characterised by different temperatures (Tmax/°C) and losses (Δm/%), as can be seen in Table 5 and Fig. S3.† The total loss represents about 50% at 600 °C. This behaviour of PKP is well known; thermal degradation and early charcoal formation are responsible for the resistance to fire propagation of materials containing phosphates.
In a previous work, we focused on the empirical mechanism proposed by various researchers to explain the degradation of phosphorylated fibers and the formation of the protective layer.33 It appears from these studies that there is first a release of phosphoric acid into the medium. With the combined effect of phosphoric acid and temperature, classic dehydration reactions take place. There is formation of unsaturation in the repeating units of the cellulose chains. The presence of hydroxyls of the glucopyranose and of the newly created unsaturation promote the formation of carbonyl groups through a keto–enol balance.58
Also, a highly phosphorylated sample with a phosphorus content of about 20% (DSP > 2) begins to decompose at lower temperatures than unmodified cellulosic fibers. The first step with a mass loss (Δm/%) of 2.73 at a temperature Tmax of 71 °C corresponds to the loss of water that has been adsorbed. The quantity of water and the temperature associated with this phenomenon are higher than those of PK alone. This is a predictable result, given the presence of highly polar and hydrophilic phosphate groups. The second mass loss of 9.16%, at a temperature of 193 °C, corresponds to dehydration reactions accompanying the departure of phosphoric acid (Fig. 7b). Indeed, it has been shown that the first group that leaves the phosphorylated chains is the phosphate group;33 of the four phosphate groups grafted onto the repeating unit of the cellulose chains of the fibers, we believe that those located in the C2 carbon, the most crowded region, without free rotation, are the first to leave. Studies carried out on polystyrene show that the grafting of acetate groups in the alpha carbon of styrene (α-acetoxystyrene) causes the polystyrene chain to lose all flexibility. Poly α-acetoxystyrene has no glass transition or melting temperature, and releases acetic acid at 170 °C.59 This is mainly due to the steric hindrance created by the acetoxy group on the polystyrene chain. Phosphate groups of C6, where there is less steric hindrance, require more energy and are released secondly under the combined acid and temperature effect. The conditions are favourable (high temperature, acidic medium and presence of hydroxyls) for reactions, especially dehydration, levoglucosan formation, depolymerisation and others, such as rearrangements.
A study was carried out in 2009 to determine the nature of the products formed during the heat treatment of cellulose.60 The number of products detected with the gas-chromatography technique exceeded 100. But the majority of products are in the following order: levoglucosan (53%), hydroxyacetaldehyde (8.7%), hydroxyacetone (3.4%) and acetone (3%). The formation of levoglucosan is thermodynamically favoured by the chain-end mechanism due to the lowest energy barrier.61 The second weight loss (9.16%) is attributed to the dehydration of anhydroglucose and, at the same time, to depolymerisation and the formation of levoglucosan. Also, the phosphoric acid formed undergoes a condensation reaction at this temperature.62 The third loss of 25.14% is attributed to the formation and evaporation of levoglucosan. Indeed, its molar mass is 162 g mol−1 and the mass of the starting repeating unit, tetraphosphorylated cellobiose, is 662 g mol−1. The percentage that represents the loss of levoglucosan is (162/662) × 100 = 24.47%. This result fits well with our previous study.33
With the significant conversion of organic mass, almost 50%, we assume that there is a regular mechanism, not random like the radical mechanism, of formation of a product (levoglucosan in this case). It is a chain reaction of depolymerisation promoted by the presence of the C6 phosphate group. This phosphate group is a good nucleofuge and facilitates attacks of the oxygen doublet of the α-hydroxyl of C1, at the end of the cellulose chain, on the highly electrophilic C6 carbon. This mechanism can take place more easily if the hydroxyl group of C1, at the end of the cellulose chain, is in position α. Due to mutarotation equilibrium, more than 36% of the hydroxyl of C1 is in position α and 70% in position β. Indeed, in position α, it is much closer to C6 and can make a nucleophilic attack, facilitated by electrophilic and accentuated by the electronegative phosphate group. In position β, the hydroxyl of C1 is more distant and it is difficult to imagine such an attack. We believe that under the conditions of the reaction, there is enough energy for this reaction to take place. We propose a mechanism for the formation of levoglucosan, the main product, in 3 stages (Fig. 8). The first stage is the modification of the position of the hydroxyl of C1, from position β to α. The second step is the attack of the oxygen doublet of the hydroxyl of C1 on C6 and departure of the phosphate. The last step is the hydrolysis of the anhydroglucose and levoglucosan bond. It is a chain depolymerisation mechanism.
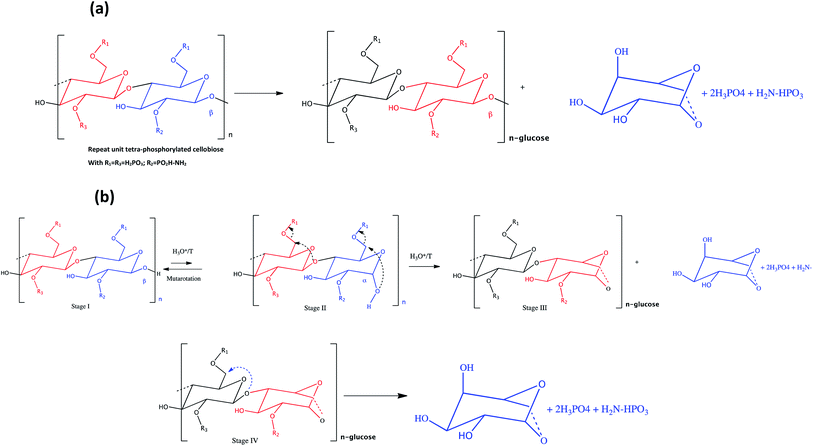 | ||
| Fig. 8 (a) Repeating unit and formation of levoglucosan, and (b) mechanism of depolymerization of phosphorylated cellulosic chains. | ||
The rest of the product is composed of non-volatile products such as phosphates and cellulosic fibers modified into heavy compounds, mainly charcoal. Their heat treatment at 490 to 600 °C generates a remaining 49% residue. The mass loss between 490 and 600 °C is 13.08%. We believe that during this heat treatment, the most probable reaction is the polycondensation of the phosphate groups into polyphosphate P4O10, with the elimination of water and CO from organic residues and others.
4. Conclusion
The application of phosphorylated cellulosic materials has already shown great promise in the field of materials science and constitutes a greener alternative for the environment. In this study, we expanded this repertoire with the elaboration of novel eco-friendly phosphorylated cellulosic fibers, which have been successfully fabricated by an improved solid-phase modification method – a simple approach and an environmentally friendly route with great efficiency compared to those cited in literature. For the first time, the final phosphorus and nitrogen contents of prepared phosphorylated fibers can reach approximately 20 and 5%, respectively, with a maximum DSP value of 2.68. Also, there was a high value of total charge content upon phosphorylation, which reached an value of 6608 mmol kg−1. The negatively charged PKP was confirmed with zeta-potential measurement, which makes it a promising ion-exchange material. SEM results clearly show that phosphorylation reaction prevents the cleavage of the fibers and preserves its initial surface morphology. By using the results obtained from the detailed application of the 13C/31P NMR spectra, in combination with the results from FTIR studies, it has been demonstrated that the reaction between cellulosic fibers and phosphoric acid results in surface orthophosphate and pyrophosphates groups, either with crosslinking or grafting.It was also shown that the thermal properties of phosphorylated cellulosic fibers are largely different compared to those of PK, as they form more residues and they significantly suppress the release of low-molecular toxic combustible gases. The greatest benefit of this new approach is the obtained non-degraded fibers with high phosphorus and nitrogen contents, whose properties fit the phosphorylated PK-targeted application, especially in flame-retardancy and ion-exchange materials.
Conflicts of interest
There are no conflicts to declare.Acknowledgements
We would like to thank Dr Ahmed Radi, Cadi Ayyad University, for reviewing the linguistic aspects of this article.References
- J. R. G. Navarro, J. Rostami, A. Ahlinder, J. B. Mietner, D. Bernin, B. Saake and U. Edlund, Biomacromolecules, 2020, 21, 1952–1961 CrossRef CAS.
- M. Ghanadpour, F. Carosio, M. C. Ruda and L. Wågberg, ACS Appl. Mater. Interfaces, 2018, 10, 32543–32555 CrossRef CAS.
- M. Ghanadpour, F. Carosio, P. T. Larsson and L. Wågberg, Biomacromolecules, 2015, 16, 3399–3410 CrossRef CAS.
- T. P. Molaba, S. Chapple and M. J. John, J. Appl. Polym. Sci., 2016, 133, 1–10 CrossRef.
- B. G. Fiss, L. Hatherly, R. S. Stein, T. Friščić and A. Moores, ACS Sustainable Chem. Eng., 2019, 7, 7951–7959 CrossRef CAS.
- E. Ablouh, Z. Hanani, N. Eladlani, M. Rhazi and M. Taourirte, Sustainable Environ. Res., 2019, 29, 5 CrossRef CAS.
- E.-H. Ablouh, R. Jalal, M. Rhazi and M. Taourirte, Int. J. Biol. Macromol., 2020, 151, 492–498 CrossRef CAS PubMed.
- Y. Yang, Y. Lu, K. Zeng, T. Heinze, T. Groth and K. Zhang, Adv. Mater., 2020, 2000717 Search PubMed.
- A. M. Youssef, M. A. El-Samahy and M. H. Abdel Rehim, Carbohydr. Polym., 2012, 89, 1027–1032 CrossRef CAS PubMed.
- D. Klemm, B. Philipp, T. Heinze, U. Heinze and W. Wagenknecht, Comprehensive Cellulose Chemistry, Wiley, 1998, vol. 2 Search PubMed.
- N. Reddy and Y. Yang, Green Chem., 2005, 7, 190 RSC.
- A. Essaghraoui, K. Khatib, B. Hamdaoui, F. Brouillette, E.-H. Ablouh and A. Belfkira, J. Pharm. Innovation, 2021, 1–11 Search PubMed.
- N. Gospodinova, A. Grelard, M. Jeannin, G. C. Chitanu, A. Carpov, V. Thiéry and T. Besson, Green Chem., 2002, 4, 220–222 RSC.
- A. Zyane, E. Ablouh, E. M. Sabbar, F. Brouillette and A. Belfkira, Heliyon, 2020, 6, e04977 CrossRef.
- X. Zeng, L. Deng, Y. Yao, R. Sun, J. Xu and C.-P. Wong, J. Mater. Chem. C, 2016, 4, 6037–6044 RSC.
- S. Chaouf, S. El Barkany, H. Amhamdi, I. Jilal, Y. El Ouardi, M. Abou-salama, M. Loutou, E.-H. Ablouh, H. El Ouarghi and A. El Idrissi, Mater. Today: Proc., 2020, 31, S175–S182 CAS.
- S. Chaouf, S. El Barkany, I. Jilal, Y. El Ouardi, M. Abou-salama, M. Loutou, A. El-Houssaine, H. El-Ouarghi, A. El Idrissi and H. Amhamdi, J. Water Process. Eng., 2019, 31, 100807 CrossRef.
- I. Jilal, S. El-Barkany, Z. Bahari, O. Sundman, A. El-Idrissi, M. Abou-Salama, M. Loutou, E. Ablouh and H. Amhamdi, Mater. Today: Proc., 2019, 13, 909–919 CAS.
- P. L. Granja, L. Pouységu, M. Pétraud, B. De Jéso, C. Baquey and M. A. Barbosa, J. Appl. Polym. Sci., 2001, 82, 3341–3353 CrossRef CAS.
- N. Inagaki, S. Nakamura, H. Asai and K. Katsuura, J. Appl. Polym. Sci., 1976, 20, 2829–2836 CrossRef CAS.
- D. M. Suflet, G. C. Chitanu and V. I. Popa, React. Funct. Polym., 2006, 66, 1240–1249 CrossRef CAS.
- Y. Shi, D. Belosinschi, F. Brouillette, A. Belfkira and B. Chabot, Carbohydr. Polym., 2014, 106, 121–127 CrossRef CAS PubMed.
- Y. Noguchi, I. Homma and T. Watanabe, Cellulose, 2020, 27, 2029–2040 CrossRef CAS.
- F. Rol, C. Sillard, M. Bardet, J. R. Yarava, L. Emsley, C. Gablin, D. Léonard, N. Belgacem and J. Bras, Carbohydr. Polym., 2020, 229, 115294 CrossRef CAS.
- S. Zhang, H. Chen, Y. Zhang, Y. Zhang, W. Kan and M. Pan, Polymers, 2020, 12, 336 CrossRef CAS.
- N. Li, J. Ming, R. Yuan, S. Fan, L. Liu, F. Li, X. Wang, J. Yu and D. Wu, ACS Sustainable Chem. Eng., 2020, 8, 290–301 CrossRef CAS.
- K. Al Hokayem, R. El Hage, L. Svecova, B. Otazaghine, N. Le Moigne and R. Sonnier, Molecules, 2020, 25, 1629 CrossRef CAS PubMed.
- F. Rol, N. Belgacem, V. Meyer, M. Petit-Conil and J. Bras, Cellulose, 2019, 26, 5635–5651 CrossRef CAS.
- X. Luo, J. Yuan, Y. Liu, C. Liu, X. Zhu, X. Dai, Z. Ma and F. Wang, ACS Sustainable Chem. Eng., 2017, 5, 5108–5117 CrossRef CAS.
- P. Liu, P. F. Borrell, M. Božič, V. Kokol, K. Oksman and A. P. Mathew, J. Hazard. Mater., 2015, 294, 177–185 CrossRef CAS PubMed.
- F. Carosio, M. Ghanadpour, J. Alongi and L. Wågberg, Carbohydr. Polym., 2018, 202, 479–487 CrossRef CAS PubMed.
- F. Rol, M. N. Belgacem, A. Gandini and J. Bras, Prog. Polym. Sci., 2019, 88, 241–264 CrossRef CAS.
- Y. Shi, D. Belosinschi, F. Brouillette, A. Belfkira and B. Chabot, BioResources, 2015, 4375–4390 CAS.
- J. D. Reid and L. W. Mazzeno, Ind. Eng. Chem., 1949, 41, 2828–2831 CrossRef CAS.
- N. Illy, M. Fache, R. Ménard, C. Negrell, S. Caillol and G. David, Polym. Chem., 2015, 6, 6257–6291 RSC.
- G. Nourry, D. Belosinschi, M. P. Boutin, F. Brouillette and R. Zerrouki, Cellulose, 2016, 23, 3511–3520 CrossRef CAS.
- R. K. Jain, K. Lal and H. L. Bhatnagar, J. Appl. Polym. Sci., 1985, 30, 897–914 CrossRef CAS.
- P. L. Granja, L. Pouységu, D. Deffieux, G. Daudé, B. De Jéso, C. Labrugère, C. Baquey and M. A. Barbosa, J. Appl. Polym. Sci., 2001, 82, 3354–3365 CrossRef CAS.
- M. Nguyen, M. Al-Abdul-Wahid, K. Fontenot, E. Graves, S. Chang, B. Condon, C. Grimm and G. Lorigan, Molecules, 2015, 20, 11236–11256 CrossRef CAS.
- F. Niu, N. Wu, J. Yu and X. Ma, Carbohydr. Polym., 2020, 242, 116422 CrossRef CAS.
- H. El Omari, E. Ablouh, F. Brouillette, M. Taourirte and A. Belfkira, Cellulose, 2019, 26, 9295–9309 CrossRef CAS.
- T. Petreus, B. A. Stoica, O. Petreus, A. Goriuc, C.-E. Cotrutz, I.-V. Antoniac and L. Barbu-Tudoran, J. Mater. Sci.: Mater. Med., 2014, 25, 1115–1127 CrossRef CAS PubMed.
- M. Božič, P. Liu, A. P. Mathew and V. Kokol, Cellulose, 2014, 21, 2713–2726 CrossRef.
- W. D. Wanrosli, R. Rohaizu and A. Ghazali, Carbohydr. Polym., 2011, 84, 262–267 CrossRef CAS.
- D. Aoki and Y. Nishio, Cellulose, 2010, 17, 963–976 CrossRef CAS.
- M. R. Mucalo, K. Kato and Y. Yokogawa, Colloids Surf., B, 2009, 71, 52–58 CrossRef CAS PubMed.
- N. K. Yurkshtovich, T. L. Yurkshtovich, F. N. Kaputskii, N. V. Golub and R. I. Kosterova, Fibre Chem., 2007, 39, 31–36 CrossRef CAS.
- V. Kokol, M. Božič, R. Vogrinčič and A. P. Mathew, Carbohydr. Polym., 2015, 125, 301–313 CrossRef CAS PubMed.
- M. Ghanadpour, B. Wicklein, F. Carosio and L. Wågberg, Nanoscale, 2018, 10, 4085–4095 RSC.
- B. J. Cade-Menun, Talanta, 2005, 66, 359–371 CrossRef CAS PubMed.
- J. Lehtonen, J. Hassinen, A. A. Kumar, L.-S. Johansson, R. Mäenpää, N. Pahimanolis, T. Pradeep, O. Ikkala and O. J. Rojas, Cellulose, 2020, 27, 10719–10732 CrossRef.
- M. C. Popescu, C. Ungureanu, E. Buse, F. Nastase, V. Tucureanu, M. Suchea, S. Draga and M. A. Popescu, Appl. Surf. Sci., 2019, 481, 1287–1298 CrossRef CAS.
- O. Petreu, T. Bubulac, I. Petreu and G. Cazacu, J. Appl. Polym. Sci., 2003, 90, 327–333 CrossRef.
- A. Naderi, T. Lindström, G. Flodberg, J. Sundström, K. Junel, A. Runebjörk, C. F. Weise and J. Erlandsson, Nord. Pulp Pap. Res. J., 2016, 31, 20–29 CrossRef CAS.
- Y. Noguchi, I. Homma and Y. Matsubara, Cellulose, 2017, 24, 1295–1305 CrossRef CAS.
- A. A. Kadam, S. Lone, S. Shinde, J. Yang, R. G. Saratale, G. D. Saratale, J.-S. Sung, D. Y. Kim and G. Ghodake, ACS Sustainable Chem. Eng., 2019, 7, 5764–5775 CrossRef CAS.
- F. Xu, L. Zhong, C. Zhang, P. Wang, F. Zhang and G. Zhang, ACS Sustainable Chem. Eng., 2019, 7, 13999–14008 CrossRef CAS.
- I. van der Veen and J. de Boer, Chemosphere, 2012, 88, 1119–1153 CrossRef CAS PubMed.
- B. Boinon, A. Belfkira, M. Camps and J.-P. Monthéard, Makromol. Chem. Rapid Commun., 1984, 5, 477–482 CrossRef CAS.
- D. K. Shen and S. Gu, Bioresour. Technol., 2009, 100, 6496–6504 CrossRef CAS PubMed.
- X. Zhang, W. Yang and C. Dong, J. Anal. Appl. Pyrolysis, 2013, 104, 19–27 CrossRef CAS.
- C. E. Higgins and W. H. Baldwin, Anal. Chem., 1955, 27, 1780–1783 CrossRef CAS.
Footnote |
| † Electronic supplementary information (ESI) available. See DOI: 10.1039/d1ra02713a |
| This journal is © The Royal Society of Chemistry 2021 |

