 Open Access Article
High-pressure phase transition of AB3-type compounds: case of tellurium trioxide†
Dominik Kurzydłowski *a,
Mikhail A. Kuzovnikovb and
Marek Tkaczc
aFaculty of Mathematics and Natural Sciences, Cardinal Stefan Wyszyński University, Warsaw 01-038, Poland. E-mail: d.kurzydlowski@uksw.edu.pl
bInstitute of Solid State Physics RAS, 142432 Chernogolovka, Moscow District, Russian Federation
cInstitute of Physical Chemistry, Polish Academy of Sciences, Warsaw 01-224, Poland
First published on 16th April 2021
Abstract
Tellurium trioxide, TeO3, is the only example of a trioxide adopting at ambient conditions the VF3-type structure (a distorted variant of the cubic ReO3 structure). Here we present a combined experimental (Raman scattering) and theoretical (DFT modelling) study on the influence of high pressure (exceeding 100 GPa) on the phase stability of this compound. In experiments the ambient-pressure VF3-type structure (R![[3 with combining macron]](https://www.rsc.org/images/entities/char_0033_0304.gif) c symmetry) is preserved up to 110 GPa. In contrast, calculations indicate that above 66 GPa the R
c symmetry) is preserved up to 110 GPa. In contrast, calculations indicate that above 66 GPa the R![[3 with combining macron]](https://www.rsc.org/images/entities/char_0033_0304.gif) c structure should transform to a YF3-type polymorph (Pnma symmetry) with the coordination number of Te6+ increasing from 6 to 8 upon the transition. The lack of this transition in the room-temperature experiment is most probably connected with energetic barriers, in analogy to what is found for compressed WO3. The YF3-type phase is predicted to be stable up to 220 GPa when it should transform to a novel structure of R
c structure should transform to a YF3-type polymorph (Pnma symmetry) with the coordination number of Te6+ increasing from 6 to 8 upon the transition. The lack of this transition in the room-temperature experiment is most probably connected with energetic barriers, in analogy to what is found for compressed WO3. The YF3-type phase is predicted to be stable up to 220 GPa when it should transform to a novel structure of R![[3 with combining macron]](https://www.rsc.org/images/entities/char_0033_0304.gif) symmetry and Z = 18. We analyse the influence of pressure on the band gap of TeO3, and discuss the present findings in the context of structural transformations of trioxides and trifluorides adopting an extended structure in the solid state.
symmetry and Z = 18. We analyse the influence of pressure on the band gap of TeO3, and discuss the present findings in the context of structural transformations of trioxides and trifluorides adopting an extended structure in the solid state.
Introduction
Tellurium, one of the heaviest metalloids, has recently attracted significant attention due to its role in manufacturing highly efficient photovoltaic panels,1,2 and investigations of superconductivity in iron-based compounds.3 In these systems tellurium is found as an anion (Te2−), but materials containing this element as a cation are also of great interest, as exemplified by the acousto-optic and nonlinear optoelectronic properties of tellurium dioxide (TeO2).4,5Apart from TeO2, four other oxides of tellurium are known in the solid state: tellurium trioxide (TeO3) and two mixed-valent compounds containing both Te4+ and Te6+ ions (Te4O9 and Te2O5).6,7 The phase transitions of TeO2 induced by pressures exceeding 1 GPa (=10 kbar) were studied intensively both experimentally,8–13 and by Density Functional Theory (DFT) modelling.13–16 Compression induces a substantial volume reduction in TeO2 (by about 36% up to 70 GPa), and an increase in the coordination number (CN) of Te4+ from 4 to 9.12
In contrast, the high-pressure phase transitions of TeO3, which contains the much smaller Te6+ cation, were not studied up to date. One of the probable reasons for such lack of research is connected with the poor availability of the starting material. Tellurium trioxide cannot be prepared by direct oxidation of Te or TeO2, but requires performing the thermal decomposition of orthotelluric acid, Te(OH)6. Moreover, there is some variation in the published recipes for the synthesis.17–21
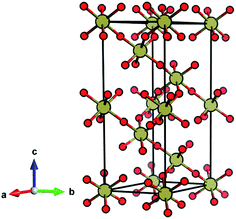
TeO3 is reported to exhibit four different phases: three of them are crystalline (marked I, II, III following the notation introduced in ref. 21) and one is amorphous (IV). Full structural information is available only for phase I (often referred to as β-TeO3), which adopts a VF3-type structure (Fig. 1) exhibiting a coordination number (CN) of Te6+ equal to 6.18,20,21 Phase II is reported to adopt a hexagonal unit cell, while for phase III only information on unindexed powder X-ray diffraction lines is available.21
The ambient-pressure VF3-type structure (R![[3 with combining macron]](https://www.rsc.org/images/entities/char_0033_0304.gif) c symmetry, Z = 6)20,21 is composed of corner-sharing TeO6 octahedra with all six Te–O contacts equal in length. This geometry can be viewed as a perovskite-type ABX3 structure with vacant A-sites and tilting of the BX6 octahedra. The VF3 polytype can be derived from the non-tilted ReO3 structure (Pm
c symmetry, Z = 6)20,21 is composed of corner-sharing TeO6 octahedra with all six Te–O contacts equal in length. This geometry can be viewed as a perovskite-type ABX3 structure with vacant A-sites and tilting of the BX6 octahedra. The VF3 polytype can be derived from the non-tilted ReO3 structure (Pm![[3 with combining macron]](https://www.rsc.org/images/entities/char_0033_0304.gif) m, Z = 1)22 by enforcing tilting of the octahedra (a−a−a− type tilting in Glazer's notation).23
m, Z = 1)22 by enforcing tilting of the octahedra (a−a−a− type tilting in Glazer's notation).23
It's noteworthy to point out that phase I of TeO3 is the only example of a trioxide adopting the VF3-type structure. This polytype is more commonly encountered in trifluorides. In this context, it is of interest to explore the high-pressure phase transformations of TeO3, and compare them with those of trifluorides,24–26 and trioxides, in particular, WO3,27–31 and ReO3 itself.32–35
Here we present a combined experimental (Raman scattering) and theoretical (DFT modelling) study on the influence of high pressure on the structure stability of TeO3. Our experimental results indicate that the ambient-pressure VF3-type structure (R![[3 with combining macron]](https://www.rsc.org/images/entities/char_0033_0304.gif) c symmetry) is preserved up to 110 GPa. In contrast, calculations indicate that above 66 GPa the R
c symmetry) is preserved up to 110 GPa. In contrast, calculations indicate that above 66 GPa the R![[3 with combining macron]](https://www.rsc.org/images/entities/char_0033_0304.gif) c structure should transform to a YF3-type polymorph (Pnma symmetry) with a subsequent increase in the CN of Te6+ from 6 to 8. This transition is not observed in an experiment most probably due to large energetic barriers, in analogy to what is found for compressed WO3. Another transition from the Pnma structure to a rhombohedral phase (R
c structure should transform to a YF3-type polymorph (Pnma symmetry) with a subsequent increase in the CN of Te6+ from 6 to 8. This transition is not observed in an experiment most probably due to large energetic barriers, in analogy to what is found for compressed WO3. Another transition from the Pnma structure to a rhombohedral phase (R![[3 with combining macron]](https://www.rsc.org/images/entities/char_0033_0304.gif) , Z = 18) with a 10-fold coordination of Te6+ is predicted at 220 GPa. We analyse the influence of pressure on the band gap of TeO3 and discuss the present findings in the context of structural transformations of trioxides and trifluorides adopting an extended structure in the solid state (in contrast to SbF3,36 or AsF3,37 which form molecular crystals).
, Z = 18) with a 10-fold coordination of Te6+ is predicted at 220 GPa. We analyse the influence of pressure on the band gap of TeO3 and discuss the present findings in the context of structural transformations of trioxides and trifluorides adopting an extended structure in the solid state (in contrast to SbF3,36 or AsF3,37 which form molecular crystals).
Experimental and computational details
Sample preparation
TeO3 was prepared by heating Te(OH)6, purchased from Aldrich, in a thick glass ampoule at a 350–450 °C temperature range. The best material was obtained by reaction conducted at 450 °C for 20 hours. The purity of the sample was verified by powder X-ray diffraction and Raman spectroscopy (see Fig. S1 in the ESI†).High-pressure experiments
Three high-pressure runs were conducted with the use of a diamond anvil cell (DAC) equipped with diamonds with a bevelled 300 μm tip (bevel angle of 8°). The sample was enclosed by a stainless-steel gasket pre-indented to a thickness of ca. 30 μm. The gasket hole with a radius of 120 μm was laser-drilled. No pressure-transmitting medium was used. The pressure was determined with the use of the ruby fluorescence scale as proposed by Dewaele et al.,38 as well as the shift of the first-order Raman spectra of the diamond anvil as given by Akahama and Kawamura.39Raman spectroscopy
The spectra in the first two runs were collected in backscattered geometry using custom designed setup for micro-Raman measurements based on Jobin Yvon THR1000 monochromator equipped with a single grating (with 1200 grooves mm−1) giving a resolution of ∼1 cm−1, notch filters (Keiser Optical Systems) and thermoelectrically cooled (−65 °C) CCD (Horiba Synapse) detection. A He–Ne laser (Melles-Griot) red line (632.8 nm) was used for sample excitation.The spectra in the third run were acquired with the Alpha300M+ confocal microscope (Witec Gmbh) equipped with a motorized stage. We used a 532 nm laser line delivered to the microscope through a single-mode optical fiber. The laser power at the sample did not exceed 20 mW. The backscattered Raman signal was collected through a 20× long working distance objective, and passed through a multi-mode optical fiber (50 μm core diameter) to a lens based spectrometer (Witec UHTS 300, f/4 aperture, focal length 300 mm) coupled with a back-illuminated Andor iDUS 401 detector thermoelectrically cooled to −60 °C. The spectra were collected in the range of Raman shifts from 70 to 1720 cm−1 with the use of an 1800 mm grating resulting in a 1.2 cm−1 spectral resolution. The acquisition time was 1 s with 30 accumulations. The spectra were post-processed (background subtraction and cosmic-ray removal) with the Project FIVE software (Witec Gmbh). The position of Raman bands was established with the Fityk 1.3.1 software by fitting the observed bands with Pseudo-Voigt profiles.40 During the experiment we did not observe any Raman bands that could be assigned to the O2 vibron,41 which excludes decomposition of TeO3 into O2 and lower-valence tellurium oxides.
DFT calculations
Periodic DFT calculations of the geometry and enthalpy of various polymorphs of TeO3 utilized the SCAN meta-GGA functional.42 This functional was found to offer an accurate description of the high-pressure properties for a wide range of compounds.43–47 We found that it reproduces very well the geometry and the vibration frequencies of the ambient pressure structure of TeO3 (see Table S1†), and yields a similar pressure of the VF3-type TeO3 → YF3-type TeO3 phase transition to the more computational demanding hybrid HSE06 functional (Table S2†).48 Thermodynamic stability of various TeO3 polymorphs was judged by comparing their enthalpy (H), and thus the calculations formally correspond to T = 0 K at which the Gibbs free energy (G = H − ST, where S is the entropy) is equal to H.The projector-augmented-wave (PAW) method was used in the calculations,49 as implemented in the VASP 5.4 code.50,51 The cut-off energy of the plane waves was set to 800 eV with a self-consistent-field convergence criterion of 10−8 eV. Valence electrons (Te: 5s2, 5p4; O: 2s2, 2p4) were treated explicitly, while standard VASP pseudopotentials were used for the description of core electrons. We verified that using an extended basis set for Te, with the 3d, 4s, and 4p electrons included explicitly, did not alter the obtained results. The k-point mesh spacing was set to 2π × 0.03 Å−1. All structures were optimized until the forces acting on the atoms were smaller than 1 meV Å−1. Calculations of vibration frequencies (also using SCAN) were conducted with the finite-displacement method with 0.007 Å displacement. We did not apply any scaling of the theoretical vibration frequencies when comparing them with experimental values.
At selected pressures, we additionally calculated the intensity of Γ-point Raman-active vibrational modes using density-functional perturbation theory (DFPT),52 as implemented in the CASTEP code (academic release version 19.11).53 Due to the large computational cost of these calculations we employed the Local Density Approximation (LDA). This approach was previously successfully used to model the Raman spectrum of Te(II) and Te(III) oxides,54,55 as well as the pressure-induced changes in the Raman spectrum of inorganic fluorides.46,47 In our calculations we employed norm-conserving pseudopotentials and a cut-off energy of 1020 eV. The Raman activity of each vibrational mode (Si) was converted into the intensity (Ii) assuming the following relation:
We performed evolutionary algorithm searches for lowest-enthalpy structures of TeO3. For this, we used the XtalOpt software (version r12)56 coupled with periodic DFT calculations utilizing the Perdew–Burke–Ernzerhof (PBE) functional.57 These searches were conducted at 50, 60,![[thin space (1/6-em)]](https://www.rsc.org/images/entities/char_2009.gif) 100, 150, and 200 GPa for Z up to 6 (an additional search at 60 GPa with Z = 12 was also conducted) yielding nearly 5000 crystal structures.
100, 150, and 200 GPa for Z up to 6 (an additional search at 60 GPa with Z = 12 was also conducted) yielding nearly 5000 crystal structures.
Visualization of all structures was performed with the VESTA software package.58 For symmetry recognition we used the FINDSYM program.59 Group theory analysis of the vibrational modes was performed with the use of the Bilbao Crystallographic Server.60
Results and discussion
High-pressure Raman scattering
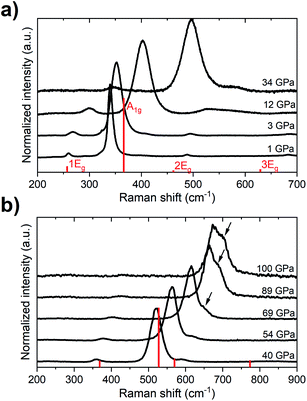
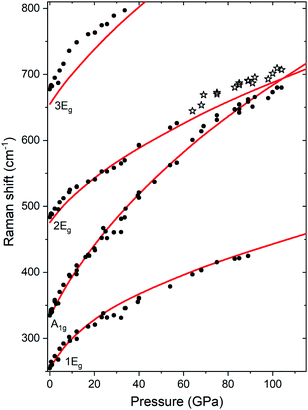
Previous studies showed that at ambient pressure all of the four Raman-active vibrational modes of the R![[3 with combining macron]](https://www.rsc.org/images/entities/char_0033_0304.gif) c structure (A1g + 3 × Eg) can be detected, with the A1g mode having a considerable higher intensity than the Eg modes.19,54,55 In our diamond anvil cell (DAC) high-pressure experiments we could follow the frequency change of all of these modes up 35 GPa (Fig. 2). Above that pressure, the highest-frequency Eg mode (3Eg) could not be detected due to an increase in the background fluorescence. The lowest-frequency Eg mode (1Eg) could be followed up to 90 GPa, while the medium-frequency Eg mode (2Eg) is shadowed by the A1g band at approximately the same pressure.
c structure (A1g + 3 × Eg) can be detected, with the A1g mode having a considerable higher intensity than the Eg modes.19,54,55 In our diamond anvil cell (DAC) high-pressure experiments we could follow the frequency change of all of these modes up 35 GPa (Fig. 2). Above that pressure, the highest-frequency Eg mode (3Eg) could not be detected due to an increase in the background fluorescence. The lowest-frequency Eg mode (1Eg) could be followed up to 90 GPa, while the medium-frequency Eg mode (2Eg) is shadowed by the A1g band at approximately the same pressure.
Up to the highest pressure reached in this study (110 GPa) the observed shifts in the frequency of the Raman bands are in good accordance with those predicted for the VF3 structure (Fig. 3). However, above 60 GPa we observe a new band developing on the high-frequency side of the A1g mode (Fig. 2b). The emergence of this band is most probably a result of non-hydrostatic conditions inside the DAC which, present even at lower pressures but amplified by compression, lead for a part of the sample to shifting of the frequency of the A1g mode to higher values (see Fig. S2†). The changes in the Raman spectrum were observed in all three experimental runs and at different positions in the DAC. The spectrum after decompression to 1 atm was identical to the initial spectrum.
DFT calculations
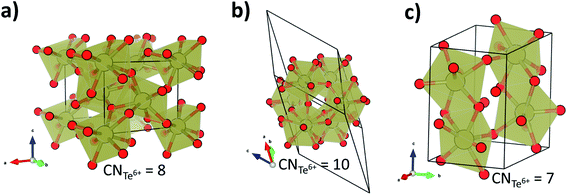
To gain more insight in the pressure-induced phase transitions of TeO3, we have conducted evolutionary algorithm searches for the most stable high-pressure polymorphs of this compound (for details see the Methods section). These searches identified two low-enthalpy structures (Fig. 4a and b): one with Pnma symmetry (Z = 4), the other with R![[3 with combining macron]](https://www.rsc.org/images/entities/char_0033_0304.gif) symmetry (Z = 18). The first of these polymorphs is isostructural to YF3 and exhibits 8-fold coordination of Te6+ by O2− in the form of a distorted square antiprism. Searches in the Inorganic Crystal Structure Database (FIZ Karlsruhe)61 indicate that the R
symmetry (Z = 18). The first of these polymorphs is isostructural to YF3 and exhibits 8-fold coordination of Te6+ by O2− in the form of a distorted square antiprism. Searches in the Inorganic Crystal Structure Database (FIZ Karlsruhe)61 indicate that the R![[3 with combining macron]](https://www.rsc.org/images/entities/char_0033_0304.gif) structure, exhibiting 10-fold coordination of Te6+, has not been previously reported for any AB3-type compound.
structure, exhibiting 10-fold coordination of Te6+, has not been previously reported for any AB3-type compound.
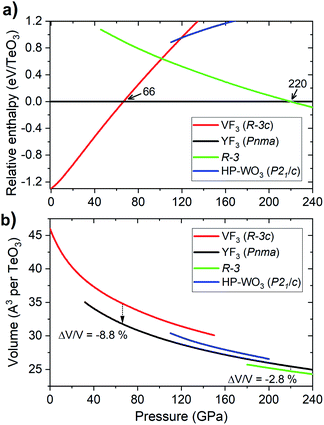
Analysis of the pressure dependence of the relative enthalpy of various TeO3 polymorphs is given in Fig. 5a. Calculations indicate that the VF3-type structure is the most stable one at ambient conditions (≈0 GPa) – in accordance with experiment. Upon compression, a first order transition from this structure into the YF3-type polymorph (Pnma symmetry) is predicted at 66 GPa. However, the spectral changes observed in the experiment cannot be assigned to this transition, as the predicted Raman spectrum of the Pnma structure is very different from the experimental one (Fig. S3†). Calculation indicate one more phase transition at 220 GPa from the YF3-type structure to a polymorph of R![[3 with combining macron]](https://www.rsc.org/images/entities/char_0033_0304.gif) symmetry. This process leads to an increase in CN from 8 to 10 and a volume reduction of nearly 3% (Fig. 5b).
symmetry. This process leads to an increase in CN from 8 to 10 and a volume reduction of nearly 3% (Fig. 5b).
The lack of the transition between VF3- and YF3-type structures in our room-temperature experiment is most probably due to significant kinetic barriers accompanying this process. These are a result of large changes in the Te coordination environment and molar volume (Fig. 5b). This notion is supported by the fact that the VF3 polymorph is dynamically stable at 66 GPa (vide infra). The lack of the VF3 → YF3 phase transition in TeO3 resembles the situation found for MgF2 and SnO2 where large energy barriers hinder the thermodynamically favoured phase transition from the TiO2-type structure to an α-PbO2 polymorph.62,63 To overcome these barriers laser heating of the sample would be required, in analogy to high-pressure experiments conducted for TeO2.12 However our current experimental setup does not allow us to perform laser heating of samples enclosed in a diamond anvil cell. Moreover leaser heating could lead to thermal decomposition of TeO3 (at ambient conditions this compound decomposes above 400 °C).21
The fact that the VF3 structure of TeO3 is metastable up to 110 GPa is further supported by phonon dispersion calculations. In the 0 to 141 GPa pressure range the R![[3 with combining macron]](https://www.rsc.org/images/entities/char_0033_0304.gif) c polymorph does not exhibit any vibrations with imaginary frequencies. However, upon compression, a softening of one phonon branch is observed at the F-point of the Brillouin zone, (1/2, 1/2, 0) vector, which leads to the appearance of imaginary modes at this point above 141 GPa. This behaviour was also observed at high pressure for the VF3 structure of FeF3.25
c polymorph does not exhibit any vibrations with imaginary frequencies. However, upon compression, a softening of one phonon branch is observed at the F-point of the Brillouin zone, (1/2, 1/2, 0) vector, which leads to the appearance of imaginary modes at this point above 141 GPa. This behaviour was also observed at high pressure for the VF3 structure of FeF3.25
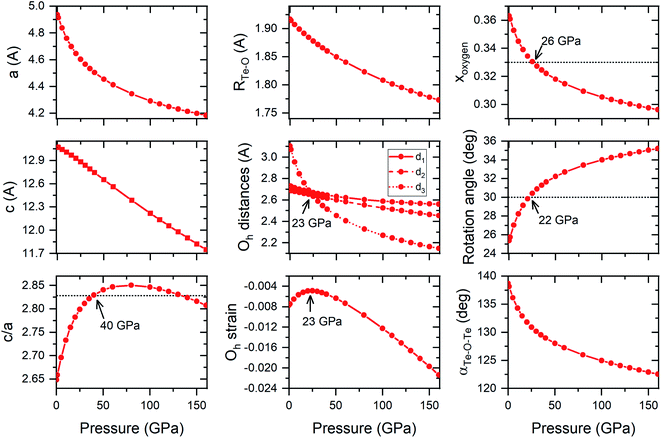
Both FeF3 and TeO3 exhibit a similar pressure dependence of structural parameters (although in different pressure ranges). For both compounds pressure initially induces a change in the structural parameters towards an ideal hexagonally close-packing (hcp) packing of O2− anions.24,25 For example, the c/a ratio increases upon compression up to a point where it exceeds that predicted for a perfect hcp packing (Fig. 6). After reaching a maximum (found at 20 GPa for FeF3, and 80 GPa for TeO3 – see Fig. 6) this ratio decreases upon compression. Interestingly in both FeF3 and TeO3 the F-point phonon instability appears at the point when this ratio becomes again smaller than the value predicted for a perfect hcp packing.
Distorting the R![[3 with combining macron]](https://www.rsc.org/images/entities/char_0033_0304.gif) c structure along the eigenvector of the imaginary mode, and subsequent geometry optimization, leads to a structure with four TeO3 units per unit cell and P21/c symmetry (this space group is the highest-symmetry sub-group of R
c structure along the eigenvector of the imaginary mode, and subsequent geometry optimization, leads to a structure with four TeO3 units per unit cell and P21/c symmetry (this space group is the highest-symmetry sub-group of R![[3 with combining macron]](https://www.rsc.org/images/entities/char_0033_0304.gif) c along the (1/2, 1/2, 0) modulation vector). This structure, shown in Fig. 4c, is a distorted variant of the high-pressure phase of WO3 (HP-WO3),28 and exhibits 7-fold coordination of Te6+ (increasing to 8-fold upon compression). The R
c along the (1/2, 1/2, 0) modulation vector). This structure, shown in Fig. 4c, is a distorted variant of the high-pressure phase of WO3 (HP-WO3),28 and exhibits 7-fold coordination of Te6+ (increasing to 8-fold upon compression). The R![[3 with combining macron]](https://www.rsc.org/images/entities/char_0033_0304.gif) c → P21/c transition is of first order (ΔV/V = −5.8% at 141 GPa). However, given the fact that it is connected with a phonon instability, it might be characterized by a small energetic barrier. It, therefore, could be observed during room-temperature compression.
c → P21/c transition is of first order (ΔV/V = −5.8% at 141 GPa). However, given the fact that it is connected with a phonon instability, it might be characterized by a small energetic barrier. It, therefore, could be observed during room-temperature compression.
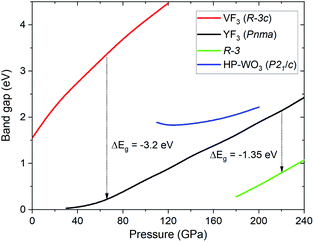
SCAN calculation of the pressure dependence of the electronic band gap (Eg) for the high-pressure structures of TeO3 is shown in Fig. 7. The Eg value obtained at ambient conditions for the VF3 structure (1.55 eV) is underestimated compared with the experimental value (3.25 eV), but larger than that obtained in calculations utilizing the PBE functional (1.21 eV).64,65 Compression induces an increase of the band gap in all TeO3 polymorphs, especially for the VF3-type structure exhibiting octahedral coordination of Te6+. This trend is similar to what is found for ionic difluorides (MF2, M = Be, Mg, Ca),66 and in contrast to TeO2 where much smaller variations of Eg are seen.15 The band gap is predicted to decrease abruptly upon the R![[3 with combining macron]](https://www.rsc.org/images/entities/char_0033_0304.gif) c → Pnma (p = 60 GPa) and the Pnma → R
c → Pnma (p = 60 GPa) and the Pnma → R![[3 with combining macron]](https://www.rsc.org/images/entities/char_0033_0304.gif) (p = 220 GPa) phase transition.
(p = 220 GPa) phase transition.
Conclusions
High-pressure Raman measurements indicate that the ambient-pressure VF3-type structure (R![[3 with combining macron]](https://www.rsc.org/images/entities/char_0033_0304.gif) c symmetry) persists up to 110 GPa. Calculations confirm the dynamic stability of this polymorph up to a pressure of 141 GPa. At larger compression a phonon instability should lead to a transition into a distorted variant of the high-pressure phase of WO3 (P21/c symmetry) with a subsequent increase of the Te6+ coordination number from 6 to 7. We argue that a similar transition could be observed for FeF3, which exhibits the same type of instability.25 The HP-WO3 phase can also be a candidate for a post-VF3 phase of ReO3.32
c symmetry) persists up to 110 GPa. Calculations confirm the dynamic stability of this polymorph up to a pressure of 141 GPa. At larger compression a phonon instability should lead to a transition into a distorted variant of the high-pressure phase of WO3 (P21/c symmetry) with a subsequent increase of the Te6+ coordination number from 6 to 7. We argue that a similar transition could be observed for FeF3, which exhibits the same type of instability.25 The HP-WO3 phase can also be a candidate for a post-VF3 phase of ReO3.32
Calculations indicate that the persistence of the VF3-type structure above 66 GPa is a kinetic effect as this polymorph, as well as the HP-WO3 structure, are thermodynamically less stable than a YF3-type polymorph (Pnma space group), which exhibits 8-fold coordination of Te6+. The lack of the VF3 → YF3 phase transition in room-temperature compression experiments is most probably a result of the large energetic barriers associated with it. It's noteworthy to mention that a similar situation is found for WO3. For this compound calculations indicate that a YF3 structure is the ground state structure above 20 GPa.31 However, it has not been observed in experiments conducted up to 40 GPa.29
We predict that above 220 GPa TeO3 should enter a post-YF3 phase with R![[3 with combining macron]](https://www.rsc.org/images/entities/char_0033_0304.gif) symmetry (Z = 18) and 10-fold coordination of Te6+. We do not find evidence for a possible transition into the 12-fold coordinated LaF3-type structure (P
symmetry (Z = 18) and 10-fold coordination of Te6+. We do not find evidence for a possible transition into the 12-fold coordinated LaF3-type structure (P![[3 with combining macron]](https://www.rsc.org/images/entities/char_0033_0304.gif) c1) adopted by rare earth trifluorides, nor to the 9-fold coordinated Cmcm phase proposed for WO3.31 Finally, we show that high pressure and compression-induced phase transitions lead to large variations of the electronic band gap of TeO3. The possibility of pressure-tuning of the band structure of TeO3 polymorphs is also of interest in the context of non-linear properties of this material.64
c1) adopted by rare earth trifluorides, nor to the 9-fold coordinated Cmcm phase proposed for WO3.31 Finally, we show that high pressure and compression-induced phase transitions lead to large variations of the electronic band gap of TeO3. The possibility of pressure-tuning of the band structure of TeO3 polymorphs is also of interest in the context of non-linear properties of this material.64
Conflicts of interest
The authors declare no competing financial interest.Acknowledgements
This research was carried out with the support of the Interdisciplinary Centre for Mathematical and Computational Modelling (ICM), University of Warsaw, under grant no. GB84-24.References
- M. Gloeckler, I. Sankin and Z. Zhao, IEEE Journal of Photovoltaics, 2013, 3, 1389–1393 Search PubMed.
- T. A. M. Fiducia, B. G. Mendis, K. Li, C. R. M. Grovenor, A. H. Munshi, K. Barth, W. S. Sampath, L. D. Wright, A. Abbas, J. W. Bowers and J. M. Walls, Nat. Energy, 2019, 4, 504–511 CrossRef CAS.
- K.-W. Yeh, T.-W. Huang, Y. Huang, T.-K. Chen, F.-C. Hsu, P. M. Wu, Y.-C. Lee, Y.-Y. Chu, C.-L. Chen, J.-Y. Luo, D.-C. Yan and M.-K. Wu, Europhys. Lett., 2008, 84, 37002 CrossRef.
- S. J. Madden and K. T. Vu, Opt. Express, 2009, 17, 17645 CrossRef CAS PubMed.
- S. Marzban, J. G. Bartholomew, S. Madden, K. Vu and M. J. Sellars, Phys. Rev. Lett., 2015, 115, 013601 CrossRef PubMed.
- O. Lindqvist and J. Moret, Acta Crystallogr., Sect. B: Struct. Crystallogr. Cryst. Chem., 1973, 29, 643–650 CrossRef CAS.
- O. Lindqvist, W. Mark and J. Moret, Acta Crystallogr., Sect. B: Struct. Crystallogr. Cryst. Chem., 1975, 31, 1255–1259 CrossRef.
- P. S. Peercy, I. J. Fritz and G. A. Samara, J. Phys. Chem. Solids, 1975, 36, 1105–1122 CrossRef CAS.
- D. M. Adams and S. K. Sharma, J. Phys. Chem. Solids, 1978, 39, 515–519 CrossRef CAS.
- L.-G. Liu, J. Phys. Chem. Solids, 1987, 48, 719–722 CrossRef CAS.
- A. Jayaraman and G. A. Kourouklis, Pramana, 1991, 36, 133–141 CrossRef CAS.
- T. Sato, N. Funamori, T. Yagi and N. Miyajima, Phys. Rev. B: Condens. Matter Mater. Phys., 2005, 72, 092101 CrossRef.
- X. Liu, T. Mashimo, N. Kawai, T. Sekine, Z. Zeng and X. Zhou, Mater. Res. Express, 2016, 3, 076206 CrossRef.
- M. Ceriotti, F. Pietrucci and M. Bernasconi, Phys. Rev. B: Condens. Matter Mater. Phys., 2006, 73, 104304 CrossRef.
- G. I. G. Griffiths and R. J. Needs, Phys. Rev. B: Condens. Matter Mater. Phys., 2009, 80, 184115 CrossRef.
- V. L. Deringer, R. P. Stoffel and R. Dronskowski, Cryst. Growth Des., 2014, 14, 871–878 CrossRef CAS.
- J. Loub, Z. Anorg. Allg. Chem., 1968, 362, 98–107 CrossRef CAS.
- D. Dumora, P. Hagenmuller and C. R. Seances, Comptes rendus des seances de l’Academie des sciences. Serie C, 1968, 266, 276 CAS.
- J. Loub, Collect. Czech. Chem. Commun., 1977, 42, 960–966 CrossRef CAS.
- M. Dušek and J. Loub, Powder Diffr., 1988, 3, 175–176 CrossRef.
- M. A. K. Ahmed, H. Fjellvåg and A. Kjekshus, J. Chem. Soc., Dalton Trans., 2000, 4542–4549 RSC.
- H. A. Evans, Y. Wu, R. Seshadri and A. K. Cheetham, Nat. Rev. Mater., 2020, 5, 196–213 CrossRef CAS.
- A. M. Glazer, Acta Crystallogr., Sect. B: Struct. Crystallogr. Cryst. Chem., 1972, 28, 3384–3392 CrossRef CAS.
- J.-E. Jørgensen, J. S. Olsen and L. Gerward, High Pressure Res., 2010, 30, 634–642 CrossRef.
- F. Zhu, X. Lai, X. Wu, Y. Li and S. Qin, Acta Crystallogr., Sect. B: Struct. Sci., Cryst. Eng. Mater., 2014, 70, 801–808 CrossRef CAS PubMed.
- E. Stavrou, J. M. Zaug, S. Bastea, J. C. Crowhurst, A. F. Goncharov, H. B. Radousky, M. R. Armstrong, S. K. Roberts and J. W. Plaue, J. Chem. Phys., 2015, 142, 214506 CrossRef PubMed.
- P. M. Woodward, A. W. Sleight and T. Vogt, J. Phys. Chem. Solids, 1995, 56, 1305–1315 CrossRef CAS.
- Y. Xu, S. Carlson and R. Norrestam, J. Solid State Chem., 1997, 132, 123–130 CrossRef CAS.
- P. Bouvier, W. A. Crichton, M. Boulova and G. Lucazeau, J. Phys.: Condens. Matter, 2002, 14, 301 Search PubMed.
- T. Pagnier and A. Pasturel, J. Phys.: Condens. Matter, 2003, 15, 3121–3133 CrossRef CAS.
- J. Zhang, S. Zhang, Z. Zhao, J. Lin, S. Zheng, Y. Sun and G. Yang, J. Phys.: Condens. Matter, 2020, 32, 085403 CrossRef CAS PubMed.
- J.-E. Jørgensen, J. Staun Olsen and L. Gerward, J. Appl. Crystallogr., 2000, 33, 279–284 CrossRef.
- J.-E. Jørgensen, W. G. Marshall, R. I. Smith, J. S. Olsen and L. Gerward, J. Appl. Crystallogr., 2004, 37, 857–861 CrossRef.
- T. Chatterji and G. J. McIntyre, Solid State Commun., 2006, 139, 12–15 CrossRef CAS.
- D. V. S. Muthu, P. Teredesai, S. Saha, P. Suchitra, U. V. Waghmare, A. K. Sood and C. N. R. Rao, Phys. Rev. B: Condens. Matter Mater. Phys., 2015, 91, 1–8 CrossRef.
- A. J. Edwards, J. Chem. Soc. A, 1970, 2751 RSC.
- J. Galy and R. Enjalbert, J. Solid State Chem., 1982, 44, 1–23 CrossRef CAS.
- A. Dewaele, M. Torrent, P. Loubeyre and M. Mezouar, Phys. Rev. B: Condens. Matter Mater. Phys., 2008, 78, 104102 CrossRef.
- Y. Akahama and H. Kawamura, J. Appl. Phys., 2006, 100, 043516 CrossRef.
- M. Wojdyr, J. Appl. Crystallogr., 2010, 43, 1126–1128 CrossRef CAS.
- Y. Akahama and H. Kawamura, Phys. Rev. B: Condens. Matter Mater. Phys., 1996, 54, R15602–R15605 CrossRef CAS PubMed.
- J. Sun, A. Ruzsinszky and J. P. Perdew, Phys. Rev. Lett., 2015, 115, 036402 CrossRef PubMed.
- Y. Hinuma, H. Hayashi, Y. Kumagai, I. Tanaka and F. Oba, Phys. Rev. B, 2017, 96, 094102 CrossRef.
- C. Shahi, J. Sun and J. P. Perdew, Phys. Rev. B, 2018, 97, 94111 CrossRef CAS.
- D. Kurzydłowski, M. Derzsi, P. Barone, A. Grzelak, V. Struzhkin, J. Lorenzana and W. Grochala, Chem. Commun., 2018, 54, 10252–10255 RSC.
- D. Kurzydłowski, A. Oleksiak, S. B. Pillai and P. K. Jha, Inorg. Chem., 2020, 59, 2584–2593 CrossRef PubMed.
- D. Kurzydłowski, S. Kobyakov, Z. Mazej, S. B. Pillai, B. Chakraborty and P. K. Jha, Chem. Commun., 2020, 56, 4902–4905 RSC.
- A. V. Krukau, O. A. Vydrov, A. F. Izmaylov and G. E. Scuseria, J. Chem. Phys., 2006, 125, 224106 CrossRef PubMed.
- P. E. Blöchl, Phys. Rev. B: Condens. Matter Mater. Phys., 1994, 50, 17953–17979 CrossRef.
- G. Kresse and J. Furthmüller, Phys. Rev. B: Condens. Matter Mater. Phys., 1996, 54, 11169–11186 CrossRef CAS PubMed.
- G. Kresse and D. Joubert, Phys. Rev. B: Condens. Matter Mater. Phys., 1999, 59, 1758–1775 CrossRef CAS.
- K. Refson, P. R. Tulip and S. J. Clark, Phys. Rev. B: Condens. Matter Mater. Phys., 2006, 73, 155114 CrossRef.
- S. J. Clark, M. D. Segall, C. J. Pickard, P. J. Hasnip, M. I. J. Probert, K. Refson and M. C. Payne, Z. Kristallogr.–Cryst. Mater., 2005, 220, 567–570 CrossRef CAS.
- J. Cornette, T. Merle-Méjean, A. Mirgorodsky, M. Colas, M. Smirnov, O. Masson and P. Thomas, J. Raman Spectrosc., 2011, 42, 758–764 CrossRef CAS.
- M. Smirnov, V. Kuznetsov, E. M. Roginskii, J. Cornette, M. Dutreilh-Colas, O. Noguera, O. Masson and P. Thomas, J. Phys.: Condens. Matter, 2018, 30, 475403 CrossRef CAS.
- P. Avery, C. Toher, S. Curtarolo and E. Zurek, Comput. Phys. Commun., 2019, 237, 274–275 CrossRef CAS.
- J. P. Perdew, K. Burke and M. Ernzerhof, Phys. Rev. Lett., 1996, 77, 3865–3868 CrossRef CAS PubMed.
- K. Momma and F. Izumi, J. Appl. Crystallogr., 2011, 44, 1272–1276 CrossRef CAS.
- H. T. Stokes and D. M. Hatch, J. Appl. Crystallogr., 2005, 38, 237–238 CrossRef CAS.
- E. Kroumova, M. I. Aroyo, J. M. Perez-Mato, A. Kirov, C. Capillas, S. Ivantchev and H. Wondratschek, Phase Transitions, 2003, 76, 155–170 CrossRef CAS.
- D. Zagorac, H. Müller, S. Ruehl, J. Zagorac and S. Rehme, J. Appl. Crystallogr., 2019, 52, 918–925 CrossRef CAS.
- J. Haines and J. Léger, Phys. Rev. B: Condens. Matter Mater. Phys., 1997, 55, 11144–11154 CrossRef CAS.
- J. Haines, J. M. Léger, F. Gorelli, D. D. Klug, J. S. Tse and Z. Q. Li, Phys. Rev. B: Condens. Matter Mater. Phys., 2001, 64, 134110 CrossRef.
- E. M. Roginskii, V. G. Kuznetsov, M. B. Smirnov, O. Noguera, J.-R. Duclère, M. Colas, O. Masson and P. Thomas, J. Phys. Chem. C, 2017, 121, 12365–12374 CrossRef CAS.
- E. M. Roginskii, M. B. Smirnov, V. G. Kuznetsov, O. Noguera, J. Cornette, O. Masson and P. Thomas, Mater. Res. Express, 2019, 6, 125903 CrossRef CAS.
- J. R. Nelson, R. J. Needs and C. J. Pickard, Phys. Rev. B, 2017, 95, 054118 CrossRef.
Footnote |
| † Electronic supplementary information (ESI) available: Comparison of the ambient-pressure geometry and the frequencies of the Raman-active vibrational modes between experiment and SCAN calculations; ambient-pressure powder X-ray diffraction pattern of TeO3; comparison of the high-pressure Raman spectrum of TeO3 with that calculated for the YF3-type and VF3-type structures; computed structural parameters of the high-pressure polymorphs of TeO3. See DOI: 10.1039/d1ra02344f |
| This journal is © The Royal Society of Chemistry 2021 |

