 Open Access Article
Preparation of a double-network hydrogel based on wastepaper and its application in the treatment of wastewater containing copper(II) and methylene blue†
Yaoning Chen‡
 *ab,
Linshenzhang Li‡ab,
Yuanping Li‡*c,
Yihuan Liuab,
Yanrong Chenab,
Hui Lid,
Meiling Liab,
Fangting Xuab and
Yuqing Liue
aCollege of Environmental Science and Engineering, Hunan University, Changsha 410082, China. E-mail: cyn@hnu.edu.cn; Tel: +86 731 88821413; Fax: +86 731 88821413
bKey Laboratory of Environmental Biology and Pollution Control (Hunan University), Ministry of Education, Changsha 410082, China
cCollege of Municipal and Mapping Engineering, Hunan City University, Yiyang, Hunan 413000, China. E-mail: yuanpingl@163.net
dState Key Laboratory of Utilization of Woody Oil Resource, Hunan Academy of Forestry, Changsha 410004, P.R. China
eShenzhen Zhongrun Zhihuan Ecological Environment Technology Co., Ltd, Shenzhen 518000, China
First published on 19th May 2021
Abstract
To reclaim and utilize wastepaper (WP), a WP/acrylamide double-network hydrogel (WP/PAM) was prepared to transform WP into efficient adsorbent for heavy metals and dye wastewater treatment. The structure and properties of the WP/PAM were characterized systematically by scanning electron microscopy (SEM), thermogravimetric analysis (TGA), swelling performance (SR), Fourier transform infrared spectrum (FTIR), and X-ray photoelectron spectroscopy (XPS). Batch experiments showed that the adsorption process of Cu(II) and MB followed the pseudo-second-order kinetic model and the Langmuir model. The maximum adsorption capacities of the WP/PAM for Cu(II) and MB were 142.2 mg g−1 and 1714.5 mg g−1, respectively. The adsorption mechanism of Cu(II) on the WP/PAM was related to ion exchange and complexation, while MB adsorption was driven by hydrogen bonding and electrostatic interaction. Besides, the WP/PAM performed well in treating simulated wastewater. The regeneration test indicated that the WP/PAM could be successfully reused after 6 cycles. This work provided an alternative choice for the recycling of WP and produced a potential adsorbent for the dye and heavy metals wastewater treatment.
1. Introduction
In the wake of development in urbanization and industrialization, wastewater with heavy metals or dye from different industrial processes, such as printing, electroplating, and steel manufacturing, has been released into the environment and resulted in increasingly serious water pollution.1–3 Take dye wastewater as an example, about 10–20% of dyes will be directly released into water to form organic dye wastewater in the process of dye production and use.4 Meanwhile, some metallic salts (e.g., Cu(II), Mn(II), Co(II), Ni(II)) are required as ingredients for the synthesis of some metal complexing dyes and mordants in the printing and dyeing processes, which is the reason that printing and dyeing wastewater is usually accompanied by heavy metal ions.5 The heavy metal ions, which cannot be collected or degraded,6 would persist in the water environment, eventually endangering human health.7,8 Among various methods for treating heavy metal and dye wastewater, adsorption is widely used because of its simple operation and high tolerance to toxic chemicals in water.9,10 But the relatively high costs of adsorbents with high-efficiency cause an economic burden to the practical application of adsorption.11 Hence, it is necessary to continuously develop more efficient, stable, low-cost, and environmentally compatible adsorbents.Wastepaper (WP) as the main component of municipal waste had caused considerable environmental problems.12 In the process of developing and utilizing WP, some scholars found the pure WP could be converted into adsorbents to remove pollutants, but the adsorption capacity was unsatisfactory.12,13 Furthermore, polyamides14 and chitosan15 were adopted to combine with WP to improve the performance for the elimination of heavy metal ions. Whereas, the application of these composites was still limited in water pollution remediation due to their relatively low adsorption capacity, long preparation time, and complex preparation methods. To overcome the drawback, WP-based composites with better adsorption ability should be further studied and improved.
Double-network polymer hydrogel with two independent network structures retains the advantage of traditional hydrogels that rich in buried water,16 and superior mechanical properties that cause less prone to collapse than conventional hydrogels.17 It is also easy to prepare, and its monomers are widely available. So far, there are some double-network hydrogels using natural polymer (e.g., cotton cloth,18 rice husk,19 and straw20) as monomers have been prepared. They possess good potential application value in the adsorption material, because of their low cost, simple production, and excellent removal effect for heavy metals. WP is the most common and easily available natural polymer in our daily life. Nevertheless, there are few double-network hydrogels prepared by WP as monomer, not to mention the report about its application in wastewater treatment.
In this study, acrylamide (AM), which has the advantages of rapid gelation through polymerization and cross-linking reaction, was selected as another layer of the network to prepare double-network hydrogel based on the WP cellulose network. It was expected that the WP/acrylamide composite (WP/PAM) could achieve the characteristics of rich active functional groups, three-dimensional porous structure, large exposure of adsorption sites, and high removal rate of heavy metals and dyes in wastewater. The specific objectives were as follows: (1) synthesizing and comparing the WP/PAM with different WP content; (2) evaluating the adsorption performance of the WP/PAM on Cu(II) and MB through batch experiments in the single and binary system; (3) characterizing the properties of the WP/PAM and clarifying the mechanism of the WP/PAM hydrogel adsorption for contaminants removal.
2. Material and methods
2.1 Materials
WP was mainly collected from common white print paper discarded in the laboratory. The WP was first immersed with glacial acetic acid (AR, 99.5%) for 0.5 h to remove impurities on the surface (environmental temperature: >20 °C), until the WP surface was clean and free of impurities. The WP pretreated by glacial acetic acid was took out and cleaned it with pure water for several times until the pH of the cleaning water was neutral. Then, the WP was torn into uniform pieces of about 5 mm × 5 mm after natural drying for 48 h, and put the WP pieces into a self-sealing bag and kept it in an electronic constant temperature moisture-proof box (AD-50S ANDBON, China) for further use. The reagents mainly include urea (AR), sodium hydroxide (NaOH, AR), acrylamide (AM, AR), epichlorohydrin (ECH, AR), potassium persulfate (KPS, AR), tetramethylethylenediamine (TEMED, AR), N,N-methylenebisacrylamide (MBA, AR), etc. All chemical reagents were supplied by Sinopharm Chemical Reagent Co, Ltd. (China). In addition, all the solutions involved in this work were prepared with deionized water (18.25 MΩ cm).2.2 Preparation of WP/PAM
The preparation of cellulose solvent according to Zhang's work:21 NaOH/urea aqueous solution with a mass ratio of 7![[thin space (1/6-em)]](https://www.rsc.org/images/entities/char_2009.gif) :
:![[thin space (1/6-em)]](https://www.rsc.org/images/entities/char_2009.gif) 12 was prepared and pre-cooled at 0 °C for 1 h.
12 was prepared and pre-cooled at 0 °C for 1 h.
The brief preparation process was shown in Fig. S1.† Here were the details: different quantities (1, 2, 3, and 4 g) of pretreated WP were immediately added into the NaOH/urea aqueous solution with stirring strongly for 5 min to result viscous WP solution with mass fraction of 1 wt%, 2 wt%, 3 wt%, and 4 wt%. Afterwards, 6 mL cellulose solution was mixed with 2 mL AM solution (0.014 mol), then 0.0484 g MBA (crosslinking agent for AM), 0.3 mL ECH (crosslinking agent for WP), 0.0272 g KPS (initiator for AM), and 0.1 mL TEMED (catalyst) were added successively. After mixing evenly, the resulting mixture was poured into a glass culture dish immediately and covered with the 9 cm Petri dish cover, then reacted at 60 °C for 2 h to form hydrogel. The thickness of the product was about 1 mm. Finally, the resulting hydrogel was divided into uniform pieces with a knife, washed alternately with deionized water and anhydrous ethanol until the pH was neutral, then kept at 60 °C for 24 h in a vacuum oven to gain the dried WP/PAM. To be clear, WP/PAM prepared from 1 wt% WP solution was defined as the 1 wt% WP/PAM, the same is true for preparation of the 2, 3, and 4 wt% WP/PAM. The prepared WP/PAM were sealed into self-sealing bags and stored in an electronic moisture-proof box (AD-50S ANDBON, China) for further use. The cost analysis was given in ESI (ESI, Text S1).†
In order to obtain the hydrogel based on WP with the best adsorption performance for Cu(II) and MB, the effect of WP content (1, 2, 3, and 4 wt%) on the adsorption behavior was investigated by comparison.
2.3 Characterization of WP/PAM
Put a certain amount of dry hydrogel into deionized water until the swelling equilibrium was reached. Wiped the surface water of the wet hydrogel with filter paper, then weighed it. The swelling ratio (SR) of the WP/PAM was calculated by the following eqn (1):22
 | (1) |
The porosity of the WP/PAM was measured by liquid replacement method.23 First, the dried WP/PAM was weighed, then immersed in ethanol solution for 24 h, and the saturated WP/PAM was weighed again after the removal of the excess ethanol. The porosity (%) of the WP/PAM was calculated by the following eqn (2):
 | (2) |
The morphology was analyzed by scanning electron microscope (SEM, JEOL JEM-2100F, Japan). The thermogravimetric analysis (TGA, TGA5500, USA) was carried out using a thermogravimetric analyzer in a nitrogen atmosphere, with temperatures ranging from room temperature to 600 °C and a heating rate of 10 °C min−1. The isoelectric point of the WP/PAM pH value (pHPZC) was analyzed via ΔpH drift (see in Text S2†).18 The WP/PAM were analyzed before and after Cu(II) and MB adsorption by the Fourier transform infrared spectrum (FTIR, Bruker Vertex 70, Germany) in the wavenumber range of 400 to 4000 cm−1 and an X-ray photoelectron spectroscopy (XPS, ThermoFischer ESCALAB Xi+, USA). The change in performance of the WP/PAM after storage was measured by comparing the removal efficiency of Cu(II) and MB by the WP/PAM after storing 16 months.
2.4 Batch adsorption experiments
Dissolving 3.8020 g Cu(NO3)2·3H2O (AR) in a 1000 mL volumetric flask to obtain the Cu(II) stock solution (1000 mg L−1) and the required Cu(II) concentration through appropriate dilution of the stock solution. MB was directly dissolved in different concentrations of deionized water to prepare MB solution. In this work, the concentration of Cu(II) and MB were measured by an atomic absorbance spectrometer (ASAP 2020 Plus, Micromeritics) and a UV-2550 spectrophotometer (AOE, China) at 664 nm, respectively. The adsorption capacity at equilibrium (Qe, mg g−1) was calculated by the following eqn (3):| Qe = V(C0 − Ce)/m | (3) |
In batch experiments, conical flask containing 50 mL Cu(II) or MB solution oscillated at 170 rpm under the required conditions. The adsorbent dose (0.25–1.5 g L−1), pH (2–6 for Cu(II); 2–9 for MB), contact time (0–180 min), and initial concentration (0–2000 mg L−1 for Cu(II);24 400–2000 mg L−1 for MB) on the adsorption process were investigated. The pH was adjusted by 0.1 M HNO3 and 0.1 M NaOH.
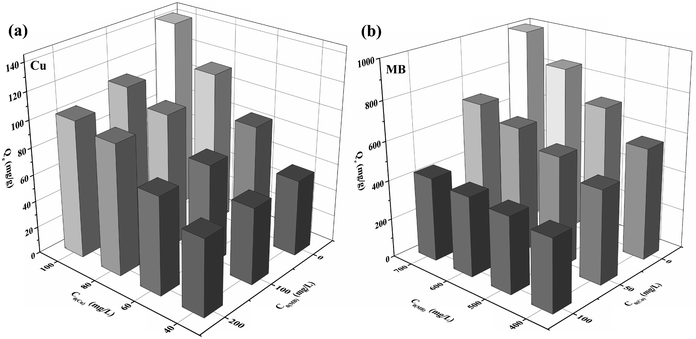
The competition effect between Cu(II) and MB was tested in two systems. In one of the systems, the effect of MB concentration (0–200 mg L−1) on the adsorption capacity of the WP/PAM on Cu(II) was investigated when the concentration of Cu(II) was 40–100 mg L−1. In the other system, the effect of Cu(II) concentration (0–100 mg L−1) on the adsorption capacity of the WP/PAM on MB was investigated when the concentration of MB was 400–700 mg L−1.
The amount of adsorbent used in this work represented the amount of dry hydrogel. The dry hydrogel was weighed quantitatively and put into deionized water for full swelling before adsorption. The thickness of the swollen hydrogel was about 2 mm. All the experiments were performed in triplicate.
2.5 Desorption and regeneration of the WP/PAM
To assess the regeneration of the WP/PAM in Cu(II) and MB adsorption–desorption process, the used WP/PAM were eluted and regenerated with 1.0 M HCl solution and 0.1 M NaOH solution, respectively. Firstly, the WP/PAM after adsorption of Cu(II) and MB was separated from the supernatant by filtration, then 50 mL 1.0 M HCl solution was added and the desorption was completed by shaking at 170 rpm for 3 h. Afterwards, the WP/PAM was placed in 50 mL 0.1 M NaOH solution for 3 h for activation treatment. Finally, the material was washed with deionized water to neutral and left to use. The cyclic adsorption of Cu(II) and MB on the regenerated material was investigated under the original experimental conditions.The desorption efficiency (ηd, eqn (4)) and the cyclic adsorption capacity (ηc, eqn (5)) were calculated by follows:
| ηd (%) = (Qd/Qe) × 100% | (4) |
| ηc (%) = Qe(n)/Qe(n−1) × 100% | (5) |
2.6 Simulated printing and dyeing wastewater treatment
A series of simulated wastewater samples were prepared respectively by the deionized water, the tap water from the laboratory, and the Xiangjiang River water (Fig. S2,† Changsha, Hunan province, China) with the addition of MB and some common metallic salt mordants (CuSO4 (AR), CoCl2 (AR), MnCl2 (AR), and NiCl2 (AR)). Captured by 3 g L−1 WP/PAM, the MB concentration was monitored on a UV-2550 spectrophotometer by full-spectrum detection, and the heavy metals concentrations were analyzed by an inductively coupled plasma-mass spectrometry (ICP-MS7700, Agilent Technologies, USA) after digestion.3. Results and discussion
3.1 Effect of WP content
The adsorption capacities of the WP/PAM prepared with different WP contents on Cu(II) and MB were shown in Fig. S3.† When the WP content increased from 1 wt% to 2 wt%, the Qe value for Cu(II) on the WP/PAM increased from 107.1 mg g−1 to 121.6 mg g−1 and the Qe value for MB increased from 942.9 mg g−1 to 958.4 mg g−1. The increase of WP content brought more hydroxyl groups resulted in the enhancement of the interaction between the WP/PAM and the adsorbate molecules.25 However, as higher WP contents the decreasing on the adsorption was observed, by reason that larger number of WP fiber blocked part of the pore network and limited the molecular diffusion and transfer of pollutants,26 in agreement with what was shown in Fig. S4† and the measured WP/PAM porosity (Table S1†). As shown in Fig. S4(a)–(d),† with the increase of WP content, it was obvious that the cellulose composition in the prepared WP/PAM increased in the prepared WP/PAM. Under the irradiation of SEM (Fig. S4(e)–(h)†), the changes of pores in the WP/PAM was more visually seen. When the WP content increased, the pore size became smaller and the laminated waste paper fiber structure began to appear at a WP content of 3 wt%. It can also be seen from Table S1† that with the increase of WP content, the porosity of the WP/PAM increased at first and then decreased. Among them, the porosity of 2 wt% WP/PAM was the highest (98.1%), which further explained why 2 wt% WP/PAM had the best adsorption performance. Moreover, the p-values (1.51 × 10⁻⁵ for Cu(II) and 0.00508 for MB) < 0.05 also revealed that the WP content in the WP/PAM had a significant difference in the adsorption effect of Cu(II) and MB. Consequently, the 2 wt% WP/PAM was taken as the optimal ratio to carry out the following experiment.3.2 Characterization of 2 wt% WP/PAM
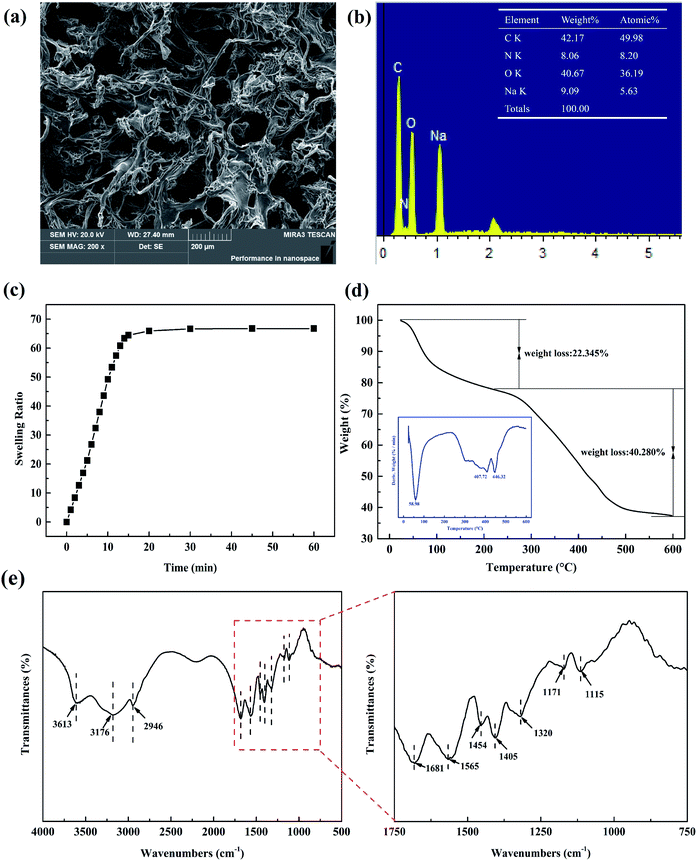
The SEM of 2 wt% WP/PAM was depicted in Fig. 1(a). It was obvious that the freeze-dried WP/PAM presented a 3D porous network structure cross-linked by bundles of paper fibers and PAM. The chemical crosslinking network effectively exposed a large number of active sites, promoting the mass transfer of Cu(II) and MB and enabled the removal of contaminants. The EDS result (Fig. 1(b)) further revealed that the synthetic material contained not only the characteristic elements of WP solution such as C, O, and Na, but also N elements peculiar to PAM, which confirmed the successful composite of WP and AM. The specific surface area and porous ratio of the WP/PAM were given in Table S2† and discussed in ESI (Text S3).†The swelling curve of the WP/PAM was observed in Fig. 1(c). The swelling equilibrium was reached within 30 min and SR was 66.75, which evinced excellent water absorption performance compared with other hydrogels.27,28 The excellent swelling properties of the WP/PAM would account for the loose double-network structure and rich hydrophilic groups such as hydroxyl groups.29 Besides, amine groups on the PAM network were also reported as potential hydrogen bonds, which made hydrogel more likely to absorb abundant water in a short time, could facilitate the contaminants to enter into the hydrogel and be adsorbed.30
Thermal characteristics of the prepared 2 wt% WP/PAM were presented in Fig. 1(d). Based on the TG-DTG curve, the degradation of the WP/PAM could be divided roughly into two main stages. At first, when the temperature was below 200 °C, there was a 22.345% weight loss because of the loss of water in the WP/PAM.31 Then the WP/PAM lost 40.280% weight in the second stage, part of which corresponded to the pyrolysis of oxygen-containing groups (e.g., carboxyl and epoxy groups) and the release of CO2, CO, and steam when the temperature rose from 200 °C to 407.72 °C.27 when the temperature was greater than 407.72 °C, the thermal cracking of cellulose and PAM network structure of the WP/PAM would account for the further weight loss.32 In addition, it could be seen from Fig. 1(d) that the WP/PAM behaved steadily at the temperature required in this experiment (15–35 °C).
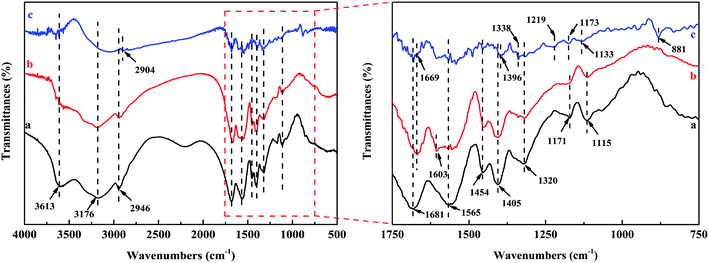
As depicted in Fig. 1(e), there were the characteristic peaks of paper fiber network14,33 and PAM network:24,34 the bands at 3613 and 3176 cm−1 was defined as the stretching vibration of –OH; the C–O–H and C–O–C stretching vibration appeared at 1454 and 1320 cm−1, respectively; the bands at 1171 and 1115 cm−1 related to sugar structure was attributed to C–O stretching vibration. The absorption peaks at 1681, 1565, and 1405 cm−1 were ascribed to the C![[double bond, length as m-dash]](https://www.rsc.org/images/entities/char_e001.gif) O of amide stretching vibration peak, the N–H bending vibration, and the C–N stretching vibration, respectively. For the WP/PAM, all the above characteristic absorption peaks of paper fiber and PAM could be clearly observed, proving that the grafting copolymerization reaction was successful.
O of amide stretching vibration peak, the N–H bending vibration, and the C–N stretching vibration, respectively. For the WP/PAM, all the above characteristic absorption peaks of paper fiber and PAM could be clearly observed, proving that the grafting copolymerization reaction was successful.
XPS analysis about the WP/PAM was discussed in Section 3.4.1 XPS spectra.
In order to verify the performance of the WP/PAM stored in an electronic moisture-proof box, the adsorption capacity of the WP/PAM stored after 16 months on Cu(II) and MB was compared, and the results were shown in Table S3.† As could be seen from Table S3,† the adsorption property of the WP/PAM for Cu(II) and MB still retained more than 98.5% after 16 months of storage.
3.3 Adsorption of Cu(II) and MB by 2 wt% WP/PAM
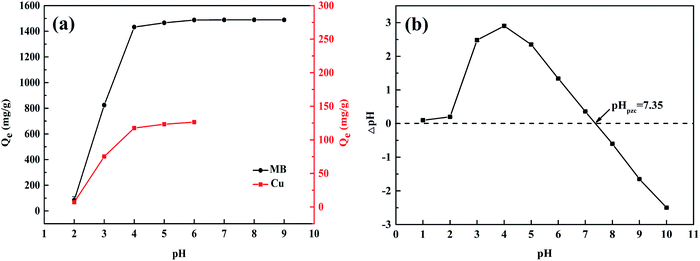
When the solution pH was 2, the removal of Cu(II) and MB by the WP/PAM was not ideal. It might be due to the positive charge on the surface of WP/PAM (Fig. 2(b)), which enhanced the positive charge characteristics of the surface, resulting in the electrostatic repulsion to Cu(II) and cationic dyes (MB) with positive charge.38 Besides, the solution contained abundant H+ could compete with pollutants for adsorption sites, resulting in weak adsorption of pollutants by the WP/PAM at this pH.39 Simultaneously, low pH condition reduced the swelling ability of the WP/PAM, led to less removal of pollutants by the hydrogel.24 When pH increased to 3–6 < pHpzc = 7.35, the surface of the WP/PAM was still positively charged (Fig. 2(b)), but the adsorption efficiency increased rapidly until it reached saturation state. It indicated that electrostatic interaction was not the main adsorption mechanism. As the pH continued to rise, the removal of MB by the WP/PAM would not be affected, and reversely, the precipitation of Cu(II) would affect the adsorption.40 Therefore, the WP/PAM had acceptable removal capacities on Cu(II) and MB under pH 3–6 and pH 3–9, respectively. For convenience, most experiments in this work were performed without adjusting the pH of the pollutant solution.
| Qt = Qe(1 − e−K1t) | (6) |
 | (7) |
| Model | Parameters | Cu(II) | MB |
|---|---|---|---|
| Pseudo-first-order | K1 (min−1) | 0.1103 | 0.0521 |
| Qe cal (mg g−1) | 121.2 | 1437.1 | |
| R2 | 0.9600 | 0.9873 | |
| Pseudo-second-order | K2 (g mg−1 min−1) | 1.217 × 10⁻³ | 3.875 × 10⁻⁵ |
| Qe cal (mg g−1) | 132.2 | 1653.6 | |
| R2 | 0.9944 | 0.9980 |
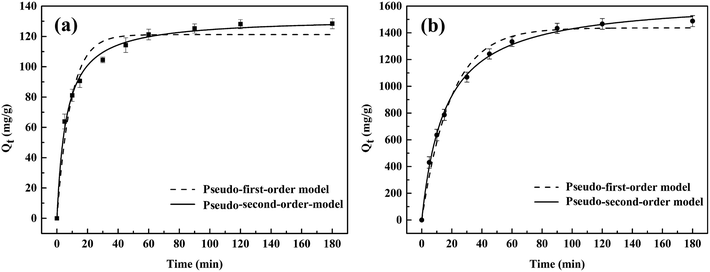
Obviously, the higher R2 value (R2 > 0.99) in the pseudo-second-order model evinced that the adsorption behavior of the WP/PAM on Cu(II) and MB was related to chemical adsorption.42 The K2 < 1 indicated that the reaction between the WP/PAM and Cu(II) and MB were rapid.43 Besides, the Qe values obtained by the pseudo-second-order model were 132.2 mg g−1 for Cu(II) and 1653.6 mg g−1 for MB, respectively, which were near to the experimental values (139.5 mg g−1 for Cu(II) and 1705.5 mg g−1 for MB).
| Model | Parameters | Cu(II) | MB | ||||
|---|---|---|---|---|---|---|---|
| 15 °C | 25 °C | 35 °C | 15 °C | 25 °C | 35 °C | ||
| Langmuir parameters | Qm (mg g−1) | 130.4 | 142.2 | 145.3 | 1677.7 | 1714.5 | 1734.9 |
| KL (L mg−1) | 0.1356 | 0.1767 | 0.4046 | 1.3847 | 0.9662 | 2.0530 | |
| RL2 | 0.9849 | 0.9935 | 0.9949 | 0.9979 | 0.9662 | 0.9708 | |
| Freundlich parameters | KF (mg g−1) | 88.1 | 99.2 | 108.1 | 1533.3 | 1593.4 | 1621.3 |
| n | 17.11 | 18.32 | 21.16 | 72.31 | 79.24 | 78.56 | |
| RF2 | 0.5807 | 0.5816 | 0.5761 | 0.8141 | 0.7617 | 0.9014 | |
| Dubinin–Radushkevich parameters | Qm (mg g−1) | 126.4 | 138.6 | 143.3 | 1672.6 | 1707.4 | 1730.5 |
| E (kJ mol−1) | 20.88 | 24.35 | 25.98 | 10.20 | 8.573 | 15.90 | |
| R2 | 0.9923 | 0.9197 | 0.9649 | 0.9300 | 0.9891 | 0.9064 | |
The Langmuir model:
| Qe = QmKLCe/(1 + KLCe) | (8) |
The Freundlich model:
| Qe = KFCe1/n | (9) |
The D–R model:
ln![[thin space (1/6-em)]](https://www.rsc.org/images/entities/char_2009.gif) Qe = ln Qe = ln![[thin space (1/6-em)]](https://www.rsc.org/images/entities/char_2009.gif) Qm − KDRε2 Qm − KDRε2
| (10) |
| ε = RTln(1 + 1/Ce) | (11) |
 | (12) |
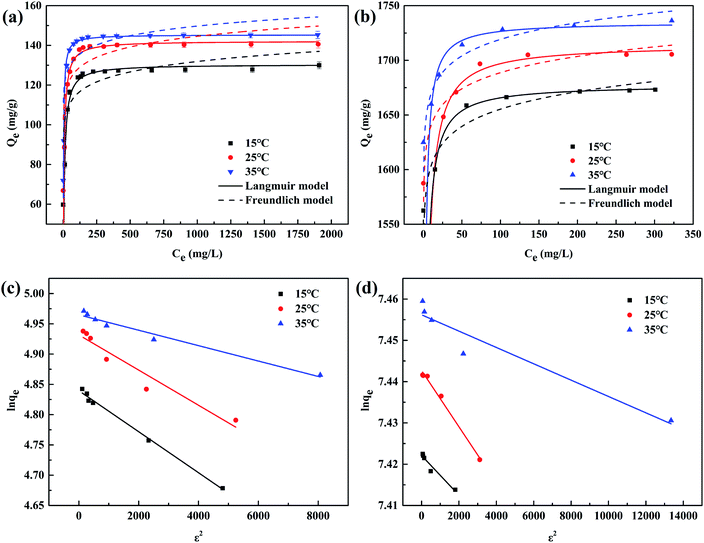
As displayed in the Fig. 4(a) and (b), when C0(Cu(II)) and C0(MB) raised, the Qe increased and moved towards a plateau eventually, illustrating that increasing the C0 of the pollutant was conducive to improving the driving force of the solid–liquid interface (i.e., ion exchange, electrostatic interaction, and chemical association) until the adsorption reached saturation.41 Comparing the R2 under three temperatures, it was noticeable that the systems of the WP/PAM adsorption for Cu(II) and MB followed the Langmuir model. It meant that only monolayer adsorption occurred on the WP/PAM, once a molecule was adsorbed, the adsorption site became unusable.44 What's more, the E value of Cu(II) adsorption process calculated in D–R model was 20.88–25.98 kJ mol−1 beyond the E range of chemical interaction (8–16 kJ mol−1) (Fig. 4(c) and (d)), suggesting that the WP/PAM had physical interaction with Cu(II) in addition to chemical interaction.45
The Qm values obtained by the Langmuir model at 25 °C were 142.2 mg g−1 for Cu(II) and 1714.5 mg g−1 for MB, respectively, which were near to the experimental values (139.5 mg g−1 for Cu(II) and 1705.5 mg g−1 for MB). Furthermore, higher temperature was conducive to the improvement of Qm. It might illustrate that the adsorption of the WP/PAM with Cu(II) and MB were endothermic reaction and the affinity of the WP/PAM for Cu(II) and MB were reinforced at higher temperatures. To revealing excellent adsorption capacity of the WP/PAM more intuitionally, the comparison of the adsorption capacity of the WP/PAM and other cellulose-based hydrogels on Cu(II) and MB was listed in Table 3.
| Cellulose based hydrogel | Solution conditions | Qm (mg g−1) | Ref. | |
|---|---|---|---|---|
| Cu(II) | MB | |||
| Cotton | 25 °C, 6 h | 138.9 | 18 | |
| Microcrystalline cellulose powder | Room temperature, 8 h | 52.3 | 30 | |
| Eucalyptus wood | 30 °C, 4 h | 16.7 | 46 | |
| Carboxymethyl cellulose | 25 °C, 24 h | 357–526 | 35 | |
| Bagasse | 25 °C | 37.2 | 47 | |
| Sugarcane bagasse | 30 °C, pH = 9 | 632.9 | 48 | |
| Pineapple peel | 30 °C | 172.4 | 27 | |
| WP | 25 °C, 3 h | 142.2 | 1714.5 | This study |
3.4 Adsorption mechanism
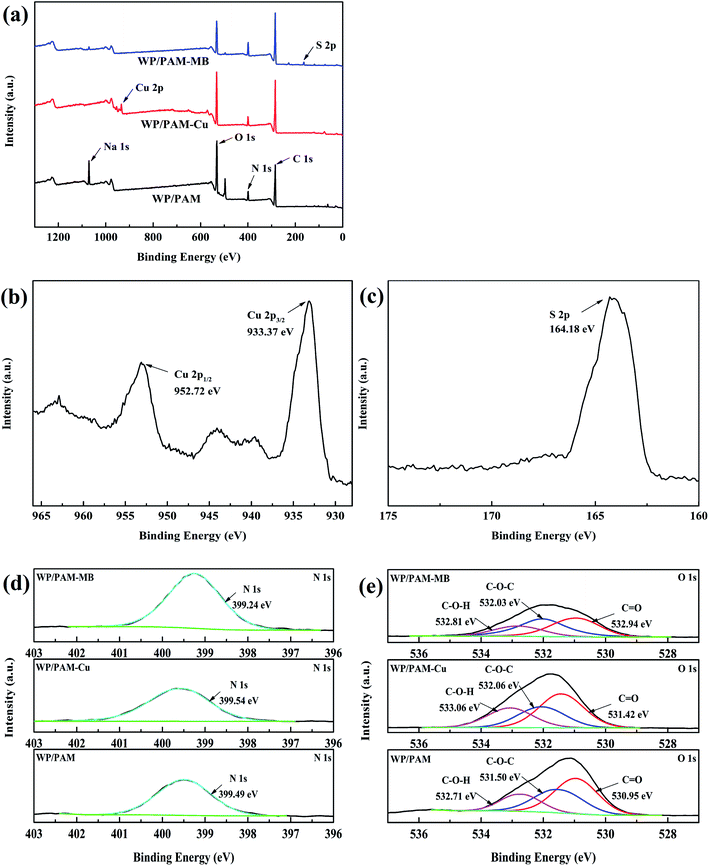 | ||
| Fig. 6 XPS spectra of (a) the WP/PAM before and after Cu(II) and MB adsorption, (b) Cu 2p, (c) S 2p, (d) N 1s and (e) O 1s. | ||
| C | O | N | Na | Cu | S | |
|---|---|---|---|---|---|---|
| WP/PAM | 60.39 | 27.98 | 6.95 | 4.68 | — | — |
| WP/PAM–Cu | 66.65 | 25.05 | 6.57 | — | 1.73 | — |
| WP/PAM–MB | 69.24 | 18.51 | 9.44 | 0.80 | — | 2.01 |
Refer to N 1s (Fig. 6(d)), there was no significant change in the binding energy between the WP/PAM (399.49 eV) and the WP/PAM-Cu (399.54 eV), showed that the nitrogen containing functional group did not participate in the Cu(II) adsorption process.54 This was due to the fact that the lone pair electrons of nitrogen atoms in the amide group were occupied and could not be contributed to adsorbate.19 While the binding energy of the WP/PAM–MB decreased slightly from 399.49 eV to 399.24 eV, indicating that the WP/PAM had electrostatic interaction with N element in MB, increasing the density of the nearby electron cloud.42,50
The O 1s of the WP/PAM (Fig. 6(e)) could fit three peaks with binding energies of 532.71, 531.50, and 530.95 eV, contributed to C–O–H, C–O–C, and C![[double bond, length as m-dash]](https://www.rsc.org/images/entities/char_e001.gif) O, respectively.55,56 After reacted with Cu(II), the binding energy of C–O–H and C
O, respectively.55,56 After reacted with Cu(II), the binding energy of C–O–H and C![[double bond, length as m-dash]](https://www.rsc.org/images/entities/char_e001.gif) O had an increase from 532.71 eV to 533.06 and 530.95 to 531.42 eV, respectively. It was an indication that the density of the electron cloud around the O atom in C–O–H and C
O had an increase from 532.71 eV to 533.06 and 530.95 to 531.42 eV, respectively. It was an indication that the density of the electron cloud around the O atom in C–O–H and C![[double bond, length as m-dash]](https://www.rsc.org/images/entities/char_e001.gif) O reduced. The phenomenon enabled Cu(II) and oxygen-containing functional groups to form Cu–O through complexation reaction.43 As for the WP/PAM–MB, the C–O–H peak originally located at 532.71 eV had moved to a higher binding energy (532.81 eV), demonstrating that C–O–H was involved in the MB adsorption, which was in accordance with the results reported previously.57 Combined with the analysis of N 1s, it was reasonable to conclude that it was the C–O–H in the WP/PAM had electrostatic interaction with N in MB.58 As a result, XPS results revealed that the adsorption mechanism of the WP/PAM for Cu(II) mainly involved complexation and ion exchange, and the adsorption process for MB was mainly controlled by electrostatic interaction, which were consistent with the results59,60
O reduced. The phenomenon enabled Cu(II) and oxygen-containing functional groups to form Cu–O through complexation reaction.43 As for the WP/PAM–MB, the C–O–H peak originally located at 532.71 eV had moved to a higher binding energy (532.81 eV), demonstrating that C–O–H was involved in the MB adsorption, which was in accordance with the results reported previously.57 Combined with the analysis of N 1s, it was reasonable to conclude that it was the C–O–H in the WP/PAM had electrostatic interaction with N in MB.58 As a result, XPS results revealed that the adsorption mechanism of the WP/PAM for Cu(II) mainly involved complexation and ion exchange, and the adsorption process for MB was mainly controlled by electrostatic interaction, which were consistent with the results59,60
![[double bond, length as m-dash]](https://www.rsc.org/images/entities/char_e001.gif) O at 1681 cm−1 was shifted to 1669 cm−1, which could be attributed to the formation of complexes between carboxyl groups in surface and Cu(II) in the solution.49 These revealed that the Cu(II) adsorption process on the WP/PAM involved complexation,62 which was in accordance with the XPS analysis.
O at 1681 cm−1 was shifted to 1669 cm−1, which could be attributed to the formation of complexes between carboxyl groups in surface and Cu(II) in the solution.49 These revealed that the Cu(II) adsorption process on the WP/PAM involved complexation,62 which was in accordance with the XPS analysis.
In the case of MB, new peaks appeared at 1338, 1219, 1173, 1133, and 881 cm−1, pertain to the C–N, AR–N, C![[double bond, length as m-dash]](https://www.rsc.org/images/entities/char_e001.gif) S, C–S connected to the benzene ring, and C–H near the benzene ring, respectively.63,64 After reacting with MB, the C–N on the WP/PAM was shifted from 1405 to 1396 cm−1, which was consistent with previous studies.65 It was reported that MB is a cationic dye, which could utilize the N atom of the C–N group and S atom of the C–S group as hydrogen bond acceptor to form an intermolecular hydrogen bond with H atom of the hydroxyl in the WP/PAM.64,66 The C
S, C–S connected to the benzene ring, and C–H near the benzene ring, respectively.63,64 After reacting with MB, the C–N on the WP/PAM was shifted from 1405 to 1396 cm−1, which was consistent with previous studies.65 It was reported that MB is a cationic dye, which could utilize the N atom of the C–N group and S atom of the C–S group as hydrogen bond acceptor to form an intermolecular hydrogen bond with H atom of the hydroxyl in the WP/PAM.64,66 The C![[double bond, length as m-dash]](https://www.rsc.org/images/entities/char_e001.gif) O at 1681 cm−1 was shifted to 1669 cm−1 after adsorption, which was caused by the reaction between negatively charged groups in the composite matrix with the unsaturated dimethylamine groups of MB and the formation of hydrogen bonds according to Gomes et al.29 and Abdel et al.67
O at 1681 cm−1 was shifted to 1669 cm−1 after adsorption, which was caused by the reaction between negatively charged groups in the composite matrix with the unsaturated dimethylamine groups of MB and the formation of hydrogen bonds according to Gomes et al.29 and Abdel et al.67
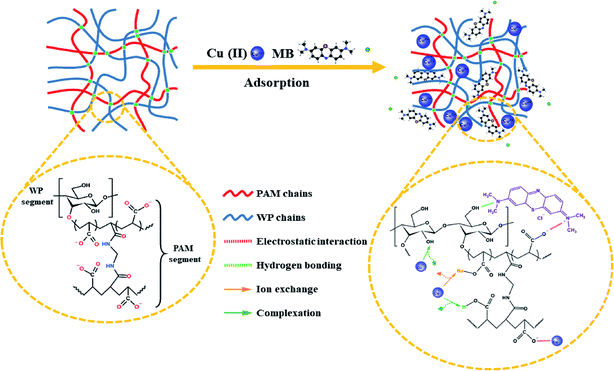
Fig. 8 provided a brief illustration of the adsorption mechanism.
3.5 Desorption and regeneration of the WP/PAM
The reusability of the WP/PAM was also an important index to evaluate the material practicability. It could be seen in Fig. S6 and Table S4† that the WP/PAM hydrogel presented good stable adsorption performance and reusability. After 6 adsorption–desorption cycles, the loss of removal rate of the WP/PAM for Cu(II) could be negligible, while the adsorption and removal rate of MB could still reach more than 82% with high concentration (600 mg L−1). Additionally, the WP/PAM could be separated directly from wastewater by natural settling. The recovery method with easy to operation and low loss presented a great potential of the WP/PAM in wastewater treatment.3.6 Treatment of simulated printing and dyeing wastewater
The parameters of simulated wastewater before and after treatment were summarized in Table 5. The pH of the simulated printing and dyeing wastewater were acidic, because the metal salts (i.e., CuSO4, CoCl2, MnCl2 and NiCl2) added to the simulated wastewater belong to strong acid and weak base salts. When they dissolved in water, hydrolysis occurred to generate weak electrolyte hydroxides and H+, resulting in acidic solution. The reason why the pH of the treated simulated wastewater reached neutral was that due to the adsorption of WP/PAM, and the corresponding hydrolytic equilibrium shifted, resulting in the decrease of H+ in the solution. Therefore, the pH of the solution increased after the WP/PAM reacted with metal ions. Furthermore, captured by 3 g L−1 WP/PAM, the ion concentrations of wastewater were basically lower than the limit of industrial wastewater discharged in China (Cu(II): 0.5 mg L−1, Co(II): 1.0 mg L−1, Ni(II): 1.0 mg L−1 and Mn(II): 2.0 mg L−1). After the treatment, incineration and landfill were considered as the disposal methods of the adsorbed WP/PAM. In general, the WP/PAM showed good potential for treating MB industrial wastewater containing heavy metal ions.| Parameters | Sample prepared by deionized water | Sample prepared by tap water | Sample prepared by Xiangjiang river | ||||
|---|---|---|---|---|---|---|---|
| Before | After | Before | After | Before | After | ||
| pH | 4.64 | 7.46 | 5.51 | 7.63 | 5.40 | 7.18 | |
| Pollutants (mg L−1) | MB | 505.35 | 3.85 | 495.45 | 5.40 | 491.28 | 5.12 |
| Cu(II) | 125.60 | 0.45 | 114.78 | 0.45 | 115.55 | 0.45 | |
| Co(II) | 54.67 | 0.16 | 51.92 | 0.17 | 57.36 | 0.15 | |
| Mn(II) | 35.84 | 0.33 | 35.09 | 0.27 | 34.84 | 0.28 | |
| Ni(II) | 20.07 | 0.73 | 22.89 | 0.74 | 22.35 | 0.83 | |
4. Conclusions and outlook
In this study, the double-network hydrogel based on WP cellulose was successfully synthesized, which could effectively remove Cu(II) and MB. The WP/PAM presented a 3D porous network structure cross-linked by bundles of paper fibers and PAM, which effectively exposed a large number of active adsorption sites. In addition, the WP/PAM had excellent swelling properties (SR = 66.75), which promoted the mass transfer of Cu(II) and MB on the WP/PAM. The excellent structural properties of the WP/PAM played a favorable role in the adsorption of Cu(II) and MB. Batch experiments showed that the adsorption process of Cu(II) and MB was more consistent with the pseudo-second-order kinetic model and the Langmuir model. At 25 °C, the maximum adsorption capacities of the WP/PAM for Cu(II) and MB obtained by Langmuir model fitting were 142.2 mg g−1 and 1714.5 mg g−1, respectively. The competitive adsorption experiments between Cu(II) and MB showed that Cu(II) was more inclined to adsorb on the WP/PAM than MB. The adsorption mechanism analysis results indicated that the adsorption mechanism mainly included ion exchange, complexation for Cu(II), while electrostatic interaction and hydrogen bonding for MB. Besides, the WP/PAM can effectively handle simulated wastewater containing Cu(II) and MB. This study provides a new way for recycling of WP and a valuable reference for its application in wastewater treatment.However, there were still shortcomings and areas for improvement in our work. In order to apply the WP/PAM better into practical wastewater treatment, it is necessary to study the effect of different sources of WP on the adsorption performance of WP/PAM, more simplified synthesis steps and more economical amounts of regeneration solution to ensure lower costs. The adsorption behavior and the adsorption mechanism of the WP/PAM on other heavy metal mordants also need to be explored in more depth. In the future, an adsorption tower will be prepared for research on the practical application. The equipment will include a storage tower (filled with water to ensure the expansion effect), adsorption tower, regeneration device, etc. Some important details, such as how these devices can be properly assembled and placed in the adsorption tower to make the treatment process simple and efficient, the replacement period of the WP/PAM, and the more economical way of waste disposal, will be the direction and focus of our future work.
Author contributions
Yaoning Chen: supervision, validation, funding acquisition, writing – review & editing. Linshenzhang Li: data curation, investigation, methodology, visualization, writing – original draft. Yuanping Li: supervision, writing – review. Yihuan Liu: writing – review & editing. Yanrong Chen: writing – review & editing. Hui Li: supervision, funding acquisition & writing – review. Meiling Li: methodology, writing – review & editing. Fangting Xu: software, writing – review & editing. Yuqing Liu: writing – review & editing.Conflicts of interest
There are no conflicts to declare.Acknowledgements
This study was financially supported by the National Natural Science Foundation of China (51979104), Training Program for Excellent Young Innovators of Changsha (kq1802010, kq1802040), Science and Technology Planning Project of Hunan Province (2018RS3109), and Natural Science Foundation of Hunan Province, China (2020JJ5019).References
- Y. N. Chen, Y. H. Liu, Y. P. Li, Y. R. Chen, Y. X. Wu, H. Li, S. Wang, Z. Peng, R. Xu and Z. P. Zeng, Water, Air, Soil Pollut., 2020, 231, 404 CrossRef CAS.
- Y. N. Chen, Y. Q. Liu, Y. P. Li, Y. X. Wu, Y. R. Chen, Y. H. Liu, J. C. Zhang, F. T. Xu, M. L. Li and L. S. Z. Li, Chem. Eng. J., 2020, 388, 124313 CrossRef CAS.
- H. Maleki, Chem. Eng. J., 2016, 300, 98–118 CrossRef CAS.
- H. Kun, H. H. Tian, K. Yan, S. B. You, H. Z. Yong, Z. Yuan and W. Y. Li, Ind. Water Treat., 2018, 38, 59–62 Search PubMed.
- L. J. Rather, I. Shahid ul, M. Shabbir, M. N. Bukhari, M. Shahid, M. A. Khan and F. Mohammad, J. Environ. Chem. Eng., 2016, 4, 3041–3049 CrossRef CAS.
- Y. N. Chen, S. Wang, Y. P. Li, Y. H. Liu, Y. R. Chen, Y. X. Wu, J. C. Zhang, H. Li, Z. Peng, R. Xu and Z. P. Zeng, J. Colloid Interface Sci., 2020, 575, 367–376 CrossRef CAS PubMed.
- Y. N. Chen, W. Y. Liang, Y. P. Li, Y. X. Wu, Y. R. Chen, W. Xiao, L. Zhao, J. C. Zhang and H. Li, Chem. Eng. J., 2019, 362, 144–159 CrossRef CAS.
- Y. R. Chen, Y. N. Chen, Y. Li, Y. X. Wu, Z. P. Zeng, R. Xu, S. Wang, H. Li and J. C. Zhang, J. Hazard. Mater., 2019, 378, 120757 CrossRef CAS PubMed.
- K. Y. Kumar, H. B. Muralidhara, Y. A. Nayaka, J. Balasubramanyam and H. Hanumanthappa, Powder Technol., 2013, 246, 125–136 CrossRef CAS.
- Y. N. Chen, R. Xu, Y. P. Li, Y. H. Liu, Y. X. Wu, Y. R. Chen, J. C. Zhang, S. Chen, H. S. Yin, Z. P. Zeng, S. Wang and Z. Peng, Colloids Surf., A, 2020, 599, 124870 CrossRef CAS.
- Y. L. Chen, B. C. Pan, H. Y. Li, W. M. Zhang, L. Lv and J. Wu, Environ. Sci. Technol., 2010, 44, 3508–3513 CrossRef CAS PubMed.
- H. C. Bi, X. Huang, X. Wu, X. H. Cao, C. L. Tan, Z. Y. Yin, X. H. Lu, L. T. Sun and H. Zhang, Small, 2014, 10, 3544–3550 CrossRef CAS PubMed.
- Y. N. Chen, Y. H. Liu, Y. P. Li, L. Zhao, Y. R. Chen, H. Li, Y. Q. Liu, L. S. Z. Li, F. T. Xu and M. L. Li, Environ. Sci. Pollut. Res., 2020, 38644–38653, DOI:10.1007/s11356-020-09907-6.
- M. C. Nongbe, G. Bretel, T. Ekou, L. Ekou, B. K. Yao, E. Le Grognec and F.-X. Felpin, Cellulose, 2018, 25, 4043–4055 CrossRef CAS.
- Z. Y. Li, L. Shao, Z. H. Ruan, W. B. Hu, L. B. Lu and Y. J. Chen, Carbohydr. Polym., 2018, 193, 221–227 CrossRef CAS PubMed.
- H. Y. Jia, Z. J. Huang, Z. F. Fei, P. J. Dyson, Z. Zheng and X. L. Wang, ACS Appl. Mater. Interfaces, 2016, 8, 31339–31347 CrossRef CAS PubMed.
- T. Nakajima, H. Sato, Y. Zhao, S. Kawahara, T. Kurokawa, K. Sugahara and J. P. Gong, Adv. Funct. Mater., 2012, 22, 4426–4432 CrossRef CAS.
- J. H. Ma, Y. T. Liu, O. Ali, Y. F. Wei, S. Q. Zhang, Y. M. Zhang, T. Cai, C. B. Liu and S. L. Luo, J. Hazard. Mater., 2018, 344, 1034–1042 CrossRef CAS PubMed.
- J. H. Ma, T. Li, Y. T. Liu, T. Cai, Y. F. Wei, W. Y. Dong and H. Chen, Bioresour. Technol., 2019, 290, 121793 CrossRef CAS PubMed.
- F. D. Wang, J. Li, Y. Su, Q. Li, B. Y. Gao, Q. Y. Yue and W. Z. Zhou, J. Ind. Eng. Chem., 2019, 80, 361–369 CrossRef CAS.
- L. Zhang, Y. Mao, J. Zhou and J. Cai, Ind. Eng. Chem. Res., 2005, 44, 522–529 CrossRef CAS.
- H. X. Li, Q. Wang, L. M. Zhang, X. Tian, Q. Cao and L. E. Jin, Polym. Degrad. Stab., 2019, 168, 108958 CrossRef.
- S. Mohammadi, H. Keshvari, M. Eskandari and S. Faghihi, React. Funct. Polym., 2016, 106, 120–131 CrossRef CAS.
- B. C. Zhao, H. B. Jiang, Z. K. Lin, S. F. Xu, J. Xie and A. P. Zhang, Carbohydr. Polym., 2019, 224, 115022 CrossRef PubMed.
- J. N. Putro, A. Kurniawan, S. Ismadji and Y.-H. Ju, Environ. Nanotechnol. Monit. Manage., 2017, 8, 134–149 Search PubMed.
- B. C. Melo, F. A. A. Paulino, V. A. Cardoso, A. G. B. Pereira, A. R. Fajardo and F. H. A. Rodrigues, Carbohydr. Polym., 2018, 181, 358–367 CrossRef CAS PubMed.
- H. J. Dai, Y. Huang and H. H. Huang, Carbohydr. Polym., 2018, 185, 1–11 CrossRef PubMed.
- S. P. Xu, H. Li, H. Ding, Z. X. Fan, P. H. Pi, J. Cheng and X. F. Wen, Carbohydr. Polym., 2019, 214, 8–14 CrossRef CAS PubMed.
- R. F. Gomes, A. C. de Azevedo, A. G. Pereira, E. C. Muniz, A. R. Fajardo and F. H. Rodrigues, J. Colloid Interface Sci., 2015, 454, 200–209 CrossRef CAS PubMed.
- Y. H. Teow, L. M. Kam and A. W. Mohammad, J. Environ. Chem. Eng., 2018, 6, 4588–4597 CrossRef CAS.
- L. Song, F. Q. Liu, C. Q. Zhu and A. M. Li, Chem. Eng. J., 2019, 369, 641–651 CrossRef CAS.
- G. Y. Zhou, J. M. Luo, C. B. Liu, L. Chu, J. H. Ma, Y. H. Tang, Z. B. Zeng and S. L. Luo, Water Res., 2016, 89, 151–160 CrossRef CAS PubMed.
- F. T. Wang, Y. F. Pan, P. X. Cai, T. X. Guo and H. N. Xiao, Bioresour. Technol., 2017, 241, 482–490 CrossRef CAS PubMed.
- M. Hu, X. Y. Gu, Y. Hu, T. Wang, J. Huang and C. Y. Wang, Macromolecules, 2016, 49, 3174–3183 CrossRef CAS.
- T. Benhalima and H. Ferfera-Harrar, Int. J. Biol. Macromol., 2019, 132, 126–141 CrossRef CAS PubMed.
- R. Fernandez-Gonzalez, M. A. Martin-Lara, I. Ianez-Rodriguez and M. Calero, Bioresour. Technol., 2018, 268, 169–175 CrossRef CAS PubMed.
- Q. Ying, Y. M. Hao, Z. M. Wang and X. J. Li, J. Taiwan Inst. Chem. Eng., 2019, 95, 32–39 CrossRef CAS.
- J. L. Wang, L. G. Wei, Y. C. Ma, K. L. Li, M. H. Li, Y. C. Yu, L. Wang and H. H. Qiu, Carbohydr. Polym., 2013, 98, 736–743 CrossRef CAS PubMed.
- C. S. Chiou and H. W. Chen, Int. J. Waste Resour., 2016, 6, 3–7 Search PubMed.
- Y. M. Hao, C. Man and Z. B. Hu, J. Hazard. Mater., 2010, 184, 392–399 CrossRef CAS PubMed.
- W. B. Wang, G. Y. Tian, Z. F. Zhang and A. Q. Wang, Chem. Eng. J., 2015, 265, 228–238 CrossRef CAS.
- Z. M. Liu, G. Chen, F. P. Hu and X. Li, J. Environ. Manage., 2020, 263, 110377 CrossRef CAS PubMed.
- Y. N. Chen, M. L. Li, Y. P. Li, Y. H. Liu, Y. R. Chen, H. Li, L. S. Z. Li, F. T. Xu, H. J. Jiang and L. Chen, Bioresour. Technol., 2020, 321, 124413 CrossRef PubMed.
- M. L. F. A. De Castro, M. L. B. Abad, D. A. G. Sumalinog, R. R. M. Abarca, P. Paoprasert and M. D. G. de Luna, Sustainable Environ. Res., 2018, 28, 197–205 CrossRef CAS.
- A. Gunay, E. Arslankaya and I. Tosun, J. Hazard. Mater., 2007, 146, 362–371 CrossRef PubMed.
- C. H. Tian, J. R. She, Y. Q. Wu, S. Luo, Q. L. Wu and Y. Qing, Polym. Compos., 2017, 39, 4442–4451 CrossRef.
- Y. Y. Yue, J. Q. Han, G. P. Han, A. D. French, Y. D. Qi and Q. L. Wu, Carbohydr. Polym., 2016, 147, 155–164 CrossRef CAS PubMed.
- Y. F. Pan, X. Shi, P. X. Cai, T. X. Guo, Z. F. Tong and H. N. Xiao, Cellulose, 2018, 25, 2559–2575 CrossRef CAS.
- U. A. Guler and M. Sarioglu, J. Environ. Chem. Eng., 2013, 1, 369–377 CrossRef CAS.
- Z. F. Cao, X. Wen, P. Chen, F. Yang, X. L. Ou, S. Wang and H. Zhong, Colloids Surf., A, 2018, 549, 94–104 CrossRef CAS.
- T. H. Tran, H. Okabe, Y. Hidaka and K. Hara, Carbohydr. Polym., 2017, 157, 335–343 CrossRef CAS PubMed.
- D. N. Mengesha, R. Appiah-Ntiamoah and H. Kim, Chemosphere, 2021, 279, 130463 CrossRef CAS PubMed.
- Y. Feng, Y. Li, M. Xu, S. Liu and J. Yao, RSC Adv., 2016, 6, 109608–109612 RSC.
- P. K. Boruah, D. J. Borah, J. Handique, P. Sharma, P. Sengupta and M. R. Das, J. Environ. Chem. Eng., 2015, 3, 1974–1985 CrossRef CAS.
- F. Wang, L. J. Zhang, Y. Y. Wang, X. J. Liu, S. Rohani and J. Lu, Appl. Surf. Sci., 2017, 420, 970–981 CrossRef CAS.
- Z. H. Hu, A. M. Omer, X. K. Ouyang and D. Yu, Int. J. Biol. Macromol., 2018, 108, 149–157 CrossRef CAS PubMed.
- C. B. Godiya, Y. Xiao and X. Lu, Int. J. Biol. Macromol., 2020, 144, 671–681 CrossRef CAS PubMed.
- W. Wei, J. Li, X. Han, Y. Yao, W. Zhao, R. Han, S. Li, Y. Zhang and C. Zheng, Sci. Total Environ., 2021, 778, 146189 CrossRef CAS PubMed.
- S.-W. Lv, J.-M. Liu, H. Ma, Z.-H. Wang, C.-Y. Li, N. Zhao and S. Wang, Microporous Mesoporous Mater., 2019, 282, 179–187 CrossRef CAS.
- S. Raghunath, K. Anand, R. M. Gengan, M. K. Nayunigari and A. Maity, J. Photochem. Photobiol., B, 2016, 165, 189–201 CrossRef CAS PubMed.
- B. Li, J. Q. Lv, J. Z. Guo, S. Y. Fu, M. Guo and P. Yang, Bioresour. Technol., 2019, 275, 360–367 CrossRef CAS PubMed.
- P. Taddei, P. Monti, G. Freddi, T. Arai and M. Tsukada, J. Mol. Struct., 2003, 651, 433–441 CrossRef.
- Y. N. Chen, Z. P. Zeng, Y. P. Li, Y. H. Liu, Y. R. Chen, Y. X. Wu, J. C. Zhang, H. Li, R. Xu, S. Wang and Z. Peng, J. Colloid Interface Sci., 2020, 573, 287–298 CrossRef CAS PubMed.
- J. Gong, J. Liu, Z. W. Jiang, X. Wen, E. Mijowska, T. Tang and X. C. Chen, J. Colloid Interface Sci., 2015, 445, 195–204 CrossRef CAS PubMed.
- G. R. Mahdavinia, M. Soleymani, M. Sabzi, H. Azimi and Z. Atlasi, J. Environ. Chem. Eng., 2017, 5, 2617–2630 CrossRef CAS.
- Y. X. Ma, W. J. Shao, W. Sun, Y. L. Kou, X. Li and H. P. Yang, Appl. Surf. Sci., 2018, 459, 544–553 CrossRef CAS.
- H. M. Abdel-Aziz, A. A. El-Zahhar and T. Siyam, J. Appl. Polym. Sci., 2012, 124, 386–396 CrossRef CAS.
Footnotes |
| † Electronic supplementary information (ESI) available. See DOI: 10.1039/d1ra02321g |
| ‡ These authors contributed equally to this article. |
| This journal is © The Royal Society of Chemistry 2021 |

