
 Open Access Article
 This Open Access Article is licensed under a Creative Commons Attribution-Non Commercial 3.0 Unported Licence
Discrimination between sialic acid linkage modes using sialyllactose-imprinted polymers†
Liliia Mavliutovaa,
Bruna Munoz Aldeguera,
Jesper Wiklander b,
Celina Wierzbickaa,
Chau Minh Huynhc,
Ian A. Nichollsb,
Knut Irgumc and
Börje Sellergren*a
b,
Celina Wierzbickaa,
Chau Minh Huynhc,
Ian A. Nichollsb,
Knut Irgumc and
Börje Sellergren*a
aDepartment of Biomedical Sciences, Faculty of Health and Society, Malmö University, SE-20506 Malmö, Sweden. E-mail: borje.sellergren@mau.se
bBioorganic and Biophysical Chemistry Laboratory, Linnaeus University Centre for Biomaterials Chemistry, Department of Chemistry and Biomedical Sciences, Linnaeus University, 391 82 Kalmar, Sweden
cDepartment of Chemistry, Umeå University, 901 87 Umeå, Sweden
First published on 24th June 2021
Abstract
Glycosylation plays an important role in various pathological processes such as cancer. One key alteration in the glycosylation pattern correlated with cancer progression is an increased level as well as changes in the type of sialylation. Developing molecularly-imprinted polymers (MIPs) with high affinity for sialic acid able to distinguish different glycoforms such as sialic acid linkages is an important task which can help in early cancer diagnosis. Sialyllactose with α2,6′ vs. α2,3′ sialic acid linkage served as a model trisaccharide template. Boronate chemistry was employed in combination with a library of imidazolium-based monomers targeting the carboxylate group of sialic acid. The influence of counterions of the cationic monomers and template on their interactions was investigated by means of 1H NMR titration studies. The highest affinities were afforded using a combination of Br− and Na+ counterions of the monomers and template, respectively. The boronate ester formation was confirmed by MS and 1H/11B NMR, indicating 1![[thin space (1/6-em)]](https://www.rsc.org/images/entities/char_2009.gif) :2 stoichiometries between sialyllactoses and boronic acid monomer. Polymers were synthesized in the form of microparticles using boronate and imidazolium monomers. This combinatorial approach afforded MIPs selective for the sialic acid linkages and compatible with an aqueous environment. The molecular recognition properties with respect to saccharide templates and glycosylated targets were reported.
:2 stoichiometries between sialyllactoses and boronic acid monomer. Polymers were synthesized in the form of microparticles using boronate and imidazolium monomers. This combinatorial approach afforded MIPs selective for the sialic acid linkages and compatible with an aqueous environment. The molecular recognition properties with respect to saccharide templates and glycosylated targets were reported.
Introduction
Sialic acids belong to a family of monosaccharides that are typically found as terminal moieties of glycans. One of the main variants of sialic acids is N-acetylneuraminic acid (SA) which is generally linked to the underlying glycan chains via 3′ or 6′ positions of galactose (Gal), 6′ position of N-acetylgalactosamine (GalNAc), or 8′ or 9′ position of another SA.1 Changes in SA expression correlate with a variety of diseases such as cardiovascular disease, neurological disorders and cancer.2–5 Generally, the total level of SA in cancer increases together with changes in modes of linkage,6–9 with α2,6′-GalNAc becoming particularly noticeable as a cancer biomarker in the form of the STn antigen.8,10 Another potential biomarker is prostate specific antigen featuring increase in 2,3′-sialylation pattern related to aggressive cancer progression.11 However, glycosylation analysis remains challenging due to high diversity of the glycan isomers, including linkage isomers. Antibodies and lectins are typically used in glycan characterization and purification, including affinity chromatography or affinity binding and precipitation.12 Standard lectins used for the analysis of 2,6′ vs. 2,3′ SA are Sambucus nigra (SNA)13 and Maackia amurensis (MAA),14 respectively. However, their application is limited by high cost, poor availability, low affinities in some cases and limitation in storage/application conditions. Therefore, development of robust glycan specific receptors is of great importance for the advancement of glycan research.Molecularly imprinted polymers (MIPs) offer an alternative to synthetic carbohydrate receptors. Here, highly complementary binding sites are formed by fixing pre-ordered template/functional monomer complexes into a highly crosslinked polymer matrix.15,16 Various carbohydrate specific MIPs were produced for the recognition of neutral mono/oligosaccharides15,17 as well as charged species such as sialic,18,19 hyaluronic20 and glucuronic acids.20 We have previously shown a powerful tool for selective labeling of cell surface glycans by SA imprinted fluorescent core–shell nanoparticles.21 The glycospecific MIPs were produced using combined boronate, amine and urea-based cooperative imprinting. The resulting ternary or higher complexes gave rise to multifunctional binding sites with high affinity for the targeted glycan. Although SA imprinting has been extensively studied, the diversity of the saccharide and its mode of linkage hasn't been addressed in detail so far.
As a continuation of our previous work on SA imprinting, we here report on molecularly imprinted polymers capable of distinguishing between sialic acid isoforms. Sialyllactoses with 2,3′ and 2,6′-linked sialic acid (3SL and 6SL, respectively) were used as model templates for carbohydrate imprinting. Charged cationic imidazolium receptors, previously shown to be compatible with polar protic solvents for anion recognition,22 were used as functional monomers. Several types of imidazolium-based polymerizable receptors were compared along with the effect of counterion species of the charged monomers and saccharide template on the interaction strength. The strongest monomer–template pair was then used to imprint 3SL and 6SL. The synthetic sialyllactose binder was shown to be compatible with aqueous environment and able to recognize glycoproteins featuring different expression level of the two glycan forms.
Experimental section
Materials
N-vinyl imidazole, 2,6-bis-(bromomethyl) pyridine, sulfur, 4-vinylbenzeneboronic acid (VBA), benzoic acid (BA), 2,5-dihydroxybenzoic acid (DHB), lactose (Lac), 2-aminobenzamide (2-AB), 2-methylpyridine borane complex, serum apo-transferrin bovine (Tf-B), serum apo-transferrin human (Tf-H), fetuin from bovine serum (Fet) and human serum albumin (HSA) were from Sigma-Aldrich. N,N′-azo-bis(2,4-dimethyl)valeronitrile (ABDV) was purchased from Wako Chemicals GmbH (Neuss, Germany). Ethylene glycol dimethacrylate (EGDMA) and 18-crown-6 (18C6) was from Acros Organics. Acetic acid, phenol, sulfuric acid, alizarin red S (ARS), BCA assay kit, ammonium acetate, ammonium bicarbonate, formic acid (FA), trifluoracetic acid (TFA), anhydrous methanol (MeOH), DMSO-d6 and methanol-d4 (CD3OD) were from VWR chemicals. Monosaccharides mannose (Man), glucose (Glc), galactose (Gal) and fructose (Fru) were obtained from Sigma Aldrich. D-Glucuronic acid (GA) was received from Fluka. N-Acetyl neuraminic acid (SA or Neu5Ac), 2,6′-sialyllactose sodium salt (6SL) and 2,3′-sialyllactose sodium salt (3SL) were purchased from Carbosynth Limited. 2-AB labelled SL was synthesized according to a procedure reported before,23 with purification by column chromatography. EGDMA was passed through a column of activated basic alumina to remove inhibitor and stored at −20 °C before polymerization. All solvents for HPLC analysis were HPLC grade and were purchased from VWR. The functional monomers 3-benzyl-1-vinyl-1H-imidazolium bromide (1Br),24 1,1'-[1,5-bis(methylene)pyridine]bis[3-vinyl]-1H-imidazolium dibromide (2Br)25 and 1,1'-[1,5-phenylenebis(methylene)]bis[3-vinyl]-1H-imidazolium dibromide (3Br)26 were synthesized as reported before.Instruments and methods
1H NMR spectra were recorded on an Agilent Mercury 400 MHz instrument. 11B NMR spectra were recorded on a Bruker Avance Neo 400 MHz instrument. High performance liquid chromatography (HPLC) measurements were carried out on an Alliance 2795 instrument equipped with 2996 PDA detector (Waters, Milford, MA, USA). Mass spectra were recorded on a Waters QUATTRO-ZQ Spectrometer with 2696/2795 HPLC Separations Module. Polymer morphology and size was determined using a Zeiss EVO LS 10 (E)SEM (Carl Zeiss AG, Oberkochen, Germany). Elemental analysis was done at the Department of Organic Chemistry, Johannes Gutenberg Universität Mainz using a Heraeus CHN-rapid analyzer (Hanau, Germany). Infrared spectra were recorded using a Thermo Nicolet Nexus 6700 instrument (Thermo Scientific, Waltham, MA, USA). UV absorbance measurements were performed on a Safire plate reader (Tecan Group Ltd., Männedorf, Switzerland) using a polystyrene 96-well microplate. All mass spectra were obtained using a MALDI reflector time of flight mass spectrometer (ultra-fleXtreme MALDI TOF/TOF MS/MS; Bruker Daltonics, Bremen, Germany) controlled by flexControl software version 2.4 from Bruker Daltonics (Bremen, Germany). Microwave assisted extraction was achieved using a Biotage Initiator 2.5 + Microwave system with Robot Sixty from Biotage AB (Uppsala, Sweden). Determination of polymer swelling was done by measuring the hight of dry polymer particles (10 mg) packed in NMR tube (d = 0.5 mm) and polymer bed after soaking in MeOH (1 ml, 24 h). Swelling factor was calculated as the ratio of the bed height of swollen and dry polymer particles. Polymer surface area, pore volume and diameter were determined by nitrogen sorption analysis. Prior to the measurements, polymer beds were dried at 40 °C under vacuum overnight, then transferred to sample tubes and purged for 150 min at 60 °C by a flow of N2 using a Micromeritics (Atlanta, GA, USA) SmartPrep degassing unit. The dried samples were then analysed by multipoint nitrogen adsorption–desorption at cryoscopic temperature on a Micromeritics TriStar 3000 automated gas adsorption analyzer. The specific surface areas of materials were determined based on the Brunauer–Emmett–Teller (BET) model using adsorption data in the relative pressure range from 0.18 to 0.35. By using the Barrett–Joyner–Halenda (BJH) scheme, the total pore volume, and average mesopore diameter between 1.7 and 300 nm were derived from the desorption branches of the isotherms. The zeta-potential was measured on Malvern Zetasizer Ultra (Malvern Panalytical Ltd., UK).1H NMR spectroscopic titrations and estimation of binding affinities and stoichiometries
The complex stoichiometry was first assessed using Job's method of continuous variation in DMSO-d6. Stock solutions of the host monomer and guest (10 mM and 25 mM, respectively) were combined in NMR tubes in the following molar ratios: 0:10, 2:8, 3:7, 4:6, 5:5, 6:4, 7:3, 8:2, 10:0. Total concentration of host and guest was 2 mM. 1H NMR spectra were thereafter recorded and the proton signals were monitored and used for the evaluation of the complex stoichiometry.
1H NMR spectroscopic titrations were performed in dry DMSO-d6 and methanol-d4. An increasing amount of guest was titrated into a constant amount of functional monomer (1–3). The concentration of the functional monomer was 2 mM and the amount of added guest was 0, 0.25, 0.5, 0.75, 1.0, 1.5, 2.0, 4.0, 6.0, and 10.0 equivalents. The complexation induced shifts (CISs) of relevant protons were followed and titration curves were constructed of CIS versus guest concentration (c). The raw titration data were fitted to a 1:1 binding site model (eqn (1)), a 1:2 model (2) or a cooperative binding site model (3):
 | (1) |
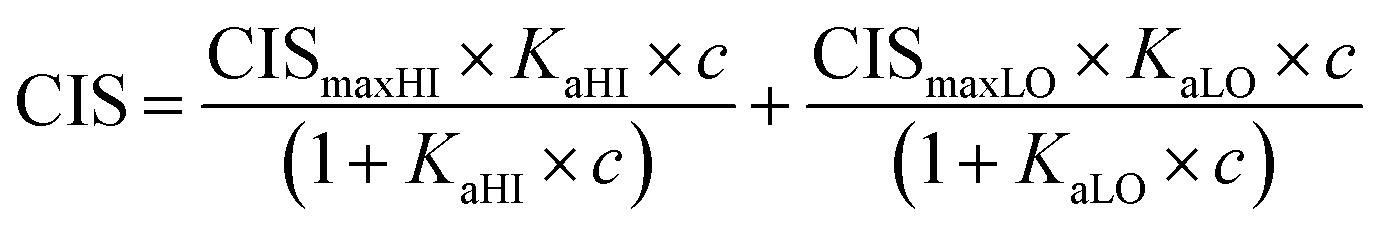 | (2) |
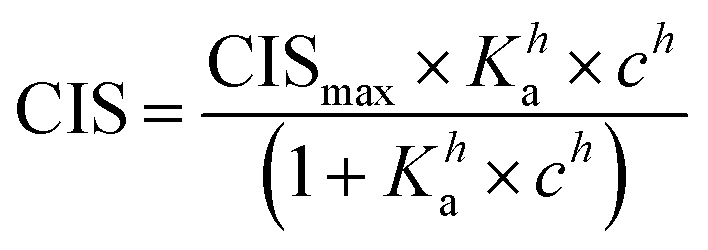 | (3) |
11B NMR
SL (10 mM) were first esterified with VBA (20 mM) in methanol, dried and redissolved in CD3OD. ARS (10 mM) was esterified with VBA (10 mM) in methanol, dried and redissolved in CD3OD.ESI-MS of boronic esters
SL were first esterified with 3 equivalents of VBA in pyridine. Solvent was removed in vacuo at 50 °C. The compounds were redissolved in methanol directly before analysis and diluted to 10 μM with methanol. Spectra were recorded in ESI + mode in the range 100–1500 m/z with capillary voltage 3.5 kV, cone voltage 60 V, desolvation temperature 350 °C, source temperature 120 °C.Polymer synthesis
The following general procedure was used for preparing 6SL and 3SL imprinted polymers (6SL-MIP and 3SL-MIP). Templates 3SL or 6SL (0.025 mmol) were incubated with VBA (0.05 mmol) in 1 ml dry pyridine for 1 h. Afterwards, the solvent was removed in vacuo at 50 °C. The functional monomer 1 (0.025 mmol) was dissolved in 0.5 ml dry methanol and added to the SL–VBA complex. Then EGDMA (0.5 mmol) was dissolved in methanol (0.5 ml) and added to the template/monomer mixture. The initiator ABDV (2% mol% from polymerizable double bonds) was added to the solution and the solution was cooled to 0 °C on ice. The mixture was purged by a flow of dry nitrogen for 5 min. Polymerization was then initiated by placing the tubes into a water bath heated to 50 °C for 24 h and 80 °C for 3 h. Afterwards, the polymers were crushed, sieved with 25–50 mesh sieves and subjected to template removal. Non-imprinted polymers (NIP) were prepared in the same manner described above, but with the omission of the template from the pre-polymerization solution.Template removal
Polymers were first washed with MeOH (3 × 10 ml). Acidic extraction (AE1-6) was done with MeOH/0.1 M HCl 1:1 v/v (6 × 10 ml) with 1 h incubation on a shaker. Microwave assisted template extraction (MAE1-7) was performed with FA-MeOH 1:1 v/v (7 × 5 ml) at 100 °C for 1 h. Afterwards, polymers were washed with 3 × 10 ml MeOH/H2O 1:1 v/v, and, finally, 2 × 10 ml methanol and dried in vacuo. All wash fractions were analyzed by phenol–sulfuric assay and HPLC-UV.
Saccharide binding test
Polymers (20 mg) were incubated with 0.5 ml of 0.25 mM saccharide solutions in PB (pH 7.4, 5 mM) for 24 h at RT. The phenol–sulfuric colorimetric assay was then used to measure carbohydrate concentrations in the supernatant.27 First, 25 μl of 5% (wt/wt) phenol was added to 25 μl of aqueous carbohydrate analyte solution previously aliquoted into the microplate, followed by mixing with a pipettor. Next, 150 μl of H2SO4 was added to each well and mixed with a pipettor. Solutions were incubated for 15 min at 80 °C. After cooling to room temperature, the absorbance was measured at 490 nm using a microplate reader.Template binding tests
Polymers (10 mg each) were suspended in 0.5 ml of a mixture of 3SL and 6SL (each 0.125 mM) in 100% MeOH or 100% MilliQ water and shaken for 24 h at RT. Afterwards, the samples were centrifuged and the supernatant (0.2 ml) was dried (Genevac EZ-2 evaporator), redissolved in 0.2 ml of 75% ACN 25% ammonium acetate buffer (10 mM pH = 6.0) and analyzed by HILIC HPLC using PolyHYDROXYETHYL A (PolyLC Inc, 3 μm, 100 Å, 100 × 3.2 mm). Mobile phases were (A) ACN and (B) ammonium acetate buffer (10 mM, pH = 6.0). An isocratic method of 75% B and 25% B at a flow rate of 0.5 ml min−1 was used. The injection volume was 10 μl and the detection was performed by UV absorbance measurement at 205 nm. Each experiment was performed in triplicate. The resulting peak areas were used to calculate the bound percent of analyte (bound%) on the polymer according to eqn (4):
 | (4) |
Glycoprotein binding tests
Polymers (2 mg) were first pre-equilibrated in 10 mM ammonium bicarbonate buffer (AmBic), pH = 8.0 and then, incubated with 0.2 ml of 0.05 mg ml−1 of proteins (Tf-B, Tf-H, Fet, HSA) in AmBic (10 mM, pH = 8.0) at RT for 1 h. Afterwards, supernatant was removed and polymers washed with 0.2 ml of AmBic (10 mM, pH = 8.0). Elution of the bound proteins was done with 2 × 0.2 ml of 2% FA in water. Supernatants from each step were collected and concentrated ×2 for BCA assay and MALDI-TOF analysis. BCA assay was performed according to enhanced microscale assay procedure, following the manufacturer's protocol. For MALDI, aliquots of 1.5 μl of each fraction were spotted on a MALDI plate, followed by 1.5 μl of matrix solution DHB/0.1% TFA in ACN/H2O 50–50 (v/v) and left to dry. Mass spectra were recorded in positive ion linear mode (∼20000–100000 m/z range). Relative laser intensity was 70%, an average of 2000 shots were collected.
Glycopeptide binding test
Tryptic digest of transferrins was prepared following a previously described procedure.28 The digest, 0.2 ml of 0.05 mg ml−1 in 80–20 v/v% MeOH–AmBic (pH = 8.0, 10 mM), was incubated with 5 mg of polymers for 2 h. Afterwards, polymers were washed once with 0.2 ml loading solution. The supernatants from loading and washing were combined. Elution was done with 2 × 0.2 ml 2% FA in water. Elution fractions were combined. All fractions were dried in vacuo and resuspended in 0.1 ml of ACN–H2O 50–50 with 0.1% TFA. For MALDI, aliquots of 1 μl of each fraction were spotted on MALDI plate, followed by 1 μl of matrix solution DHB/0.1% TFA in ACN/H2O 50–50 (v/v) and left to dry. Mass spectra were recorded in positive ion linear mode (∼1000–8000 m/z range). Relative laser intensity was 30%, an average of 2000 shots were collected.Results and discussion
Interactions of model acids with anion binding monomers
We first turned to optimizing cationic monomers to better complement the carboxylate group of the terminal sialic acid. The most common weak ionogenic groups contain primary and secondary amines, such as aminoethyl or diethylaminoethyl. However, monomers containing primary amine groups should be used cautiously with reducing sugars, known to form Schiff bases with amines, unless this is required. Imidazolium derivatives represent a valid alternative to the most common positively charged anion receptors containing ammonium or guanidinium groups as binding sites. These powerful receptors act by engaging in strong [C–H]+-anion hydrogen bond interactions which persist in highly competitive media.22 Polymerizable versions of these receptors can be prepared in one step from N-vinylimidazole and alkylhalides and have been used by us to develop MIPs for glucuronides,24 phospholipids25 and phosphopeptides,29 featuring strong target affinity in aqueous media. In light of these reports, potential functional monomers for carboxylate imprinting were narrowed down to 3 candidates comprising the mono- (1X) and bis-imidazolium (2X and 3X) functional monomers as bromide (Br) or hexafluorophosphate (PF6) salts, shown in Fig. 1. First, the relative ranking of monomers 1Br–3Br for anion recognition was examined by 1H NMR-titrations using the TBA salt of benzoic acid (BA·TBA) as a model carboxylate.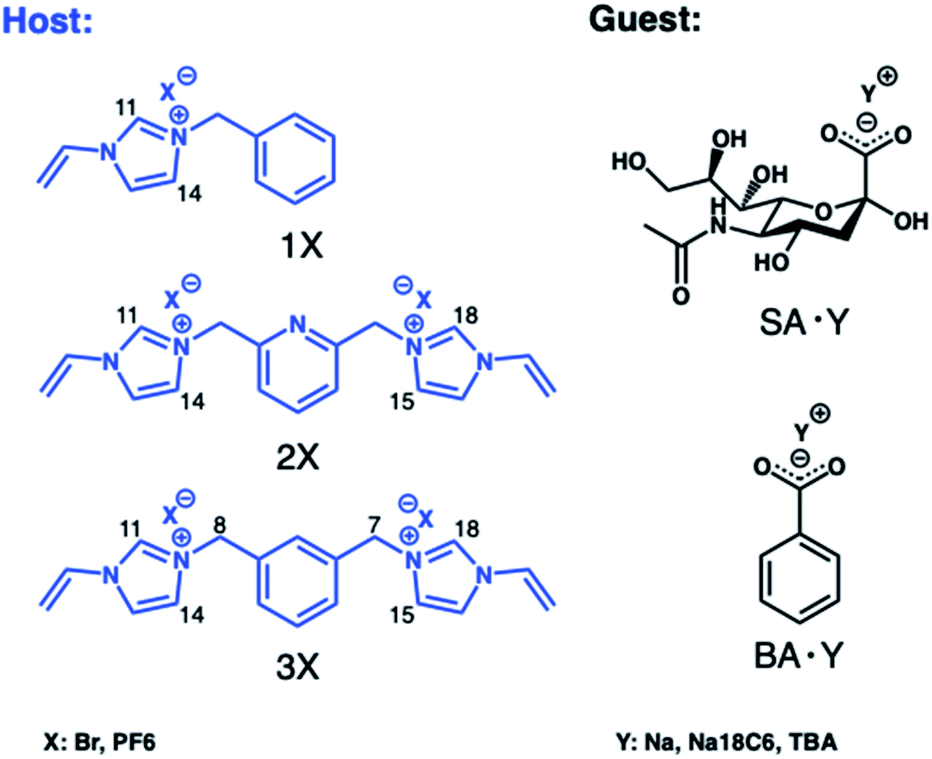 | ||
| Fig. 1 Structures of the functional monomers (hosts) and carboxylate targets (guests) used in 1H NMR titrations. | ||
Since monomers 2X and 3X have two potential binding sites, the stoichiometry of the interaction was first evaluated by Job's method of continuous variation. Although the method should be used cautiously for compounds with low/moderate association constants, it can provide useful information about the host–guest stoichiometry when supported by other data. Typically, strong binding affords a more angular plot, whereas systems with low association constants yield a smoother curvature.30 Thus, subtle changes in the plot can provide clues for presence of higher-order complexes. First, we investigated the stoichiometry of 1Br and 2Br in DMSO-d6 with BA·TBA (Fig. S2†). The maximum of the curve at monomer fraction fm = 0.5 supports the anticipated 1:1 H:G stoichiometry for mono-imidazolium 1Br with BA·TBA. Whereas for bis-imidazolium monomer 2Br the slightly asymmetrical plot indicated a more complex binding behavior. This was supported by 1H NMR titration studies performed to determine the association constants. The host monomers were titrated with a standard solution of the anion guest up to a ten-fold molar excess. The shifts of diagnostic proton resonances were monitored throughout the titrations and used to calculate the association constants from the resulting binding curves (Fig. S3†), comparing curve fittings using Langmuir, bi-Langmuir or Hill isotherm models (Table 1).
| Entry | Host | Guest | Solvent | Diagnostic proton | Ka, M−1 | CISmax, ppm | R2 |
|---|---|---|---|---|---|---|---|
| a Fitted to mono-Langmuir binding model.b Fitted to bi-Langmuir binding model. | |||||||
| 1 | 1Br | BA·TBA | DMSO-d6 | H(11) | 33 ± 7 | 1.081 | 0.9916 |
| 2 | 2Br b | BA·TBA | DMSO-d6 | H(11,18) | 1583 ± 571HI | 0.147HI | 0.9992 |
| 28 ± 9LO | 1.158LO | ||||||
| 3 | 3Br | BA·TBA | DMSO-d6 | H(11,18) | 28 ± 6 | 1.206 | 0.9948 |
| 4 | 2Br | SA·Na | DMSO-d6 | H(11,18) | 105 ± 13 | 0.093 | 0.9927 |
| 5 | 2Br | SA·Na18C6 | DMSO-d6 | H(11,18) | 66 ± 3 | 0.252 | 0.9991 |
| 6 | 2Br | SA·TBA | DMSO-d6 | H(11,18) | 42 ± 2 | 0.142 | 0.9993 |
| 7 | 2PF6 | SA·Na | DMSO-d6 | H(11,18) | 59 ± 7 | 0.382 | 0.9959 |
| 8 | 2PF6 | SA·Na18C6 | DMSO-d6 | H(11,18) | 83 ± 5 | 0.335 | 0.9984 |
| 9 | 2PF6 | SA·TBA | DMSO-d6 | H(11,18) | 53 ± 3 | 0.522 | 0.9993 |
| 10 | 2Br | SA·Na | CD3OD | H(14,15) | 133 ± 14 | 0.007 | 0.9937 |
| 11 | 2Br | SA·Na18C6 | CD3OD | H(14,15) | 78 ± 6 | 0.009 | 0.9979 |
| 12 | 2Br | SA·TBA | CD3OD | H(14,15) | 48 ± 12 | 0.012 | 0.9866 |
| 13 | 2PF6 | SA·Na | CD3OD | H(7,8) | 41 ± 3 | 0.046 | 0.9996 |
| 14 | 2PF6 | SA·Na18C6 | CD3OD | H(7,8) | n/a | n/a | n/a |
| 15 | 2PF6 | SA·TBA | CD3OD | H(7,8) | 23 ± 9 | 0.068 | 0.9942 |
The relative affinity of the imidazolium-based monomers agrees with our previous report on phosphate recognition, ranking bis-imidazolium 2Br as the tightest binder (KaHi = 1583 M−1 and KaLo = 28 M−1) before 3Br (Ka = 28 M−1) and the monoimidazolium monomer 1Br (Ka = 33 M−1). The binding curve for 2Br was best fitted to a two-site binding model revealing the presence of 1:2 stoichiometries for the BA anion. It is reasonable to believe that this corresponds to a tight 1:1 hydrogen bonded ion pair involving H11 and H18 of the imidazolium rings which transitions into a 1:2 interaction at higher concentrations. Pyridine versus benzene substitution also played an important role for the strength of the interaction, as previously observed for similar tweezer-type imidazolium hosts for amino acids recognition.31
Hence, based on the screening of the imidazolium monomers, 2X was the most promising receptor for carboxylates. We then decided to evaluate this monomer further by examining its interaction directly with the sialic acid template. The effect of the monomer's and template's counterion on the binding was carefully monitored. The Job's plot indicated the tendency for a more likely 1:1 interaction 2Br:SA·Na complex (Fig. S4†). This could be explained by steric hindrance in case of larger molecule such as SA, hence obstructing formation of 1:2 complexes. Accordingly, the mono-Langmuir model best described the binding curves of monomer 2Br with SA (Fig. S5†). To select the optimum counterion pairs, the host in the form of Br and PF6 salts was titrated with SA in the form of sodium (SA·Na), sodium-18crown6 (SA·Na18C6) or tetrabutylammonium (SA·TBA) salts (Fig. S6–S8†).
Titrations were performed in CD3OD and DMSO-d6. As can be seen from the Table 1, combination of 2Br with SA·Na gave rise to the highest association constants exceeding that of the lipophilic salts SA·Na18C6 and SA·TBA. We ascribe this effect to the poor solubility of the resulting inorganic salt effectively driving the ion exchange reaction. In contrast, TBA solubilizes the monomer counteranion thereby facilitating its competition with the carboxylate as a hydrogen bond acceptor for the host monomer. This trend seemed less pronounced or even reversed when introducing PF6 as a lipophilic host counterion which generally resulted in weaker interactions. The results contrast moreover with our studies of neutral urea-based receptors where Na18C6 counterions resulted in the strongest interactions.32 This is reasonable given the lack of ion-exchange reactions in this case. Based on these results we decided to proceed with 2Br as functional monomer for sialic acid imprinting.
Interactions with diol targeting boronic acid monomers
Reversible boronic acid–diol interactions have been extensively used for sensing and separation of diol containing molecules such as carbohydrates. SA has been previously reported to exhibit anomalously high binding constants with common boronic acids in comparison to other monosaccharides at neutral pH. This was attributed to the formation of a trigonal-formed complex stabilized by the coordination of an amide group of SA at the C-5 position to the boron atom, forming intramolecular B–N or B–O bonds.33 The α-hydroxyl group of SA is also playing an important role as a potential site for boronic acid interaction. For trisaccharide templates, such as 6SL and 3SL, the exact stoichiometries and reaction conditions for the ester formation should be verified. In addition to the SA glycerol chain, boronic acid could form esters with the lactose unit of the trisaccharide, particularly at the anomeric position of the Glc unit. Structures of the sialyllactose templates with possible sites for boronate ester formation are shown in Fig. 2.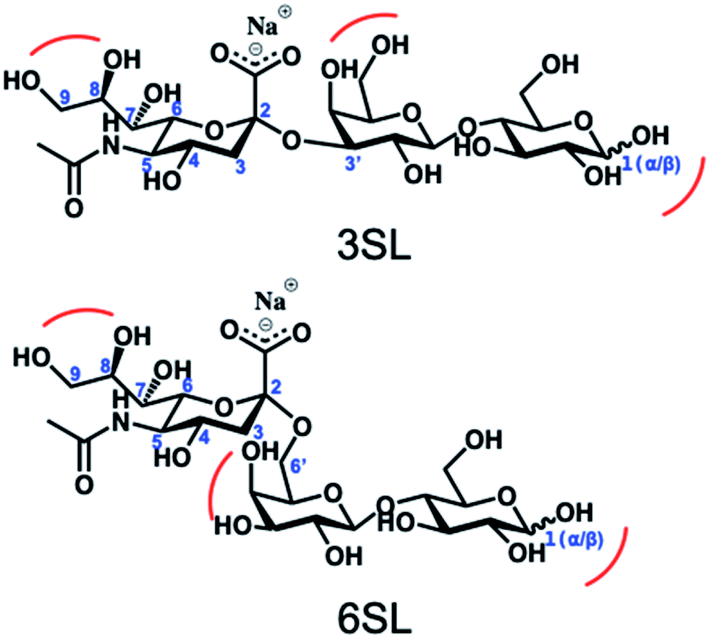 | ||
| Fig. 2 Structures of the sialyllactose templates with possible sites for boronate ester formation. | ||
One commonly used method to study boronate ester formation is 11B NMR. Typically, trigonal and tetrahedral boron species could be distinguished due to the shift of the boron resonance when it is converted from neutral trigonal to its anionic tetrahedral form upon forming an ester with diol-containing compounds. We performed experiments in CD3OD for both isomers with boronic monomer VBA and the ratio of SL:VBA = 1:2. As seen in Fig. 3A this resulted in one single broad resonance with identical shifts both in absence and presence of SL. However, as concluded by Anslyn et al. this does not disprove complex formation since in CD3OD the boronic acid is esterified by the solvent which is difficult to distinguish from the trigonal carbohydrate–boron complex.34–36 Additionally, the overall broadening of the peaks, more pronounced for 3SL than 6SL, as well as assisted solubilities of the sialyllactoses in methanol upon addition of boronic monomer, indicates some form of interaction. This was further confirmed using ARS as guest, a diol known to readily form esters with boronic acids. In this case signal broadening was observed accompanied by a shoulder ca. 2 ppm downfield. This agrees with literature reports on the nature of the different boron species in solution. ARS has been shown to react mostly via the neutral trigonal form of boronic acids which feature a lower shift than the anionic tetrahedral form.37 Thus, possible equilibria of boron–diol interactions in methanol are shown in Fig. 3B.
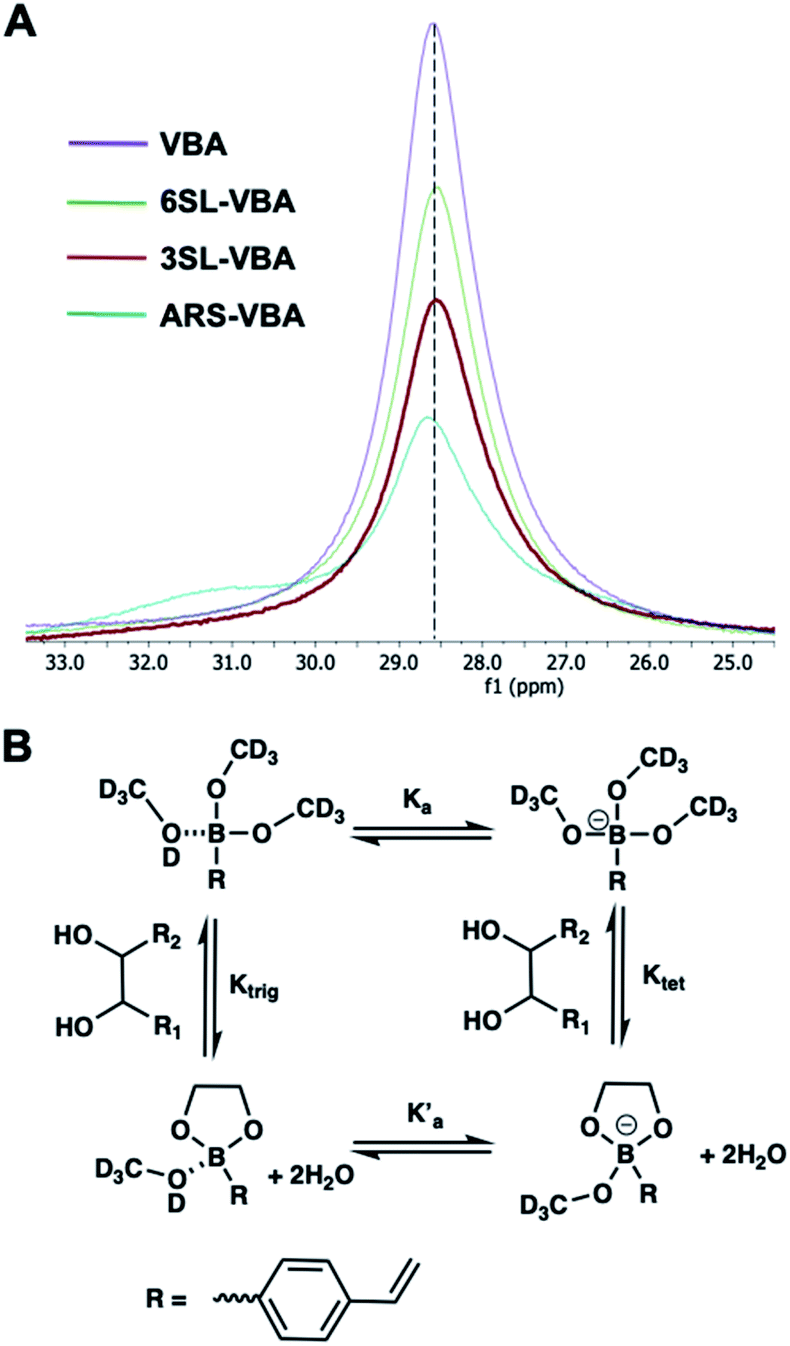 | ||
| Fig. 3 11B NMR spectra of VBA, 6SL–VBA, 3SL–VBA and ARS–VBA in CD3OD (A) with possible equilibria in solution (B). | ||
The spectra from 1H NMR show differences in the signals of free 3SL and 6SL saccharides and the SL–VBA complexes in CD3OD (Fig. 4). The region with lactose and H4–9 protons of Neu5Ac show additional signals upon addition of VBA. The change was most notable for 3SL isomer, displaying more pronounced changes especially at the anomeric carbon of Glc moiety. Comparison with the pre-formed complex of VBA with SL by azeotropic distillation in pyridine yielded similar changes in 1H NMR spectra as in the case of complex in methanol (Fig. S9–S11†).
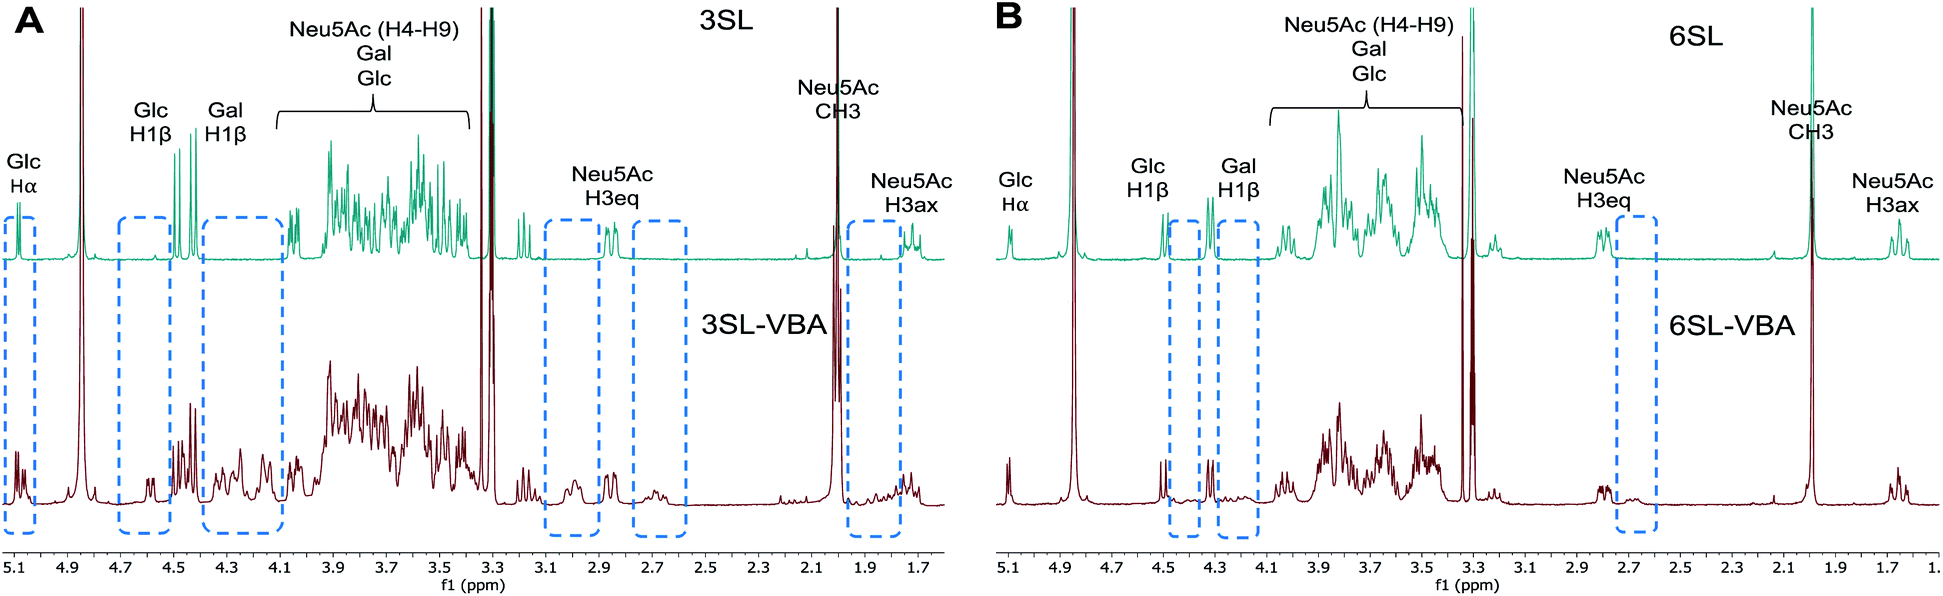 | ||
| Fig. 4 1H NMR spectra of 3SL (A) and 6SL (B) and corresponding spectra with the addition of 2 equivalents of VBA in CD3OD. Dashed frames show the additional signals upon reaction of SL with VBA. | ||
The stoichiometries of the ester formation between SL and VBA in methanol were studied by ESI-MS in positive mode. Fig. 5 shows spectra of 3SL and 6SL with major signals of the sodium adducts of the SL (m/z = 678.2), sialic acid (Neu5Ac, m/z = 336.1) and Lac (m/z = 365.2) fragments in addition to their boronate ester species. Presence of 1:1 (m/z = 790.3), 1:2 (m/z = 902.3) and to the lesser extent 1:3 (1014.3) stoichiometries were observed with the repeating unit of 112 (VBA–2H2O). Esterification on both SA and Lac units of the saccharides was detected with the corresponding m/z = 448.1 and 477.2. Collectively this strongly supports the formation of higher order boronate esters in the prepolymerization solution. The esterification is expected to be further favored under the prepolymerization conditions where the species are present at higher concentrations and temperatures.
 | ||
| Fig. 5 ESI-MS characterization of boronate ester formation between VBA and 3SL (A) and 6SL (B) in methanol with the ratio of SL:VBA = 1:3 The presence of 1:1 (m/z = 790.3), 1:2 (m/z = 902.3) and 1:3 (1014.3) saccharide–boronate esters is observed, as well as fragmentation of sialyllactose–boronate into Neu5Ac/VBA (m/z = 448.1) and Lac/VBA species (m/z = 477.2). | ||
MIP synthesis
Bis-imidazolium monomer 2Br was used to imprint 2,3′- and 2,6′-sialyllactose sodium salts in methanol with EGDMA as a crosslinker and VBA as a common functional monomer to obtain 3SL-MIP and 6SL-MIP. Methanol was chosen as a porogen mimicking the conditions for the application of MIPs in enrichment, where methanol is a typical solvent of choice. Matching porogen with the final binding conditions is advantageous for maintaining the optimal polymer chain conformation in the solvent where imprinting takes place. DMSO in this case is a less suitable solvent, based on the intended application of polymers in the enrichment applications. The stoichiometries were fixed to SL:2Br: VBA:EGDMA = 1:1:2:20. Nonimprinted polymers (NIP) were prepared identically to the imprinted polymers with the omission of the template addition. Template removal was performed by subjecting the polymer particles to a stepwise solvent extraction. As seen in Fig. 6A with a template recovery of 20% for 3SL-MIP and 30% for 6SL-MIP with a simple acidic extraction (AE), this treatment was not sufficient to achieve quantitative template removal. This agrees with other examples of covalent imprinting where template removal commonly requires harsh conditions.38 Moreover, the lower recovery of 3SL is in agreement with its stronger tendency to form higher order complexes. Comparing various treatments comprising Soxhlet extraction and cold/hot acidic extraction (25/50 °C) (data not shown), high energy microwave treatment (MAE) effectively boosted template recovery to ca. 80% for both isomers. Polymers were then characterized by scanning electron microscopy (SEM), FTIR, BET and elemental analysis. SEM revealed micron-sized particle fractions (10–30 μm) obtained after crushing and sieving of the polymer monoliths and template removal by solvent extraction (Fig. S12†). Meanwhile, the FTIR spectra and elemental analyses showed all characteristic bands and CHN compositions with no apparent difference between imprinted and nonimprinted polymers and positive Z-potential values supported the inclusion of bisimidazolium monomer (Fig. S13, Tables S1 and S2†). This contrasted with BET data, where NIP displayed higher surface area and porosity in comparison to SL-MIP materials (Table S2†). One possible explanation of porous and structural differences between two materials is the reduced solubility of growing polymer chains in the presence of template molecules, supported by observation of the earlier onset of turbidity in case of MIP. An earlier phase separation leads to larger pores‡ and lower surface area in agreement with our observations. In this case, NIP does not serve as a good control due to large differences in physical properties between MIP/NIP. Hence, the main focus here is to verify imprinting by studying selectivities of two different MIPs towards their templates.
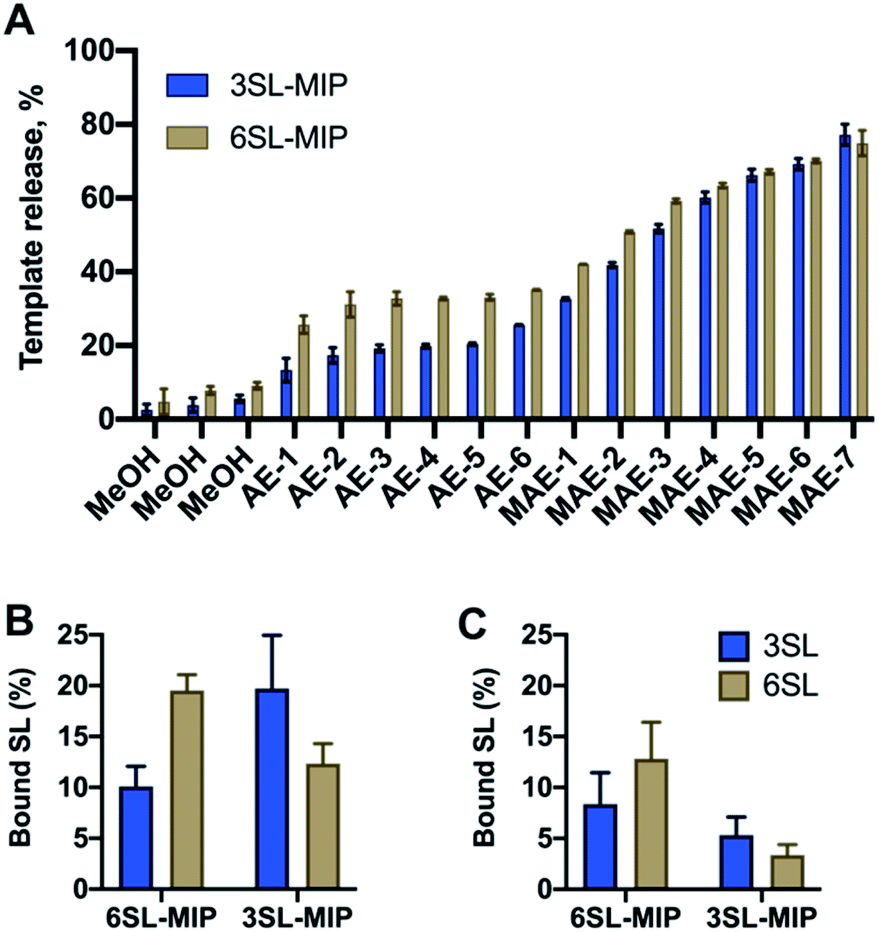 | ||
| Fig. 6 Template release profiles (A) of 3SL-MIP and 6SL-MIP with simple methanol wash (MeOH), acidic extraction (AE), microwave assisted extraction (MAE). Binding of 3SL and 6SL by of 6SL-MIP and 3SL-MIP from 0.125 mM equimolar mixture of 3SL/6SL in methanol (B) and water (C). | ||
Investigation of saccharide specificity
To evaluate the saccharide recognition properties of the materials, we assessed their ability to rebind their corresponding templates under static conditions. The polymers were incubated in 100% MeOH and 100% water followed by quantification of bound analyte by HPLC (Fig. 6B and C). The isomer selectivity was observed for 6SL-MIP and 3SL-MIP, displaying a strong preference for their templates 6SL or 3SL when exposed to the mixture of the saccharides. The target discrimination persisted in both organic and aqueous media, with a slight decrease in binding capacity in the latter case. It should be added that the non-imprinted polymer exhibited slightly higher binding capacity and some discrimination ability for the two saccharides based on the solvent system (Fig. S14A†). However, this likely correlates with the extent of nonspecific binding. MIP and NIP may feature entirely different structures and microenvironments due to differences in reactivity ratios and solubilities arising from variation of the counterion associated with charged monomers (vide supra).Fig. 7 shows the uptake of common mono-, di- and tri-saccharides by the 6SL-MIP and 3SL-MIP in phosphate buffer (PB, pH 7.4, 5 mM). The two polymers displayed contrasting binding behavior. Whereas the 6SL-MIP shows a pronounced binding preference for its corresponding template with an uptake clearly exceeding the 3′-isomer, the 3SL-MIP displayed as expected the reverse behavior. Moreover, the polymers showed a notable difference with respect to the binding of the reference sugars. Whereas Lac and Glc, both reducing sugars, expressed lower binding in both materials, GA, another sugar acid, behaved differently. This sugar bound effectively to the 6SL-MIP, while only ca. 5% was taken up by the 3SL-MIP. This reflects the presence of more discriminative sites on the 2,3′-imprinted material and is in agreement with the greater abundance of higher order monomer–template complexes in the case of 3SL. Overall, the results support the presence of templated sites capable of discriminating between structurally close regio-isomers of the tri-saccharide sialyllactose.
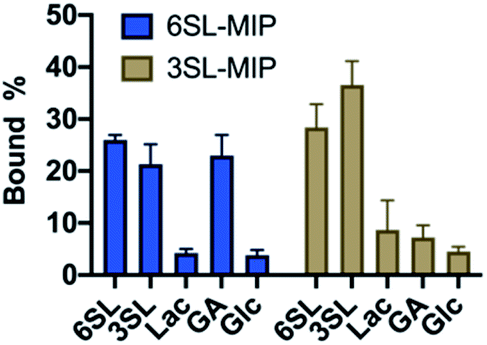 | ||
| Fig. 7 Equilibrium binding tests with various saccharides (0.25 mM) with 6SL-MIP and 3SL-MIP in PB (5 mM, pH 7.4). | ||
Another crucial aspect is the effect of the reducing end of the saccharide on the recognition properties. It is known that boronate affinity materials strongly rely on the reducing end of the saccharides to bind effectively. Thus, it is critical to verify the cross reactivity with non-reducing saccharides, that are mimicking the glycosidically linked SA on glycans and glycopeptides. 2-AB labeled saccharides are suitable analogs as model targets, having the additional advantage of being fluorescent and MS-compatible, hence improving the detection. Thus, the labelled SL were produced via reductive amination with the structures shown in Fig. 8A. Uptake of the SL–AB by MIPs in AmBic (pH = 8.0, 10 mM) depending on the amount of organic solvent modifier (MeOH) is presented in Fig. 8. Interestingly, the selectivity of the polymers was preserved despite the reducing end being blocked by the label molecule. The importance of the optimal configuration of 6SL is more noticeable for the 6SL-MIP, where the discrimination is now inferior to that of the 3SL-MIP. The latter displays a higher preference towards its template, indicating that labelling did not eliminate the selectivity. This effect could be attributed to different 3D configurations of the molecules in the solution with 3SL having a more rigid linear conformation opposed to a globular-like 6SL, translating into the imprinted cavity shape. Binding of 2AB labelled lactose was twofold lower in comparison to the sialylated version (Fig. S14A†), reflecting the major contribution of the anion in the molecular recognition. Nevertheless, this is a promising indicator of MIPs' applicability in the enrichment of more complex biological samples, such as glycans/glycopeptides and glycoproteins.
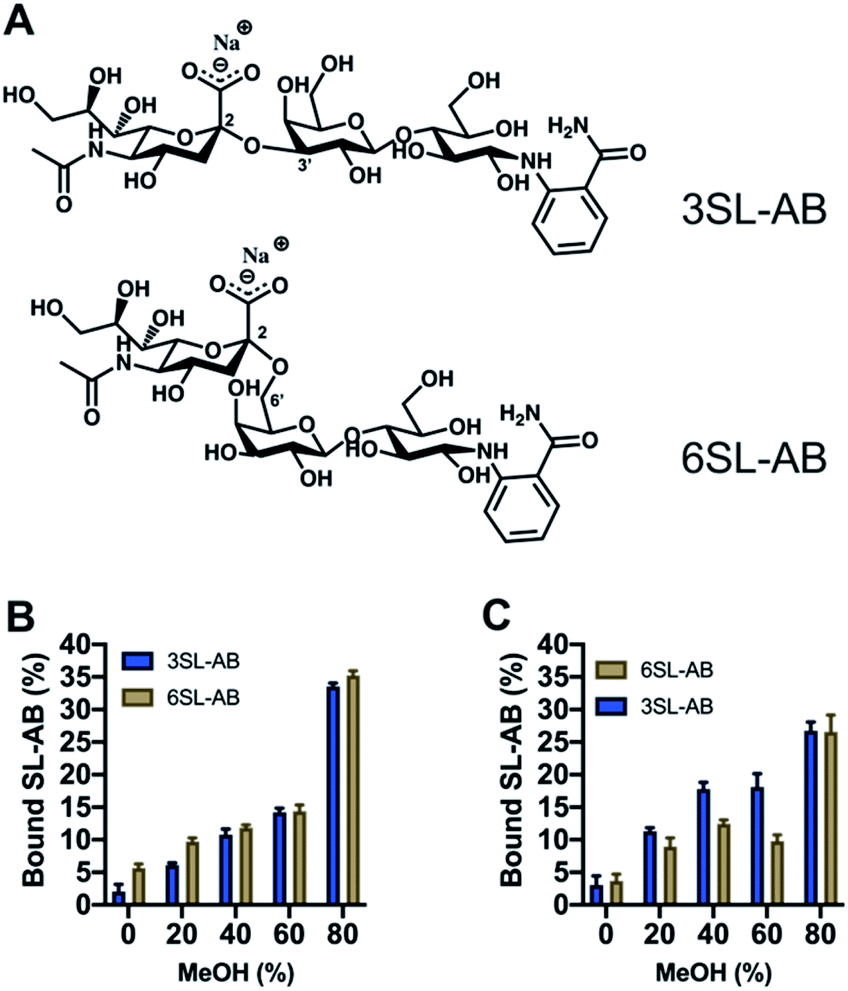 | ||
| Fig. 8 Structures of 2-AB labelled SL (A). Binding of equimolar mixture of SL–AB (15 μM each) in AmBic (pH 8.0, 10 mM) depending on the amount of methanol for 6SL-MIP (B) and 3SL-MIP (C). | ||
Investigation of glycoprotein/glycopeptide binding
Having proven the targeted binding specificity at the simple saccharide level we turned to glycoprotein targets. As a benchmark we used serum transferrins (Tf) as glycoproteins featuring different known expression of 2,3′- and 2,6′-linked SA (Fig. 9A). Human serum transferrin (Tf-H) contains predominantly a biantennary oligosaccharide with each antenna terminating in a 2,6′-linked Neu5Ac and lower amount of triantennary structures, containing additional 2,3′-linked Neu5Ac to Gal.39,40 Bovine serum transferrin (Tf-B) mainly exhibits biantennary N-glycans with one 2,6′-SA residue.41 Both Tf-H and Tf-B have similar isoelectric points, 5.35 and 5.25 respectively, as well as comparable molecular weights, approximately 75–82 kDa.42 Human serum albumin (HSA) was used as non-glycosylated standard43 and fetuin (Fet) as highly sialylated protein with complex glycan structure44 to further study binding patterns.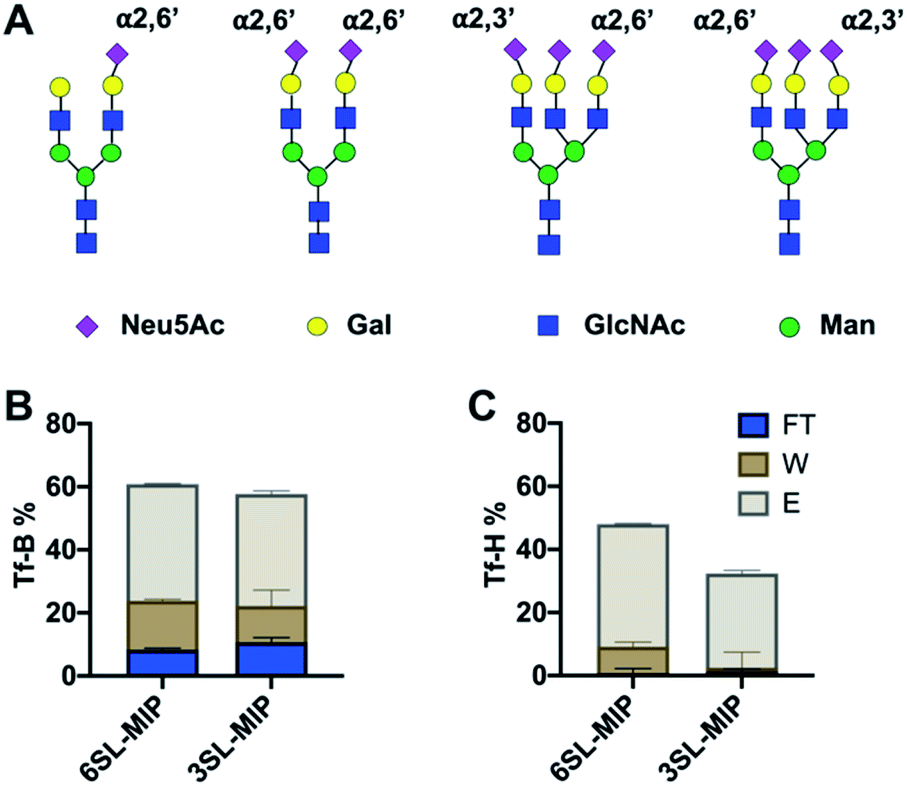 | ||
| Fig. 9 Major N-glycan structures of Tf-H and Tf-B (A). The amount of protein in flowthrough (FT), washing (W) and elution (E) fractions of Tf-B (B) and Tf-H (C) after binding with 6SL-MIP and 3SL-MIP. The protein binding was determined by BCA assay (total amount loaded was 10 μg). | ||
Optimal pH and buffer strength were first studied on 6SL-MIP (Fig. S15†). Increasing pH and lowering buffer strength led to higher protein binding, possibly reflecting to enhanced boronate–diol interactions and lowering the salt screening effect. The selectivity was then tested in protein binding experiments in AmBic (10 mM, pH 8.0), with loading (L), flowthrough (FT), washing (W) and elution (E) fractions analyzed by BCA assay and MALDI-TOF. The amount of Tf-B and Tf-H in the corresponding fractions are shown in Fig. 9B and C. The amount of protein was determined by BCA assay. MIPs bind glycoproteins strongly, with no significant breakthrough in the washing steps. Both MIPs seem to bind stronger to Tf-H over Tf-B possibly reflecting a multivalency effect: Tf-H is di- and tri-sialylated versus monosialylated Tf-B. In agreement with the expected presence of 2,3′-linked sugars in Tf-H, the 3SL-MIP retains this protein more strongly than the 6SL-MIP. Only ∼30% was recovered in total from the 3SL-MIP in contrast to ∼50% when using the 6SL-MIP. Hence, the remaining protein was stuck on the polymer. In contrast, recovery of Tf-B was higher and independent on the MIP. The results from quantification by the BCA assay correlated with MALDI experiments (Fig. S16†). Here all polymers also displayed low affinity towards HSA, a non-glycosylated protein, and high affinities towards fetuin, a highly glycosylated protein. Analysis of binding patterns at the glycopeptide level might reveal more detailed insight into polymer selectivity. The tryptic digests of Tf-H and Tf-B were incubated with polymers in 80–20 v% MeOH–AmBic, followed by washing with the loading solvent and elution with 2% formic acid. The loading and elution fractions were analyzed by MALDI (Fig. S17 and S18†). Enrichment of glycopeptides is indicated by the numerous signals found at high m/z,28,45 possibly accompanied by additional hydrophilic peptides. Precise structural assignments will be reported in a forthcoming publication.
Conclusions
We were able to produce linkage specific sialic acid binders after careful adjustment and screening of functional monomers and polymer processing conditions. A cationic bis-imidazolium monomer was used to produce glycan specific MIPs, validated by glycan and glycoprotein binding experiments. The MIPs are compatible with aqueous environment, displaying selectivities towards imprinted glycan isomers. The water-compatibility of this material is advantageous for further applications as lectin substitutes in applications such as glycoprotein enrichment and cell staining. Moreover, the compatibility with hydroorganic solvent systems matches those applied in LC-MS based glycomics studies. Current work aims to further enhance the glycan selectivity while suppressing nonspecific binding effects.Conflicts of interest
There are no conflicts to declare.Acknowledgements
We acknowledge financial support from the Marie Skłodowska-Curie Actions (H2020-MSCA-ITN-2016, 722171—Biocapture) and the Swedish Knowledge Foundation (KK-Prospekt 20170040). The authors are grateful to Dr Peter Falkman (Malmö University) for SEM measurements.Notes and references
- X. Chen and A. Varki, ACS Chem. Biol., 2010, 5, 163–176 CrossRef CAS PubMed.
- J. R. Brown, M. M. Fuster, R. Li, N. Varki, C. A. Glass and J. D. Esko, Clin. Cancer Res., 2006, 12, 2894–2901 CrossRef CAS PubMed.
- M. M. Fuster and J. D. Esko, Nat. Rev. Cancer, 2005, 5, 526–542 CrossRef CAS PubMed.
- M. Krishna and A. Varki, J. Exp. Med., 1997, 185, 1997–2013 CrossRef CAS PubMed.
- V. Padler-Karavani, N. Hurtado-Ziola, M. Pu, H. Yu, S. Huang, S. Muthana, H. A. Chokhawala, H. Cao, P. Secrest, D. Friedmann-Morvinski, O. Singer, D. Ghaderi, I. M. Verma, Y. T. Liu, K. Messer, X. Chen, A. Varki and R. Schwab, Cancer Res., 2011, 71, 3352–3363 CrossRef CAS PubMed.
- W. R. Alley, Jr and M. V. Novotny, J. Proteome Res., 2010, 9, 3062–3072 CrossRef PubMed.
- O. M. Pearce, H. Laubli, A. Verhagen, P. Secrest, J. Zhang, N. M. Varki, P. R. Crocker, J. D. Bui and A. Varki, Proc. Natl. Acad. Sci. U. S. A., 2014, 111, 5998–6003 CrossRef CAS PubMed.
- M. Hedlund, E. Ng, A. Varki and N. M. Varki, Cancer Res., 2008, 68, 388–394 CrossRef CAS PubMed.
- R. Chammas, J. L. Sonnenburg, N. E. Watson, T. Tai, M. G. Farquhar, N. M. Varki and A. Varki, Cancer Res., 1999, 59, 1337–1346 CAS.
- L. R. Loureiro, M. A. Carrascal, A. Barbas, J. S. Ramalho, C. Novo, P. Delannoy and P. A. Videira, Biomolecules, 2015, 5, 1783–1809 CrossRef CAS PubMed.
- C. Ohyama, M. Hosono, K. Nitta, M. Oh-eda, K. Yoshikawa, T. Habuchi, Y. Arai and M. Fukuda, Glycobiology, 2004, 14, 671–679 CrossRef CAS PubMed.
- R. D. Cummings, A. G. Darvill, M. E. Etzler and M. G. Hahn, in Essentials of Glycobiology, ed. A. Varki, R. D. Cummings, J. D. Esko, P. Stanley, G. W. Hart, M. Aebi, A. G. Darvill, T. Kinoshita, N. H. Packer, J. H. Prestegard, R. L. Schnaar and P. H. Seeberger, Cold Spring Harbor, (NY), 2015, pp. 611–625, DOI:10.1101/glycobiology.3e.048.
- N. Shibuya, I. J. Goldstein, W. F. Broekaert, M. Nsimbalubaki, B. Peeters and W. J. Peumans, J. Biol. Chem., 1987, 262, 1596–1601 CrossRef CAS.
- W. C. Wang and R. D. Cummings, J. Biol. Chem., 1988, 263, 4576–4585 CrossRef CAS.
- G. Wulff and S. Schauhoff, J. Org. Chem., 1991, 56, 395–400 CrossRef CAS.
- H. R. Rajabi and A. Zarezadeh, J. Mater. Sci.: Mater. Electron., 2016, 27, 10911–10920 CrossRef CAS.
- R. W. Gunasekara and Y. Zhao, J. Am. Chem. Soc., 2017, 139, 829–835 CrossRef CAS PubMed.
- A. Kugimiya, T. Takeuchi, J. Matsuib, K. Ikebukuro, K. Yano and I. Karube, Anal. Lett., 1996, 29, 1099–1107 CrossRef CAS.
- S. Wang, D. Yin, W. Wang, X. Shen, J.-J. Zhu, H.-Y. Chen and Z. Liu, Sci. Rep., 2016, 6, 22757 CrossRef CAS PubMed.
- M. Panagiotopoulou, S. Kunath, P. X. Medina-Rangel, K. Haupt and B. Tse Sum Bui, Biosens. Bioelectron., 2017, 88, 85–93 CrossRef CAS PubMed.
- S. Shinde, Z. El-Schich, A. Malakpour, W. Wan, N. Dizeyi, R. Mohammadi, K. Rurack, A. Gjörloff Wingren and B. Sellergren, J. Am. Chem. Soc., 2015, 137, 13908–13912 CrossRef CAS PubMed.
- Z. Xu, S. K. Kim and J. Yoon, Chem. Soc. Rev., 2010, 39, 1457–1466 RSC.
- J. J. Fang, G. C. Qin, J. Ma and Y. M. She, J. Chromatogr. A, 2015, 1414, 122–128 CrossRef CAS PubMed.
- S. Ambrosini, M. Serra, S. Shinde, B. Sellergren and E. De Lorenzi, J. Chromatogr. A, 2011, 1218, 6961–6969 CrossRef CAS PubMed.
- P. Narayanaswamy, S. Shinde, R. Sulc, R. Kraut, G. Staples, C. H. Thiam, R. Grimm, B. Sellergren, F. Torta and M. R. Wenk, Anal. Chem., 2014, 86, 3043–3047 CrossRef CAS PubMed.
- R. Sulc, G. Szekely, S. Shinde, C. Wierzbicka, F. Vilela, D. Bauer and B. Sellergren, Sci. Rep., 2017, 7, 44299 CrossRef CAS PubMed.
- T. Masuko, A. Minami, N. Iwasaki, T. Majima, S. Nishimura and Y. C. Lee, Anal. Biochem., 2005, 339, 69–72 CrossRef CAS PubMed.
- M. H. Selman, M. Hemayatkar, A. M. Deelder and M. Wuhrer, Anal. Chem., 2011, 83, 2492–2499 CrossRef CAS PubMed.
- C. Wierzbicka, M. Liu, D. Bauer, K. Irgum and B. Sellergren, J. Mater. Chem. B, 2017, 5, 953–960 RSC.
- F. Ulatowski, K. Dabrowa, T. Balakier and J. Jurczak, J. Org. Chem., 2016, 81, 1746–1756 CrossRef CAS PubMed.
- X. Su, K. Luo, Q. Xiang, J. Lan and R. Xie, Chirality, 2009, 21, 539–546 CrossRef CAS PubMed.
- S. Shinde, M. Mansour, A. Incel, L. Mavliutova, C. Wierzbicka and B. Sellergren, Chem. Sci., 2020, 11, 4246–4250 RSC.
- H. Otsuka, E. Uchimura, H. Koshino, T. Okano and K. Kataoka, J. Am. Chem. Soc., 2003, 125, 3493–3502 CrossRef CAS PubMed.
- B. E. Collins, P. Metola and E. V. Anslyn, Supramol. Chem., 2013, 25, 79–86 CrossRef CAS PubMed.
- L. Zhu, S. H. Shabbir, M. Gray, V. M. Lynch, S. Sorey and E. V. Anslyn, J. Am. Chem. Soc., 2006, 128, 1222–1232 CrossRef CAS PubMed.
- B. M. Chapin, P. Metola, V. M. Lynch, J. F. Stanton, T. D. James and E. V. Anslyn, J. Org. Chem., 2016, 81, 8319–8330 CrossRef CAS PubMed.
- J. W. Tomsho and S. J. Benkovic, J. Org. Chem., 2012, 77, 2098–2106 CrossRef CAS PubMed.
- A. Ellwanger, C. Berggren, S. Bayoudh, C. Crecenzi, L. Karlsson, P. K. Owens, K. Ensing, P. Cormack, D. Sherrington and B. Sellergren, Analyst, 2001, 126, 784–792 RSC.
- J. S. Rohrer and N. Avdalovic, Protein Expression Purif., 1996, 7, 39–44 CrossRef CAS PubMed.
- J. Charlwood, H. Birrell, D. Tolson and P. Camilleri, Anal. Chem., 1998, 70, 2530–2535 CrossRef CAS PubMed.
- G. Spik, B. Coddeville and J. Montreuil, Biochimie, 1988, 70, 1459–1469 CrossRef CAS.
- S. Welch, Comp. Biochem. Physiol., Part B: Biochem. Mol. Biol., 1990, 97, 417–427 CrossRef CAS.
- R. J. Peach and S. O. Brennan, Biochim. Biophys. Acta, Mol. Basis Dis., 1991, 1097, 49–54 CrossRef CAS.
- E. D. Green, G. Adelt, J. U. Baenziger, S. Wilson and H. Van Halbeek, J. Biol. Chem., 1988, 263, 18253–18268 CrossRef CAS.
- M. H. Selman, M. Hoffmann, G. Zauner, L. A. McDonnell, C. I. Balog, E. Rapp, A. M. Deelder and M. Wuhrer, Proteomics, 2012, 12, 1337–1348 CrossRef CAS PubMed.
Footnotes |
| † Electronic supplementary information (ESI) available: 1H NMR CIS titration curves, Jobs plots, complex spectra; SEM, FTIR for polymers; MALDI-TOF of glycoproteins and glycopeptides; polymer characterization. See DOI: 10.1039/d1ra02274a |
| ‡ Pores exceeding 100 nm are not revealed by nitrogen sorption experiments. |
| This journal is © The Royal Society of Chemistry 2021 |