 Open Access Article
Triggering gold nanoparticles formation on a quartz surface by nanosecond pulsed laser irradiation†
P. A. Mercadal a,
S. D. García Schejtman
 ab,
F. P. Comettoa,
A. V. Veglia
 b and
E. A. Coronado
 *a
*a
aINFIQC-UNC-CONICET, Departamento de Fisicoquímica, Argentina Departamento de Físico-Química, Facultad de Ciencias Químicas, UNC, Universidad Nacional de Córdoba, Córdoba, Argentina. E-mail: coronado@fcq.unc.edu.ar
bINFIQC-UNC-CONICET, Departamento de Química Orgánica, Facultad de Ciencias Químicas, UNC, Argentina
First published on 24th June 2021
Abstract
A new direct and straightforward method is proposed to synthesize bare Au nanoparticles (Au NPs) on a quartz surface by nanosecond 532 nm pulsed laser irradiation of a quartz surface in contact with Au(III) precursor solution. The characterisation by XPS, UV-Vis, SEM and AFM measurements demonstrate the formation of bare Au NPs anchored on the quartz surface with a mean height of 27 ± 10 nm localized in the laser irradiation area. The main features of this approach are their simplicity, quick fabrication and the large surface area covered by Au NPs. The absence of ligands/stabilizing agents on the Au NPs makes this substrate very suitable for its direct surface modification opening the range of applications in biology, medicine, sensing, catalysis, among others. As a proof of concept, the capabilities and advantages of this substrate as Surface Enhanced Raman Spectroscopy (SERS) platform were tested demonstrating the absence of any Raman signal overlapping with the analyte in the whole spectral range.
Introduction
The current research on the field of nanoscience allows amazing advances in nanofabrication techniques, giving novel nanomaterials with attractive functional properties.1,2 In particular, noble metal nanoparticles (MNPs) have been used to develop a vast number of nanodevices with multiple applications such as sensors, catalysts, drug delivery and photothermal therapy.3–5 Currently, there are several methods to obtain MNPs-based nanoplatforms from top-down to bottom-up techniques including the combination of both. One of the main challenges of nanomaterials fabrication lies in developing low-cost and simple processes.6In the field of chemical sensing, the SERS technique is a popular and powerful tool for the detection of molecules through the enhancement of the Raman signals of the analytes close to the MNP surface.7,8 Although several methods have been developed for the obtention of cost-effective SERS substrates,9–11 the fabrication of MNPs-based SERS-substrates remains a subject of current interest.12–14
Surface-supported MNPs can be prepared using top-down approaches such as lithography, optical, electron beam, soft, nanoimprint and polymer lithography, among others; obtaining highly ordered nanoparticle arrays.6,15,16 However, these techniques are not quite simple to be implemented and involve several steps. Bottom-up nanofabrication approaches are another kind of useful and powerful tools for developing multifunctional and nanostructural materials and devices by the self-assembly of atoms or molecules.17,18 In particular, a widely employed bottom-up methodology to prepare SERS substrates is the chemical immobilization of MNPs on quartz or glass surfaces. This method requires a previous modification of the solid surface in order to anchor MNPs. This modification usually involves a silanization process with different functionalized organosilane compounds with affinity for the MNPs surface.17 Furthermore, quite often the MNPs to be anchored to the surface substrate are stabilized with a surfactant or modified with surface ligands (for example, citrate in Turkevich's synthesis).19 In this sense, Jie Cao et al. propose the synthesis of Ag nanoparticles on the silanized surface of a fibber taper from the laser reduction of a AgNO3 solution mixed with trisodium citrate.20 One important drawback of these methods is the possibility that the molecules used for the self-assembly process could have a SERS spectrum that overlaps with the SERS spectrum of the analyte. In order to improve the spectral overlap, bare nanoparticle substrates have been designed by laser ablation of a given massive metal (i.e., silver or gold).21,22 However, so far there are no reports of a one-pot synthesis of nanoparticles anchored to a quartz surface without its prior functionalization and via laser irradiation of a solution that contains the metallic precursors (AgNO3 or HAuCl4) in contact with a surface.
In view of these shortcomings, the development of methods or techniques for the fabrication of SERS substrates that surmounts the limitations outlined above is still a priority.
Herein, we introduce a fast and straightforward one-step top-down method for synthesizing bare Au NPs on a quartz surface (Au NPs_Q) by 532 nm nanosecond pulsed laser irradiation of a HAuCl4 solution in contact with a quartz surface. The Au NPs_Q demonstrate to be quite appropriate for the clean SERS detection of any analyte due to the absence of substrate Raman signals. This feature was tested using Rhodamine 6G as a SERS molecular probe.
Materials and methods
Materials
HAuCl4·3H2O (Sigma Aldrich); hydrochloric acid 36.5–38% (Cicarelli); nitric acid 65% (Biopack); ethanol 70% (Cicarelli); quartz surface with 5 cm long × 1 cm width; 5 mL glass vessel with a mouth diameter of 1 cm.Preparation of the quartz surface before laser irradiation
Firstly, the quartz surface was incubated in aqua regia for 30 minutes and then rinsed with Milli-Q water. Secondly, it was incubated for 30 minutes in ethanol (70%) and then rinsed several times with the same solvent. Finally, it was rinsed 5 times with Milli-Q water and dried at room temperature.UV-vis spectroscopy
The optical characterisation of the Au NPs_Q substrate was performed using a Shimazdu UV-1700 PharmaSpec spectrophotometer.Laser experiments
The fabrication of the Au NPs_Q was performed using a LaserVision Continuum OPO-OPA IR/Surelite EX laser and a reflective prism with a light deflection angle of a 90°. In all experiment the frequency of the laser was 10 pulses (6 ns per pulse) per second (10 Hz). The spot laser area was measured using burn paper.XPS measurements
A commercial Thermo Scientific K-Alpha X-ray photoelectron spectrometer (XPS) system (LAMARX, FaMAF-UNC), equipped with a hemispherical energy analyser and a monochromated X-ray source was used for surveying the photoemission spectra. The base pressure measured in the main chamber was in the low 10−9 mbar range. The photoionization of the samples was induced by monochromatized Al Kα photons at 1486 eV. All the spectra were adjusted to the main spurious C 1s peak at 284.8 eV. To avoid any charging effects during measurement (typically observed in semiconductor-isolated systems), a flood gun to compensate the charge was used. The overcompensation effects by adjusting the spectra during measurement were also tested.Atomic force microscopy
The AFM experiments were performed using an Agilent Technology, 5500 Scanning Probe Microscope. The measurements were carried out in acoustic mode at room temperature using standard Si3N4 cantilever with a resonant frequency of 145–230 kHz. 5 × 5 μm – pixel resolution. The AFM images were collected at a scanning rate of 0.3 line per s.Scanning electron microscopy
The surface morphology of the AuNPs_Q substrate was analysed by scanning electron microscopy (SEM) using a SEM Carl Zeiss Sigma equipment with EDS (OXFORD-AZTEC XMAX 80) (LAMARX, FaMAF-UNC). The sample was used as was receipted, without any drying or sputter-coating process. SEM images were acquired at magnifications between 7000–30![[thin space (1/6-em)]](https://www.rsc.org/images/entities/char_2009.gif) 000× or a width of the image field between 3–16 μm.
000× or a width of the image field between 3–16 μm.
Raman and SERS spectroscopy
All experiments were performed at room temperature with a LabRaman confocal microscope using a 632.8 nm excitation wavelength (laser line from He–Ne). SERS measurements were carried out with a 100× (NA = 0.9) objective in the backscattering geometry while for conventional Raman measurements a 10× (NA = 0.25) objective was used. For all the assays, we used a 600 lines per mm grating giving a resolution of 4 cm−1 and the spectra accumulation time was 30 s. The standard Si reference pattern was used for the calibration.SERS substrate enhancement factor (SSEF) calculation
The number of R6G molecules in the laser scattering volume for the conventional Raman experiment (NRM) was determined using the scattering laser volume calculated as V = π[(λ/NA)/2]2(πλ/2NA2) where, NA is the numeric aperture of the 10× objective (NA = 0.25) and λ is the excitation wavelength (in this case, 632.8 nm).23,24 Under the experimental condition employed (1 mM R6G) and the calculated V (8 × 10⁻¹¹ cm3) a value of NRM = 4.8 × 10⁷ R6G molecules was obtained. The calculation of the number of R6G molecules in the laser scattering volume for the SERS experiment (NSR) was determined using the surface area (A) of the laser beam A = π[(λ/NA)/2]2 together with the average number of Au NPs per μm2 estimated from the AFM images. For these experiments, A = 0.38 μm2 (NA = 0.9 corresponding to 100× objective) and an average number of 15 Au NPs in the laser surface area was calculated. Finally, NSR was found to be 2 × 10⁴ R6G molecules, assuming that the entire surface of each Au NP (taken as 27 nm diameter spheres obtained from the average AFM height profile) is covered by R6G (AR6G = 1.76 × 10⁻⁶ μm2).Results and discussion
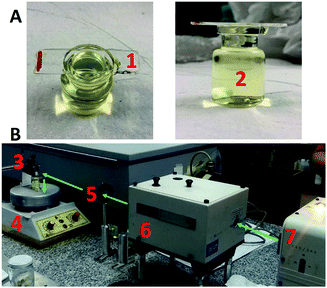
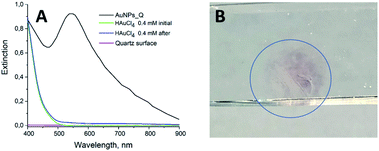
The experimental setup for the synthesis of the Au NPs_Q is sketched in Fig. 1 (see Materials and methods section for the instrument details). A quartz surface was placed on a glass vessel containing a 0.4 mM HAuCl4 solution, in such a way that the HAuCl4 solution completely wets the quartz surface (Fig. 1A). Both quartz surface and gold solution (under magnetic stirring) were vertically irradiated with a λ = 532 nm pulsed laser (Fig. 1B).The extinction spectra of the HAuCl4 solution (without the quartz surface) before (green line) and after (blue line) laser pulse irradiations are depicted in Fig. 2A (3000 laser pulses, laser fluence (F) = 510.2 mJ cm−2 and 10 Hz laser pulse frequency). The absence of an extinction peak around λ = 500–600 nm after the irradiation of the HAuCl4 solution indicates the non-formation of a colloidal suspension of Au NPs. The same result is also obtained if the HAuCl4 solution (without the quartz surface) is irradiated using another set of laser irradiation conditions (see Fig. S1†). Quite remarkable, after the irradiation of the quartz surface in contact with the HAuCl4 solution (by the arrangement shown in Fig. 1), the extinction spectrum of the quartz surface depicts the characteristic Localized Surface Plasmon Resonance (LSPR) of Au NPs with a peak intensity located at λ = 543 nm (Fig. 2A, black line). This result indicates the formation of the Au NPs on the quartz surface. Note that, the quartz surface extinction spectrum before irradiation does not present any spectral band (Fig. 2A, pink line). Importantly, the quartz surface occupies the entire area of the mouth of the vessel containing the gold solution (Fig. 1A). However, regardless of the contact area of the surface with the gold solution, in Fig. 2B it can be appreciated that the formation of Au NPs on the quartz surface is limited to the regions where the laser beam impinges (appreciated with the naked eye as a red colour circle on the quartz surface).
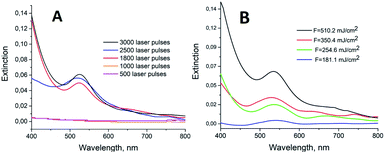
The role played by the laser irradiation conditions on the fabrication of the Au NPs_Q was investigated performing experiments at different F values and number of pulses (Fig. 3). The maximum extinction intensity was obtained with 3000 laser pulses (10 Hz) and F = 510.20 mJ cm−2. Accordingly, these experimental conditions were chosen to perform the XPS, AFM and SERS characterisations. Fig. 3A shows that between 1000 and 1800 pulses (F = 510.20 mJ cm−2) the 543 nm peak increases abruptly due to an increment in the amount of gold nanoparticles on the surface (the same trend was observed by XPS measurements, Fig. S2†).
A feature to be remarked is that the Au NPs_Q is stable under different mechanical treatments (rinsing, incubation and sonication) with a negligible change of the extinction intensity (Fig. S3†), demonstrating that the Au NPs are anchored strong enough to the quartz surface to resist all the treatments detailed above making this substrate suitable to be handled in a conventional way for subsequent experiments.
The XPS survey spectrum and the O 1s, Si 2p and Au 4f spectra of a Au NPs_Q sample are shown in Fig. 4. From the survey spectrum, it can be noticed that the elements found on the surface are only spurious C, Si, O, and Au. The Au 4f spectrum shows two main peaks located at 83.9 eV and 87.7 eV, respectively, assigned to Au 4f7/2 and Au 4f5/2 signals. The binding energy of this pair of peaks is attributed to the presence of metallic gold (Au (0)) atoms forming Au NPs. Considering that the precursors on the synthesis of Au NPs_Q are Au(III) ions (and intermediate Au(I) ions), the presence of these ionic species adsorbed on the quartz surface could be expected. Nevertheless, these ionic adsorbed species should be detected at higher binding energies 85.6–89.1 eV and 87.3–90.4 eV for Au(I) and Au(III) species, respectively. The absence of these peaks (and the absence of chlorides, as shown in the XPS survey, Fig. 4) indicates that the only species adsorbed on the quartz surface is metallic Au. Regarding the Si species identified on the surface, ∼90% of the signal could be assigned to SiO2 (Si 2p doublet located at 103.3 eV, typically observed on pure quartz surfaces, Fig. 4). Accordingly, the only O 1s peak belongs to SiO2 (at 532.6 eV), as shown in Fig. 4. Interestingly, another Si 2p doublet was detected at lower binding energies (at 100.5 eV). This doublet is attributed to the presence of reduced silicon species (Sir) that could be intermediates for Au(0) formation from Au(III) during pulsed laser irradiation.25
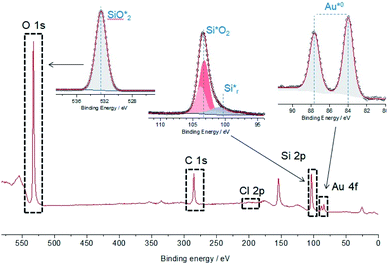 | ||
| Fig. 4 XPS survey spectrum and O 1s, Si 2p and Au 4f core levels showing the presence of metallic Au on the surface. | ||
The experimental results presented in this work show the formation, after laser irradiation, of Au NPs on the quartz surface. First, it is important to consider that evidence of Au(III) ions absorption on silicate surfaces has been reported in previous works.26 For example, Wojtaszek et al.27,28 have investigated the mechanism of gold chloride adsorption on silica supports, founding that the HAuCl4 adsorption on the silica surface occurs through H-bond complexes by the interaction between the Au–Cl bond of the gold complex and Si–OH groups on the surface of silica. Furthermore, Mohammadnejad et al.29,30 have studied the adsorption of gold chlorides onto different types of silicates, founding that the amount of adsorbed gold was related to the type of silicate, the surface area and the pH of the solution. The XPS measurements performed in the present work show the presence of Au ions and chlorides on the quartz surface outside the laser spot irradiation, indicating the adsorption of HAuCl4 on silicate surface from the solution (see Fig. S4†). Note that, the number of chlorides adsorbed inside the region of the laser spot is almost negligible, indicating the formation of naked Au NPs.
Although the quartz surface is very unreactive, the surface defect sites are the main cause of the reactivity on silicates.31–38 These defects can be created by different methodologies (mechanical action, irradiation, among others). For example, Deventer et al.25 obtained surface defects by mechano-chemical activation (grinding) on different silicates, and they proposed a mechanism for adsorption and reduction of gold chloride to metallic gold, on the defect sites on silicate surface. When reactive sites are created, covalent bonds such as ![[triple bond, length as m-dash]](https://www.rsc.org/images/entities/char_e002.gif) Si–OH are broken, giving free radicals or ions.31,32,34,35,39 These reactive species (
Si–OH are broken, giving free radicals or ions.31,32,34,35,39 These reactive species (![[triple bond, length as m-dash]](https://www.rsc.org/images/entities/char_e002.gif) Si˙ and
Si˙ and ![[triple bond, length as m-dash]](https://www.rsc.org/images/entities/char_e002.gif) Si–O˙ radicals for homolytic cleavage, and
Si–O˙ radicals for homolytic cleavage, and ![[triple bond, length as m-dash]](https://www.rsc.org/images/entities/char_e002.gif) Si+ and
Si+ and ![[triple bond, length as m-dash]](https://www.rsc.org/images/entities/char_e002.gif) Si–O− ions for heterolytic cleavage) could re-form siloxane
Si–O− ions for heterolytic cleavage) could re-form siloxane ![[triple bond, length as m-dash]](https://www.rsc.org/images/entities/char_e002.gif) Si–O–Si
Si–O–Si![[triple bond, length as m-dash]](https://www.rsc.org/images/entities/char_e002.gif) units or well react with other surroundings atoms or molecules, even with water.40,41 In this sense, the generation of OH˙ or H˙ radicals species from the moisture of the quartz surface on the solution can reduce the adsorbed Au(III) ions. Importantly, the hydroxyl radicals were also identified as the reducing agent in a study of reduction of HAuCl4 on silica.25,42 Therefore, it could be considered that AuNPs are formed by the reduction of Au(III) in the presence of
units or well react with other surroundings atoms or molecules, even with water.40,41 In this sense, the generation of OH˙ or H˙ radicals species from the moisture of the quartz surface on the solution can reduce the adsorbed Au(III) ions. Importantly, the hydroxyl radicals were also identified as the reducing agent in a study of reduction of HAuCl4 on silica.25,42 Therefore, it could be considered that AuNPs are formed by the reduction of Au(III) in the presence of ![[triple bond, length as m-dash]](https://www.rsc.org/images/entities/char_e002.gif) Si–O˙ as well as OH˙ or H˙ radicals, among others reactive species.
Si–O˙ as well as OH˙ or H˙ radicals, among others reactive species.
From this basis, and consistent with the experimental results present above, the mechanism of formation of AuNPs on the quartz surface could be explained as reduction of adsorbed Au(III) ions with reactive species such as ![[triple bond, length as m-dash]](https://www.rsc.org/images/entities/char_e002.gif) Si–O˙, HO˙ or H˙, that were generated by pulsed laser irradiation.
Si–O˙, HO˙ or H˙, that were generated by pulsed laser irradiation.
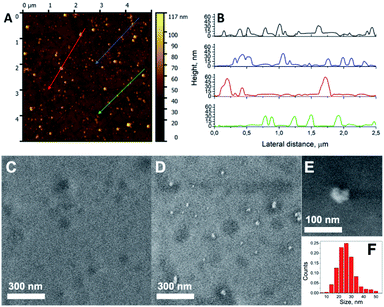
The topology of the surface was characterised by AFM measurements. A representative AFM image of the Au NPs_Q (Fig. 5A) supports the presence of Au NPs on the quartz surface. Fig. 5B shows the height profiles of Au NPs obtained in the regions highlighted with different colours in Fig. 5A. The statistical analysis of the Au NPs gives an average height of 27 ± 10 nm. Also, based on the statistical analysis of AFM, we have calculated the density of Au NPs deposited on the quartz surface. The density of Au NPs was 40 ± 6 Au NPs per μm2 demonstrating the relative homogenous distribution of Au NPs per μm2 obtained by the present pulsed laser irradiation approach. The morphological characterization of the AuNPs_Q substrate performed by SEM outside and inside the laser irradiation area (Fig. 5C and D, respectively) indicates the presence of Au NPs only on the laser spot region. Moreover, the formation of spherical Au NPs (Fig. 5E) was also observed, with a size distribution shown in Fig. 5F (mean diameter = 26 ± 7 nm). The density of Au NPs calculated by SEM was 37 ± 6 NPs per μm2 quite consistent with the AFM results.
The capabilities of the Au NPs_Q to be used as a clean SERS substrate were tested performing a series of different experiments. The Raman spectra of the quartz surface wetting the Au(III) solution before (black line) and after (red line) pulsed laser irradiation (Fig. 6) show the same Raman modes corresponding to the quartz surface at 491, 605 and 797 cm−1. The Raman modes at 605 and 491 cm−1 were assigned to oxygen-breathing associated with 3-membered and 4-membered SiO4 rings, respectively. The Raman mode at 797 cm−1 corresponds to the Si–O–Si bending/deformation mode.43 Importantly, after Au NPs formation there is a wide spectral range between 800 and 3000 cm−1 without any Raman mode. This feature is quite significant since it demonstrates that this new Au NPs_Q substrate should not give rise to any Raman signal overlapping with most organic and inorganic molecules whose main spectral signatures are within this spectral range.
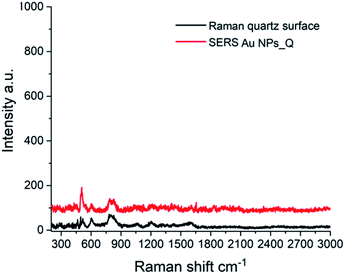 | ||
| Fig. 6 Raman spectrum of the quartz surface before laser irradiation (black line) and SERS spectrum of the Au NPs_Q (red line). | ||
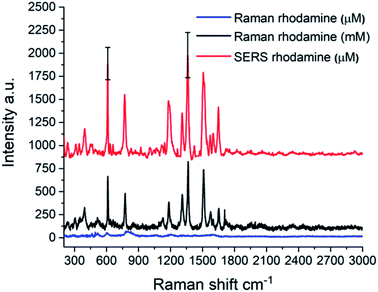
As a proof of concept, the capability of Au NPs_Q to enhance the Rhodamine 6G Raman signal was tested. Fig. 7 shows the conventional Raman spectrum of 1 mM (black line), R6G solutions and the SERS spectrum of the R6G molecule on the Au NPs_Q platform (red line).
To obtain the SERS spectrum the Au NPs_Q was incubated in a 1 μM R6G solution for 12 h and then dried for 10 h at room temperature. Note that in the conventional Raman spectrum of 1 μM R6G solution (Fig. 7, blue line) any Raman signal could be appreciated demonstrating that the Au NPs_Q is capable to enhance the Raman signal.
Importantly, there is an almost perfect agreement between the SERS R6G vibrational modes with the conventional Raman modes obtained in 1 mM R6G spectrum. This fact highlights the most important feature of the Au NPs_Q substrate which is the absence of any Raman signal interference in this kind of SERS platform. Some representative examples of the presence of interferent in SERS substrate can be observed in the synthesis of Au nanorods and nanostars,44,45 cellulose in paper-based substrates,46,47 carbon supported NPs,48 among others.49,50
The SERS spectra in Fig. 7 (red line) is the average over 15 SERS spectra recorded in the different regions of the Au NPs_Q shown in Fig. S5.† The strong Raman modes located at 612 cm−1 and 1361 cm−1 are attributed to an in-plane bend of C–C–C ring and the stretching of aromatic C–C, respectively.51,52 The calculated average Raman intensities are 1180 ± 245 and 1020 ± 160 counts for the 1361 cm−1 and 612 cm−1 vibrational modes, respectively (the standard deviation for both modes is shown as black error bars in the SERS spectrum of Fig. 7). The relatively small standard deviations indicate the spatial homogeneity of the SERS signal. The SERS substrate enhancement factor (SSEF) for the 612 and 1361 cm−1 Raman modes was calculated according to the following expression:
| SSEF = (ISR/NSR)/(IRM/NRM) | (1) |
Conclusions
In summary, bare Au NPs on quartz surface by high intensity pulsed laser irradiation were synthesized. The absence of stabilizing agents on the Au NPs or additional molecules that functionalize the quartz surface allows their application as a SERS sensor in a wide spectral region without any signal overlapping. The almost excellent agreement between the Raman spectrum of R6G in solution with the SERS spectrum on the Au NPs_Q demonstrates this important feature. Other remarkable points of this pulsed laser irradiation approach are its simplicity, quick fabrication time (5 min) and large active SERS surface area (determined by the pulsed laser beam area). Moreover, this method contrast with others such as nanolithography or electrodeposition, which require large execution time and highly trained staff.The lack of ligands/stabilizing agents on the Au NPs surface allows its direct modification extending the range of applications. It can be envisioned that this pulsed laser-triggered photochemical synthesis for preparing Au NPs_Q could be extended for the design of specific SERS platforms or LSPR optical sensors by a suitable modification of the Au NPs surface with different targets molecules such as biorecognition agents or molecules with host–guest interactions. Besides this platform has the potential to be used for the development of plasmon improved catalysis devices coating the Au NPs surface with different dielectric compounds (for example magnetite, SiO2, TiO2).
Author contributions
P. A. M. and S. D. G. S. participate in performing, discussing the experiments and writing the manuscript. F. P. C. participates in the XPS experiments and co-wrote the manuscript, A. V.·V. co-wrote the manuscript and E. A. C. designed the research, co-wrote the manuscript and provided overall guidance.Conflicts of interest
There are no conflicts to declare.Acknowledgements
The authors gratefully acknowledge financial assistance from CONICET, SECyT-UNC and FONCyT (ANPCyT). The authors also thank Agustin Tonatiuh Green Canelo (FCQ-UNC, Argentina) for his support with the laser Instruments. Pablo A. Mercadal thanks CONICET for his fellowship awarded. Dr García Schejtman thanks PUE-CONICET for his fellowship awarded.References
- X. Xie, H. Pu and D.-W. Sun, Crit. Rev. Food Sci. Nutr., 2018, 58, 2800–2813 CrossRef CAS.
- B. P. Isaacoff and K. A. Brown, Nano Lett., 2017, 17, 6508–6510 CrossRef CAS PubMed.
- Z. Huang, A. Zhang, Q. Zhang and D. Cui, J. Mater. Chem. B, 2019, 7, 3755–3774 RSC.
- X. Huang and M. A. El-Sayed, J. Adv. Res., 2010, 1, 13–28 CrossRef.
- F. V. Guzman, P. A. Mercadal, E. A. Coronado and E. R. Encina, J. Phys. Chem. C, 2019, 123, 29891–29899 CrossRef CAS.
- A. Biswas, I. S. Bayer, A. S. Biris, T. Wang, E. Dervishi and F. Faupel, Adv. Colloid Interface Sci., 2012, 170, 2–27 CrossRef CAS PubMed.
- K. L. Kelly, E. Coronado, L. L. Zhao and G. C. Schatz, J. Phys. Chem. B, 2003, 107, 668–677 CrossRef CAS.
- S. Pang, T. Yang and L. He, TrAC, Trends Anal. Chem., 2016, 85, 73–82 CrossRef CAS.
- L. Ouyang, W. Ren, L. Zhu and J. Irudayaraj, Rev. Anal. Chem., 2017, 36, 20160027 Search PubMed.
- T. Yaseen, H. Pu and D. W. Sun, Trends Food Sci. Technol., 2018, 72, 162–174 CrossRef CAS.
- P. Mosier-Boss, Nanomaterials, 2017, 7, 1–30 CrossRef PubMed.
- X. Niu, X. Li, Z. Lyu, J. Pan, S. Ding, X. Ruan, W. Zhu, D. Du and Y. Lin, Chem. Commun., 2020, 56, 11338–11353 RSC.
- Y. Luo, Y. Xiao, D. Onidas, L. Iannazzo, M. Ethève-Quelquejeu, A. Lamouri, N. Félidj, S. Mahouche-Chergui, T. Brulé, N. Gagey-Eilstein, F. Gazeau and C. Mangeney, Chem. Commun., 2020, 56, 6822–6825 RSC.
- X. Li, X. Duan, L. Li, S. Ye and B. Tang, Chem. Commun., 2020, 56, 9320–9323 RSC.
- K. A. Willets and R. P. Van Duyne, Annu. Rev. Phys. Chem., 2007, 58, 267–297 CrossRef CAS PubMed.
- T. R. Jensen, M. D. Malinsky, C. L. Haynes and R. P. Van Duyne, J. Phys. Chem. B, 2000, 104, 10549–10556 CrossRef CAS.
- F. Pena-Pereira, R. M. B. O. Duarte and A. C. Duarte, TrAC, Trends Anal. Chem., 2012, 40, 90–105 CrossRef CAS.
- B. Sharma, M. Fernanda Cardinal, S. L. Kleinman, N. G. Greeneltch, R. R. Frontiera, M. G. Blaber, G. C. Schatz and R. P. Van Duyne, MRS Bull., 2013, 38, 615–624 CrossRef CAS.
- J. Kimling, M. Maier, B. Okenve, V. Kotaidis, H. Ballot and A. Plech, J. Phys. Chem. B, 2006, 110, 15700–15707 CrossRef CAS PubMed.
- J. Cao, D. Zhao and Q. Mao, RSC Adv., 2015, 5, 99491–99497 RSC.
- J. Neddersen, G. Chumanov and T. M. Cotton, Appl. Spectrosc., 1993, 47, 1959–1964 CrossRef CAS.
- A. Al-Kattan, V. P. Nirwan, E. Munnier, I. Chourpa, A. Fahmi and A. V. Kabashin, RSC Adv., 2017, 7, 31759–31766 RSC.
- K. Kneipp, in MIT course 6.975, Cambridge, MA, 2001, vol. 2, pp. 1–9 Search PubMed.
- S. M. Musa, Nanoscale Spectroscopy with Applications, CRC Press, 2018 Search PubMed.
- S. Mohammadnejad, J. L. Provis and J. S. J. van Deventer, J. Colloid Interface Sci., 2013, 389, 252–259 CrossRef CAS.
- P. Li, X. Li and S. Dai, Colloids Surf., A, 2020, 590, 124514 CrossRef CAS.
- A. Wojtaszek, I. Sobczak, M. Ziolek and F. Tielens, J. Phys. Chem. C, 2009, 113, 13855–13859 CrossRef CAS.
- A. Wojtaszek, I. Sobczak, M. Ziolek and F. Tielens, J. Phys. Chem. C, 2010, 114, 9002–9007 CrossRef CAS.
- S. Mohammadnejad, J. L. Provis and J. S. J. Van Deventer, Int. J. Miner. Process., 2011, 100, 149–156 CrossRef CAS.
- S. Mohammadnejad, J. L. Provis and J. S. J. Van Deventer, Int. J. Miner. Process., 2014, 128, 1–5 CrossRef CAS.
- N. Lopez, F. Illas and G. Pacchioni, J. Am. Chem. Soc., 1999, 121, 813–821 CrossRef CAS.
- C. Damm and W. Peukert, Langmuir, 2009, 25, 2264–2270 CrossRef CAS PubMed.
- Q. Wang, H. Geng, C. Sun, Z. Zhang and S. He, Nucl. Instrum. Methods Phys. Res., Sect. B, 2010, 268, 1478–1481 CrossRef CAS.
- A. Serrano, F. Gálvez, O. Rodriguez de la Fuente and M. A. García, J. Appl. Phys., 2013, 113, 113104 CrossRef.
- A. A. Menazea, A. M. Abdelghany, W. H. Osman, N. A. Hakeem and F. H. A. El-Kader, J. Non-Cryst. Solids, 2019, 513, 49–54 CrossRef CAS.
- C. Xie, D. Yan, H. Li, S. Du, W. Chen, Y. Wang, Y. Zou, R. Chen and S. Wang, ACS Catal., 2020, 10, 11082–11098 CrossRef CAS.
- V. Astašauskas, A. Bellissimo, P. Kuksa, C. Tomastik, H. Kalbe and W. S. M. Werner, J. Electron Spectrosc. Relat. Phenom., 2020, 241, 146829 CrossRef.
- C. Chen, M. Li, Y. Jia, R. Chong, L. Xu and X. Liu, J. Colloid Interface Sci., 2020, 564, 442–453 CrossRef CAS PubMed.
- R. D. Bayliss, S. N. Cook, D. O. Scanlon, S. Fearn, J. Cabana, C. Greaves, J. A. Kilner and S. J. Skinner, J. Mater. Chem. A, 2014, 2, 17919–17924 RSC.
- J. Narayanasamy and J. D. Kubicki, J. Phys. Chem. B, 2005, 109, 21796–21807 CrossRef CAS PubMed.
- R. Meana-Pañeda, Y. Paukku, K. Duanmu, P. Norman, T. E. Schwartzentruber and D. G. Truhlar, J. Phys. Chem. C, 2015, 119, 9287–9301 CrossRef.
- C. Kan, W. Cai, Z. Li, G. Fu and L. Zhang, Chem. Phys. Lett., 2003, 382, 318–324 CrossRef CAS.
- G. S. Henderson, D. R. Neuville, B. Cochain and L. Cormier, J. Non-Cryst. Solids, 2009, 355, 468–474 CrossRef CAS.
- J. Zhu, J. Gao, J.-J. Li and J.-W. Zhao, Appl. Surf. Sci., 2014, 322, 136–142 CrossRef CAS.
- F. Tian, F. Bonnier, A. Casey, A. E. Shanahan and H. J. Byrne, Anal. Methods, 2014, 6, 9116–9123 RSC.
- G. Xiao, Y. Li, W. Shi, L. Shen, Q. Chen and L. Huang, Appl. Surf. Sci., 2017, 404, 334–341 CrossRef CAS.
- F. Paquin, J. Rivnay, A. Salleo, N. Stingelin and C. Silva, J. Mater. Chem. C, 2013, 3, 10715–10722 RSC.
- H. S. S. Sharma, E. Carmichael and D. McCall, Vib. Spectrosc., 2016, 83, 159–169 CrossRef CAS.
- M. Suzuki, Y. Niidome, N. Terasaki, K. Inoue, Y. Kuwahara and S. Yamada, Jpn. J. Appl. Phys., Part 2, 2004, 43, 4–7 Search PubMed.
- H. Jia, X. Bai, N. Li, L. Yu and L. Zheng, CrystEngComm, 2011, 13, 6179 RSC.
- P. Hildebrandt and M. Stockhurger, J. Phys. Chem., 1984, 88, 5935–5944 CrossRef CAS.
- H. Watanabe, N. Hayazawa, Y. Inouye and S. Kawata, J. Phys. Chem. B, 2005, 109, 5012–5020 CrossRef CAS.
- E. C. L. Ru and P. G. Etchegoin, Principles of surface-enhanced Raman spectroscopy and related plasmonic effects, Elsevier B.V., Oxford, 1st edn, 2009 Search PubMed.
- V. Joseph, A. Matschulat, J. Polte, S. Rolf, F. Emmerling and J. Kneipp, J. Raman Spectrosc., 2011, 42, 1736–1742 CrossRef CAS.
- Z. Zhu, T. Zhu and Z. Liu, Nanotechnology, 2004, 15, 357–364 CrossRef CAS.
Footnote |
| † Electronic supplementary information (ESI) available: Absorption spectra of a 0.4 mM HAuCl4 solution and extinction spectra of the Au NPs_Q under different laser conditions; stability of Au NPs_Q; XPS survey and XPS spectrum of O 1s core level. See DOI: 10.1039/d1ra01991k |
| This journal is © The Royal Society of Chemistry 2021 |

