 Open Access Article
Magnetic GO/Fe3O4 for rapid malachite green (MG) removal from aqueous solutions: a reversible adsorption†
Wenwen Li ab,
Miaoqing Xua,
Qian Caoa,
Jie Luoa,
Shiyong Yang
 *ab and
Guangchao Zhao
 *a
*a
aSchool of Ecology and Environment, Anhui Normal University, Wuhu 241002, PR China. E-mail: gczhao@ahnu.edu.cn; shiyan@ahnu.edu.cn
bCollaborative Innovation Center of Recovery and Reconstruction of Degraded Ecosystem in Wanjiang Basin Co-founded by Anhui Province and Ministry of Education, Wuhu, Anhui 241002, PR China
First published on 28th May 2021
Abstract
Magnetic GO/Fe3O4 was synthesized using co-precipitation of Fe2+ and Fe3+ composited with graphene oxide (GO) in alkaline conditions. SEM, XPS, FTIR, N2 adsorption and VSM techniques were employed to characterize the surface peculiarities of GO/Fe3O4 and it was then used for removal of malachite green (MG). The key influencing factors on adsorption, such as mass ratio of GO, pH value and dosage of GO/Fe3O4, were investigated. The Freundlich isotherm was well fitted to the experimental data, suggesting GO/Fe3O4 has more than one type of reactive site. By comparing the adsorption of anionic dyes and cationic dyes onto GO/Fe3O4, it was concluded that GO/Fe3O4 could be extensively applied to take up cationic dyes mainly for electrostatic interaction. In addition, the spent GO/Fe3O4 was almost 100% recovered in a water bath at 80 °C. An ultraviolet-visible (UV-vis) spectrophotometer and an atom adsorption spectrophotometer (AAS) were used to determine leached GO and Fe ions discharged into the treated solutions. Low leaching showed that magnetic GO/Fe3O4 is a stable environmentally-friendly material.
1. Introduction
Malachite green (MG) is a toxic organic chemical that has been widely used to control fish parasites and disease.1,2 It is also used as a staining agent in ceramics, textiles, leather, food and histochemical studies3,4 due to its low cost.5 Its long-term application and hard-to-degrade nature led to its accumulation in aquatic environments that eventually endangered human health and environmental safety.There is therefore an urgent mission to find appropriate approaches to reduce the environmental risks, and to inactivate or to remove hazardous substances6–8 from the environment. At present, a variety of means, including photo-degradation,9 catalysis,10,11 the Fenton reaction,12 phyto-degradation13 and adsorption,14–16 have all been used for such purposes. Among these approaches, adsorption is one of the most widely accepted techniques because of its environmental compatibility and operability. High adsorption efficiency generally depends on the affinity of functional groups on the surface of the adsorbent to targets.17 A number of materials, including nanoparticles of metal oxide,18 organically modified mineral substances,19,20 biochar,21 and aerogel,22 have been successfully employed to remove MG.
Graphene oxide (GO) is a novel carbon-based material that has a single atom layer of sp2-hybridized carbon arranged in a honeycomb-like structure and its functional groups include hydroxyl, carboxyl, and epoxy groups.23–25 Compared to other carbon-containing adsorbents, the graphene family26 has an improved potential for the adsorption of hazardous metal ions,27–29 cationic dyes30–32 and aromatic compounds33,34 from aqueous solutions. But unitary nano-scale GO is difficult to isolate by filtration and centrifugation.
In contrast, magnetic material could realize magnetic separation independent of other driving forces.35 Coincidently, GO combined with magnetic nano-Fe3O4 is of great interest because it has been proved to be an ideal adsorbent to remove organic dyes and inorganic metal ions. The electrons of benzene rings on GO sheets contribute to possible donor–acceptor interaction, electrostatic attraction, chelation, and catalytic degradation.36 In addition, magnetic GO/Fe3O4 could inhibit the agglomeration of graphene oxide.37 Nevertheless, it has rarely been reported whether GO composites could be recovered or would be left over in aqueous solutions.
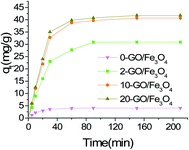
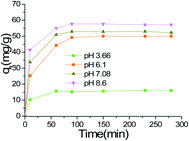
In this study, binary magnetic GO/Fe3O4 was prepared using a modified precipitation method and then its potential and efficiency as an adsorbent to eliminate MG from solutions were assayed. The results showed that the efficiency for MG adsorption increased significantly with increasing GO ratios in the composites. Also, rapid adsorption at high solution pH value suggested that electrostatic interaction is probably the preliminary adsorption force. Most important of all, GO/Fe3O4 can be recovered, suggesting reversible adsorption, less Fe or GO leaching and low secondary environmental pollution. Thus, GO/Fe3O4 is an environmentally friendly material for the removal of organic pollutants from an aquatic environment.
2. Materials and methods
2.1 Materials
MG powder was purchased from Tianjin Chemagent Research Co., Ltd (China). FeSO4·7H2O and FeCl3·6H2O were obtained from Sinopharm Chemical Reagent Co., Ltd (China). Ammonia was obtained from Shanghai Lingfeng Chemical Reagent Co., Ltd (China). Ammonium nitrate, hydrochloric acid and sodium hydroxide were purchased from Shanghai Chemical Reagent No. 1 Co., Ltd (China). GO powder was synthesized in our laboratory using a modified Hummers' method.38 An iron magnet (70 mm long, 50 mm high and 11 mm wide) was purchased from Yongxin Magnetic Industry Co., Ltd (China). All chemicals were of analytical grade and double-distilled water was used throughout the experiments.2.2 Synthesis of GO/Fe3O4 magnetic composite
GO39 was dispersed ultrasonically in distilled water for 20 min, and then adjusted to a concentration of 1.00 mg mL−1. 10.0 g of ammonium nitrate was dissolved in 20.0 mL of water, and then mixed with 20.0 mL of ammonia. The mixture was transferred to a 250 mL volumetric flask as the basic buffer solution (pH 9.5).0, 0.2, 1.0, and 2.0 mL of GO suspension as well as 10 mL of the above-mentioned buffer solution were added to 100 mL beakers. The mixture was churned constantly while being heated to 60 °C in the presence of N2. 0.5 mL of 5 M ammonia and a 0.5 mL mixture of 1 M FeSO4 and 1 M FeCl3 were simultaneously added dropwise. Half an hour later, the aqueous phase was decanted magnetically, while the black precipitates (GO/Fe3O4) were collected, washed using water and ethanol, and then dried at 90 °C for 24 h.
2.3 Instruments and tools
The magnetic behavior was analyzed using a Lake Shore 7404 Vibrating Sample Magnetometer VSM (Lake Shore, USA). The chemical nature of GO/Fe3O4 was characterized using X-ray photoelectron spectra (XPS) with a Nexsa spectrometer (Thermo Fisher, USA) equipped with an Al Kα monochromated X-ray source. The morphology of the adsorbent was characterized with S-4800 FESEM Scanning Electron Microscope images (Hitachi, Japan). An FTIR-8400S instrument (Shimadzu, Japan) was used to analyze the structure and surface groups of the material. N2 adsorption–desorption isotherms were evaluated at 77 K to find the specific surface area and pore size distribution using ASAP 2020 PLUS (Micromeritics, USA). UV-vis adsorption spectra for dyes and GO solutions were recorded using a UV-1901 spectrophotometer (Puxi Company, Beijing).2.4 Adsorption experiments
The effects of GO proportions, pH value (adjusted with 0.1 M HCl and 0.1 M NaOH solutions) and kinetics on adsorption were evaluated using dynamic experiments at room temperature. 100 mL (9.0 mg L−1 and 18 mg L−1) of MG solution was transferred to a 250 mL beaker. 20 mg of the adsorbent was added and then shaken in a water-bath vibrator at 298 K and 200 rpm. 5 mL of supernatant were sampled at definite time intervals for detection.The effects of dosage and adsorption isotherm were studied in batch experiments. GO/Fe3O4 (0.2–16 mg) was suspended in 100 mL triangular flasks containing 50 mL of different concentrations of MG (9.0 to 50 mg L−1) and then shaken in a water-bath vibrator at 200 rpm. 200 min later, 10 mL of the solution was sampled at 200 min for detection. The concentration of MG in solution was determined spectrophotometrically at 618 nm. To ensure reproducibility and accuracy, measurements were made in at least triplicate. MG adsorption capacity (q) was calculated using the following eqn (1):
| qi = (C0 − Ci)V/m | (1) |
2.5 Desorption and re-adsorption experiments
The spent GO/Fe3O4 was thermally desorbed using a batch desorption procedure. In brief, GO/Fe3O4 was suspended in a flask containing 250 mL of H2O, then the flask was arranged in a water-bath vibrator at 60 °C, 70 °C, 75 °C, 80 °C, 85 °C and 90 °C, respectively. Subsequently, the solution was magnetically decanted and the sample concentration (Cde) was determined.Re-adsorption experiments followed the procedure of thermal desorption experiments. The desorbed GO/Fe3O4 was maintained in flasks containing MG at the same concentration and the flasks were shaken in a 30 °C water-bath vibrator at 200 rpm. A fraction of supernatant was sampled and determined at equilibrium as Ce,re.
The amounts of desorption (Qde, mg g−1) and re-adsorption (Qre, mg g−1) are determined following eqn (2) and (3), respectively:
 | (2) |
 | (3) |
3. Results and discussion
The magnetic GO/Fe3O4 was synthesized through a classical co-precipitation procedure. Under alkaline conditions, GO could be well dispersed to form exfoliated sheets with a large number of oxygen-containing functional groups present on the GO surface. When Fe2+/Fe3+ ions were added dropwise, they were rapidly deposited onto the negative GO layers through electrostatic interaction and possibly through chelation. Thus, the black precipitates tightly attached on GO sheets gradually formed multidimensional structures.403.1 Characterization of GO/Fe3O4
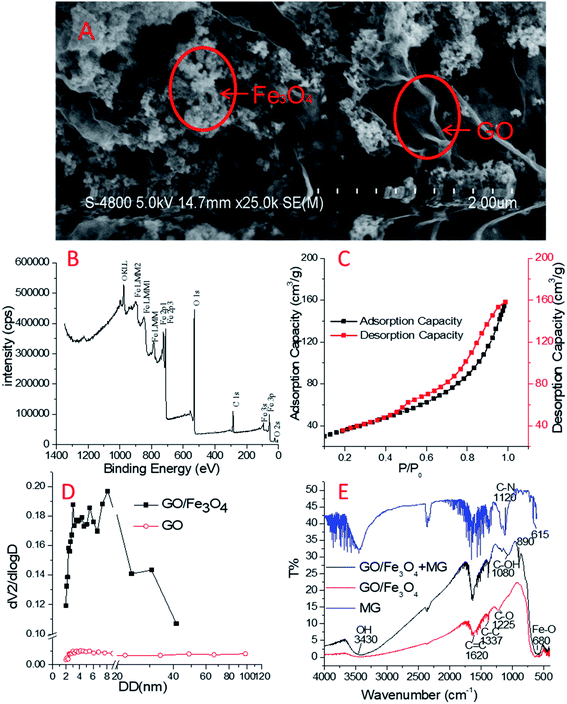
Fig. 1A depicts two types of shapes in the SEM image of GO/Fe3O4 at a 2 μm scale. On the one hand, Fe3O4 agglomerates at an average particle size of 50 nm; see also Fig. S1.† Meanwhile, GO forms thin sheets with a few layers and attaches to Fe3O4, resulting in wrinkled structures. The outer sheet of the wrinkled structures of GO becomes ridged and covers Fe3O4 nanoparticles. As a result, its three-dimensional structure is beneficial for adsorption due to its increased surface area.41 It is also possible that the metallic nanoparticles have supplied stable platforms for GO.42,43 Therefore, GO/Fe3O4 is a powerful material for cyclic utilization.The XPS survey spectrum is shown in Fig. 1B, which is highly consistent with Chong's XPS spectrum of Fe0/Fe3O4/graphene.44 The binding energies at 711 eV and 724 eV could be ascribed to Fe2+ and Fe3+, respectively. The results may demonstrate the presence of Fe3O4 nanoparticles. C–C and C–O groups in the GO surface have contributed the main parts to the C 1s peak and O2− to O 1s. The observed ratio of O/C was very high, indicating the large scale of oxygen-containing groups on the surface of GO/Fe3O4.
In the N2 adsorption assay, the calculated specific surface area of GO/Fe3O4 was 132.2 m2 g−1 (in contrast, that of GO was 28.9 m2 g−1) based on Brunauer–Emmett–Teller (BET) isotherm fitting (Fig. 1C). The N2 adsorption–desorption isotherm curve belongs to the type IV isotherm model according to the International Union of Pure and Applied Chemistry (IUPAC) nomenclature. The hysteresis loop appeared at p/p0 = 0.4–1.0, indicating that the capillary condensation phenomenon had taken place in the mesoporous structure existing in GO/Fe3O4.44 The pore sizes of GO and GO/Fe3O4 measured by an N2 adsorption experiment are shown in Fig. 1D. The pore sizes of GO/Fe3O4 ranging from 2 to 10 nm accounted for 50.04% of the total, and the total pore volume of GO/Fe3O4 was 0.2574 cm3 g−1. In contrast, the pore sizes of GO ranged from 2 to 50 nm and the total pore volume of GO was as low as 0.012 cm3 g−1, suggesting the poor pore structure in GO. The three-dimensional structure of GO/Fe3O4 was assumed to contribute to the mesoporous nature.
FTIR spectra were used to characterize the functional groups of GO/Fe3O4, as shown in Fig. 1D. There were many peaks at about 1620 cm−1, 1337 cm−1 and 1225 cm−1 on GO/Fe3O4, which are probably related to the sp2 skeletal vibration of C![[double bond, length as m-dash]](https://www.rsc.org/images/entities/char_e001.gif) C, C–C and C–O stretching vibrations, respectively.46 These bands in GO/Fe3O4, together with those in GO, suggest the maintenance of the oxygen-containing groups and benzene rings.44 The weak peak at 3430 cm−1 meaning little O–H stretching but the strong peak at 1620 cm−1 meaning lots of C
C, C–C and C–O stretching vibrations, respectively.46 These bands in GO/Fe3O4, together with those in GO, suggest the maintenance of the oxygen-containing groups and benzene rings.44 The weak peak at 3430 cm−1 meaning little O–H stretching but the strong peak at 1620 cm−1 meaning lots of C![[double bond, length as m-dash]](https://www.rsc.org/images/entities/char_e001.gif) C on the GO/Fe3O4 surface showed that there was a good ratio of GO component rather than reduced graphene oxide.45 In addition, the sharp peak of 680 cm−1 represents a large ratio of Fe3O4 component.
C on the GO/Fe3O4 surface showed that there was a good ratio of GO component rather than reduced graphene oxide.45 In addition, the sharp peak of 680 cm−1 represents a large ratio of Fe3O4 component.
The magnetic properties of GO/Fe3O4 were measured to determine whether sufficient magnetization could enable a fast solid–liquid separation. As shown in Fig. S2,† the saturated magnetization was 54.35 emu g−1 and the sharp slope of the magnetization proved its superparamagnetism. In this study the solution separated from the adsorbent in the adsorption experiments was magnetically decanted thoroughly.
3.2 Batch adsorptions
3.3 Adsorption isotherms
Freundlich and Langmuir models are widely used to fit experimental adsorption data. The Freundlich model is an empirical model based on adsorption occurring on heterogeneous surfaces. The equation is commonly described as:48
 | (4) |
 | (5) |
The validity of the isotherm was checked using the fitted straight lines illustrated in Fig. S3,† and the corresponding constants in different adsorption isotherms are summarized in Table 1. The high determination coefficients (R2) suggested that the Freundlich model fitted the experimental data well. The higher KF value at 303 K relative to that at 323 K indicated that GO/Fe3O4 has a higher adsorption capacity and affinity for MG. The n value between 1 and 10 represents favorable adsorption under these conditions. In conclusion, the adsorption of MG onto heterogeneous GO/Fe3O4 surfaces was reversible and the Freundlich isotherm also suggested that the adsorption forces may have more than one source. Although the R2 of the Langmuir equations is lower than that of the Freundlich, the constant of qmax from the Langmuir equations can also be used to roughly evaluate the experimental adsorption capacity.
| Isotherms | Parameters | Temperatures (K) | |
|---|---|---|---|
| 303 K | 323 K | ||
| Langmuir | qmax (mg g−1) | 96.9 | 80.8 |
| b (L g−1) | 2.21 | 1.25 | |
| R2 | 0.988 | 0.971 | |
| Freundlich | KF (L mg−1) | 56.1 | 41.0 |
| n | 3.74 | 3.61 | |
| R2 | 0.994 | 0.995 | |
As shown in Table 1, almost all constants (KF, n, qmax, and b) indicate that a low temperature (303 K) may facilitate the adsorption of MG onto GO/Fe3O4. To demonstrate the results mentioned above, the thermodynamic parameter of enthalpy (ΔH0) was calculated using the following equation:50
 | (6) |
3.4 Adsorption kinetics
To further explore the mechanism of the adsorption process, we applied two kinetic models37 (pseudo-first-order and pseudo-second-order) to analyze the experimental data (Fig. S4†). The pseudo-first-order kinetic equation can be expressed as eqn (7):
log(qe − qt) = log![[thin space (1/6-em)]](https://www.rsc.org/images/entities/char_2009.gif) qe − kt qe − kt
| (7) |
 | (8) |
The kinetic parameters and correlation coefficients for the removal of MG by GO/Fe3O4 are summarized in Table 2. The obtained maximum adsorption capacity (qe,exp = 59.0 mg g−1) is in accordance with the calculated adsorption capacity (qe,cal = 60.0 mg g−1) of the pseudo-second-order model. These results indicate that the pseudo-second-order kinetic model is a good fit to the adsorption of MG. It also means that the adsorption process might be of a chemical nature ascribed to π orbital hybridization. In addition, adsorption on the external surface of oxygen-containing groups can form electronic interactions for rapidly capturing MG molecules.
| Kinetic models | Parameters | C0 (MG, mg L−1) | |
|---|---|---|---|
| 9.00 | 18.0 | ||
| Pseudo-first-order | qe,cal (mg g−1) | 7.55 | 23.0 |
| k1 (min−1) | 0.0121 | 0.0112 | |
| R2 | 0.973 | 0.942 | |
| Pseudo-second-order | qe,cal (mg g−1) | 30.3 | 60.0 |
| k2 (g mg−1 min−1) | 0.288 | 0.166 | |
| R2 | 0.999 | 0.999 | |
3.5 Adsorption mechanism
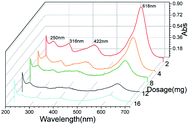
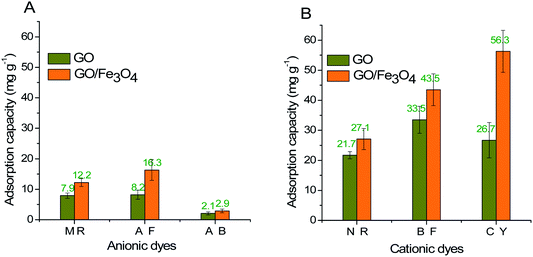
GO/Fe3O4 has a lot of oxygen-containing groups with negative charge that can be regarded as Lewis bases,51 which helps to improve the affinity between cationic MG and GO/Fe3O4. In order to further confirm the adsorption mechanism of electronic interaction, three anionic dyes (Methyl Red, Acid Fuchsin and Aniline Blue) and three cationic dyes (Neutral Red, Basic Fuchsin and Crystal Violet) were selected as adsorbates onto the same amount of GO and GO/Fe3O4, respectively. Experimental conditions: dye concentration was 20 mg L−1, dosage was 10 mg, pH was 7.08, contact time was 200 min, and temperature was 289 K. The results showed that adsorbance of anionic dyes onto both GO and GO/Fe3O4 (Fig. 5A) was much lower than that of cationic dyes (Fig. 5B). It was demonstrated that GO/Fe3O4 was capable of adsorbing various types of cationic dyes via electrostatic interaction. Dyes adsorbed onto binary GO/Fe3O4 were absolutely enhanced compared to unitary GO, because of the increased surface areas in the heterogeneous structure.52 Furthermore, GO/Fe3O4 was also available to adsorb anionic dyes slightly, which could be due to another adsorption mechanism such as interactions of π orbit electrons.33,53In order to further confirm both adsorption forces, the functional groups on the spent GO/Fe3O4 after adsorption are shown in Fig. 2D. The band of O–H stretching vibration at 3430 cm−1 was narrower after adsorption of MG. The peak at 1225 cm−1 disappeared after adsorption, which was attributed to oxygen-containing functional groups, while the peaks at 1080 cm−1 and 980 cm−1 could be explained by the formation of new chemical bonds, i.e. C–OH and π–π conjugations.54 As for MG, the C–N bending and stretching vibrations55 were observed at 1120 cm−1 and 615 cm−1, but both vibrations decreased and shifted significantly after adsorption, indicating the attachment of −N+ to GO/Fe3O4 by electrostatic force. Considering the UV-vis spectrum assay, the spectral peaks of MG solution integrally decreased with an increased dosage of GO/Fe3O4 without a shift in spectral peaks or other peaks emerging. This suggests that the initial MG would be adsorbed due to electronic interaction and π–π conjugations, and the final concentration of MG would be reduced.
3.6 Desorption and re-adsorption of environmentally-friendly GO/Fe3O4
The experiments of MG desorbed from the spent GO/Fe3O4 were performed in a warmed water bath from 60 °C to 90 °C desorption temperature. As shown in Fig. 6, elevated temperatures higher than 80 °C resulted in good desorption. The re-adsorption capacity (58.0 mg g−1) at 80 °C is almost the same as the initial adsorption capacity (59.0 mg g−1), indicating that the adsorption of MG onto GO/Fe3O4 follows the reversible adsorption of the Freundlich model. Reversible adsorption means GO/Fe3O4 can be sustainably utilized as an environmentally-friendly material.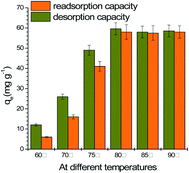 | ||
| Fig. 6 Desorption and re-adsorption capacities in a water bath at elevated temperatures (MG concentration = 10, 20, 30, 40, 50 mg L−1, dosage = 10 mg, pH = 7.08, time = 200 min). | ||
The recoverability and stability of the adsorbent are crucial to the development of advanced treatment technology. After the re-adsorption of the spent GO/Fe3O4, concentrations of the residual iron ions and GO in solutions were detected. Based on the law of conservation of mass, the lost weight was calculated and compared with the total mass of the adsorbent, as can be seen in Fig. 7. It was demonstrated that the mean loss rate of GO was less than 0.5% and that of iron ions was less than 2%.
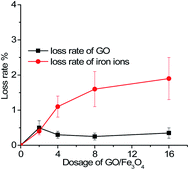 | ||
| Fig. 7 The mean loss rate of GO and iron ions vs. different dosages of GO/Fe3O4 (MG concentration = 9 mg L−1, temperature = 298 K, pH = 7.08, time = 200 min). | ||
4. Conclusion
In this work, GO/Fe3O4 shows heterogeneous phases with a lot of oxygen-containing groups and a large specific surface area of 132.2 m2 g−1. The mass ratio of GO in the adsorbent and the pH value in solution were determining factors for efficient MG removal, reaching an adsorption capacity of 59 mg g−1 at pH 7 within 200 min. It is supposed that the electrostatic interaction and π–π conjugations contribute the attractive force to capture MG molecules. An almost completely reversible adsorption/desorption procedure suggests that GO/Fe3O4 is a promising adsorbent for the circular removal of contaminants. The advantages of its stability, reversibility and recoverability even make it possible to synergize with plants, microorganisms or animals for ecological remediation.Conflicts of interest
There are no conflicts to declare.Acknowledgements
This work was funded by National Nature Science Foundation of China (No. 20975001) and Collaborative Innovation Center of Recovery and Reconstruction of Degraded Ecosystem in Wanjiang Basin Co-founded by Anhui Province and Ministry of Education (GXXT-2020-075).References
- S. Srivastava, R. Sinha and D. Roy, Aquat. Toxicol., 2004, 66, 319–329 CrossRef CAS PubMed.
- F. Ding, X. N. Li, J. X. Diao, Y. Sun, L. Zhang, L. Ma, X. L. Yang, L. Zhang and Y. Sun, Ecotoxicol. Environ. Saf., 2012, 78, 41–49 CrossRef CAS PubMed.
- B. H. Hameed and M. I. El-Khaiary, J. Hazard. Mater., 2008, 154, 237–244 CrossRef CAS PubMed.
- D. Robati, M. Rajabi, O. Moradi, F. Najafi, I. Tyagi, S. Agarwal and V. K. Gupta, J. Mol. Liq., 2016, 214, 259–263 CrossRef CAS.
- N. Bilandžić, I. Varenina, B. S. Kolanović, D. Oraić and S. Zrnčić, Food Control, 2012, 26, 393–396 CrossRef.
- A. ZakariyahJamiu, A. TawfikSaleh and A. ShaikhAli, RSC Adv., 2015, 42222–42232 Search PubMed.
- M. Tuzen, T. A. Saleh and A. Sarı, Chem. Eng. Res. Des., 2020, 159, 353–361 CrossRef CAS.
- T. A. Saleh, M. Tuzen and A. Sarı, Chem. Eng. Res. Des., 2016, 117, 218–227 CrossRef.
- R. K. Upadhyay, M. Sharma, D. K. Singh, S. S. Amritphale and N. Chandra, Sep. Purif. Technol., 2012, 88, 39–45 CrossRef CAS.
- A. M. Aljeboree, A. F. Alkaim, A. Loay and H. M. Algburi, J. Global Pharma Technol., 2019, 11, 138–143 Search PubMed.
- V. K. Gupta, R. Jain, A. Mittal, T. A. Saleh, A. Nayak, S. Agarwal and S. Sikarwar, Mater. Sci. Eng., C, 2012, 32, 12–17 CrossRef CAS PubMed.
- Y. Hu, Y. Li, J. He, T. Liu, K. Zhang, X. Huang, L. Kong and J. Liu, J. Environ. Manage., 2018, 226, 256–263 CrossRef CAS PubMed.
- A. N. Kagalkar, M. U. Jadhav, V. A. Bapat and S. P. Govindwar, Bioresour. Technol., 2011, 102, 10312–10318 CrossRef CAS PubMed.
- V. K. Gupta, I. Ali, T. A. Saleh and S. Agarwal, RSC Adv., 2012, 2, 6380–6388 RSC.
- Y. C. Lee, E. J. Kim, J. W. Yang and H. J. Shin, J. Hazard. Mater., 2011, 192, 62–70 CAS.
- G. Wang, G. Li, Y. Huan, C. Hao and W. Chen, Chemosphere, 2020, 261, 127736 CrossRef CAS PubMed.
- Z. Bekçi, C. Özveri, Y. Seki and K. Yurdakoç, J. Hazard. Mater., 2008, 154, 254–261 CrossRef PubMed.
- Z. Cui, J. Liu, H. Gao, Y. Xue, J. Hao, R. Zhang, B. Ji and J. Chen, Phys. Chem. Chem. Phys., 2019, 21, 13721–13729 RSC.
- M. AmaniAlansi, Z. WaedAlkayali, H. MahaAl-qunaibit, F. TalalQahtan and A. TawfikSaleh, RSC Adv., 2015, 5, 71441–71448 RSC.
- J. Yu, L. Zhang and B. Liu, Int. J. Environ. Res. Public Health, 2019, 16, 3297 CrossRef CAS PubMed.
- M. Choudhary, R. Kumar and S. Neogi, J. Hazard. Mater., 2020, 392(15), 122441 CrossRef CAS PubMed.
- N. Shah, T. Rehan, X. Li, H. Tetik, G. Yang, K. Zhao and D. Lin, RSC Adv., 2021, 11, 7187–7204 RSC.
- J. Y. Lim, N. M. Mubarak, E. C. Abdullah, S. Nizamuddin, M. Khalid and Inamuddin, J. Ind. Eng. Chem., 2018, 66, 29–44 CrossRef CAS.
- Y. Li, P. Zhang, Q. Du, X. Peng, T. Liu, Z. Wang, Y. Xia, W. Zhang, K. Wang, H. Zhu and D. Wu, J. Colloid Interface Sci., 2011, 363, 348–354 CrossRef CAS PubMed.
- T. Liu, Y. Li, Q. Du, J. Sun, Y. Jiao, G. Yang, Z. Wang, Y. Xia, W. Zhang, K. Wang, H. Zhu and D. Wu, Colloids Surf., B, 2012, 90, 197–203 CrossRef CAS PubMed.
- O. Suárez-Iglesias, S. Collado, P. Oulego and M. Díaz, Chem. Eng. J., 2017, 313, 121–135 CrossRef.
- F. Najafi, Int. Nano Lett., 2015, 5, 171–178 CrossRef CAS.
- Y. Zhao, D. Zhao, C. Chen and X. Wang, J. Colloid Interface Sci., 2013, 405, 211–217 CrossRef CAS PubMed.
- H. C. Vu, A. D. Dwivedi, T. T. Le, S. H. Seo, E. J. Kim and Y. S. Chang, Chem. Eng. J., 2017, 307, 220–229 CrossRef CAS.
- Shagufta, R. Dhar, B. S. Kim, A. Alblooshi and I. Ahmad, Int. J. Eng. Technol., 2018, 7, 3007–3013 CAS.
- K. Gupta and O. P. Khatri, J. Colloid Interface Sci., 2017, 501, 11–21 CrossRef CAS PubMed.
- P. Russo, L. D'Urso, A. Hu, N. Zhou and G. Compagnini, Appl. Surf. Sci., 2015, 348, 85–91 CrossRef CAS.
- J. Xu, L. Wang and Y. Zhu, Langmuir, 2012, 28, 8418–8425 CrossRef CAS PubMed.
- M. R. Islam, M. Ferdous, M. I. Sujan, X. Mao, H. Zeng and M. S. Azam, J. Colloid Interface Sci., 2020, 562, 52–62 CrossRef CAS PubMed.
- J. Zhang, M. Liu, Z. Liu, T. Yang, Q. He, K. Yang and H. Wang, J. Sol-Gel Sci. Technol., 2017, 82, 424–431 CrossRef CAS.
- A. Mishra, Vacuum, 2018, 157, 524–529 CrossRef CAS.
- Y. Xu, J. Jin, X. Li, C. Song, H. Meng and X. Zhang, Desalin. Water Treat., 2016, 57, 25216–25225 CrossRef CAS.
- W. S. Hummers and R. E. Offeman, J. Am. Chem. Soc., 1958, 80, 1339 CrossRef CAS.
- J. F. Wu, M. Q. Xu and G. C. Zhao, Electrochem. Commun., 2010, 12, 175–177 CrossRef CAS.
- M. H. Kahsay, N. Belachew, A. Tadesse and K. Basavaiah, RSC Adv., 2020, 10, 34916–34927 RSC.
- G. Fadillah, W. P. Wicaksono, I. Fatimah and T. A. Saleh, Microchem. J., 2020, 159, 105353 CrossRef CAS.
- H. Zhang and X. Hu, J. Environ. Chem. Eng., 2017, 5, 3348–3353 CrossRef CAS.
- A. M. Alansi, T. F. Qahtan and T. A. Saleh, Adv. Mater. Interfaces, 2021, 8, 1–10 Search PubMed.
- S. Chong, G. Zhang, H. Tian and H. Zhao, J. Environ. Sci., 2016, 44, 148–157 CrossRef CAS PubMed.
- Y. Liu, L. Xu, J. Liu, X. Liu, C. Chen, G. Li and Y. Meng, Chem. Eng. J., 2016, 285, 698–708 CrossRef CAS.
- T. A. Saleh, Appl. Surf. Sci., 2011, 257, 7746–7751 CrossRef CAS.
- T. Paszko, Sci. Total Environ., 2012, 435–436, 222–229 CrossRef CAS PubMed.
- T. W. Weber and R. K. Chakravorti, AIChE J., 1974, 20, 228–238 CrossRef CAS.
- I. Langmuir, J. Am. Chem. Soc., 1918, 40, 1361–1403 CrossRef CAS.
- M. Ertaş, B. Acemioĝlu, M. H. Alma and M. Usta, J. Hazard. Mater., 2010, 183, 421–427 CrossRef PubMed.
- X. Zhao, X. Xu, J. Teng, N. Zhou, Z. Zhou, X. Jiang and F. Jiao, Ecotoxicol. Environ. Saf., 2019, 176, 11–19 CrossRef CAS PubMed.
- J. Li, J. Tao, C. Ma, J. Yang, T. Gu and J. Liu, RSC Adv., 2020, 10, 42038–42053 RSC.
- K. C. Lai, L. Y. Lee, B. Yan, Z. Hiew, S. Thangalazhy-gopakumar and S. Gan, J. Environ. Sci., 2018, 79, 174–199 CrossRef PubMed.
- Z. Fang, Y. Hu, X. Wu, Y. Qin and J. Cheng, Chem. Eng. J., 2018, 334, 948–956 CrossRef CAS.
- Z. Shi, C. Xu, H. Guan, L. Li, L. Fan, Y. Wang, L. Liu, Q. Meng and R. Zhang, Colloids Surf., A, 2018, 539, 382–390 CrossRef CAS.
Footnote |
| † Electronic supplementary information (ESI) available. See DOI: 10.1039/d1ra02209a |
| This journal is © The Royal Society of Chemistry 2021 |

