 Open Access Article
Sodium ion intercalation and multi redox behavior of a Keggin type polyoxometalate during [PMo10V2O40]5− to [PMo10V2O40]27− as a cathode material for Na-ion rechargeable batteries†
Marimuthu Priyadarshinia,
Swaminathan Shanmugan*a,
Kiran Preethi Kirubakaran ab,
Anoopa Thomas
 a,
Muthuramalingam Prakash
 a and
Kumaran Vediappan
 *a
*a
aDepartment of Chemistry, Faculty of Engineering and Technology, SRM Institute of Science and Technology, Kattankulathur-603203, Tamil Nadu, India. E-mail: shanmugs2@srmist.edu.in; kumaranv@srmist.edu.in
bDepartment of Physics and Nanotechnology, Faculty of Engineering and Technology, SRM Institute of Science and Technology, Kattankulathur-603203, Chennai, Tamil Nadu, India
First published on 28th May 2021
Abstract
Recently, the development of cathode materials for Na-ion batteries has gained much attention due to the abundance, low cost, and easy availability of resources. Apart from the usual metal oxides, multi-electron redox materials grabbed attention due to their high energy density and practical capacity with long cycle life. Polyoxometalates (POMs) are inorganic clusters of higher valent metals, and act as electron sponges with multi-electron redox properties. Herein we report a Keggin-type polyoxometalate [PMo10V2O40]5− with Na+ and H+ counter cations as a cathode material for Na-ion batteries. Further the formation of POM is evidenced by PXRD, FT-IR, flame photometry and XPS studies. In Na-POM, Na+ ions in the intercluster cavities provide a better pathway and easy diffusion during the charge/discharge process, and contribute to better electrochemical properties than H-POM. The DFT studies further explore the detailed mechanistic pathway of Na+ ions around the clusters in the normal and super-reduced states. Na-POM enables better cycling stability and capacity retention with a specific discharge capacity of 123 mA h g−1 at 0.1C rate at room temperature.
Introduction
Owing to the economic and energy concerns, advancements in energy storage and conversion devices are mostly necessary in recent modernization and for global population as energy storage devices impose their advantages in portable electronic devices, gadgets, electric vehicles (EVs), and hybrid electric vehicles (HEVs).1 Among the various energy storage devices, Li-ion batteries2,3 meet the huge energy demands with long cycle life4,5 and high energy density.6–9 Despite these advantages in Li-ion batteries (LIBs), the growing demand is limited by low reserves, uneven distribution of the source, high costs and safety parameters.10,11 In the periodic table as Na metal lies just below the Li metal, it shares similar chemical reactivity, electrochemical and ionic properties to lithium; besides, the abundant source and cheap price of sodium makes Na-ion batteries (NIBs) a next promising alternative to LIBs.12,13 However, NIBs show analogous behavior to LIBs; the larger ionic radius of sodium (1.03 Å) compared to lithium (0.76 Å) results in undesirable volume changes, thereby leading to slower kinetics, decreased capacity and energy densities.14 To alleviate these effects and improve the performance, the development of NIBs in material design and engineering aspects is essential in the rapidly growing world toward technology developments.Recently transition metal oxides NaXO2 (where X = Co, Ni, Fe, Mn, Ti, and Cr) were identified as cathode materials for NIBs due to their ease of preparation and higher capacity, but these materials tend to lose the capacity on continuous cycling in higher voltage ranges.14–17 In the line of replicating the commercial LiCoO2, NaCoO2 paves the way in the NIB cathode chemistry with an increased specific capacity of 121 mA h g−1 at 0.1C rate.18 However, the latter undergoes numerous phase transitions during cycling, which leads to poor reversibility. Polyanionic frameworks comprise Na3M2(XO4)3 (where M = V, Fe, Mn, Ti, etc. and X = P, S and Si) in which NASICON type Na3V2(PO4)3 (NVP) is reported to have fast ion transport, high thermal and chemical stability.19 A high capacity of 116 mA h g−1 is observed as a result of Na+ ion insertion/extraction from NVP units during charging/discharging processes. But due to its poor electronic conductivity, the above material suffers from poor rate capability and cycle life.20,21 To overcome these drawbacks and to achieve betterment in the above materials, pyrophosphates [Na2FeP2O7],22 fluorophosphates [Na3V2(PO4)2F3],23 fluorosulphates [Na2Fe(SO4)2],24 and mixed phosphates [(PO4)2(P2O7)10−]25 are the viable solution. These phosphates yield good thermal/chemical stability and robust structures due to their tight P–O covalent bonding26 but these materials undergo structural reversibly when operated above 4.0 V. Many types of insertion materials undergo huge volume expansion during multi-electron redox reactions. Other than insertion materials, conversion type and organic materials are considered as upcoming ancillary commercial electrode materials.
POMs are molecular clusters of early transition metals in the higher oxidation state of the negative charges, balanced by the opposite positive charges. The unique property of higher metal valence in the POM cluster is favorable for improving the redox properties and offers greater versatility in developing cathode materials.27 Many types of POMs have been reported for application in LIBs and NIBs due to their unique properties, where Na6[V10O28] was the first reported anode material with a specific capacity of 275 mA h g−1 and high cycling stability.28 However, only a limited number of POM clusters are reported for the cathode, where hetero bimetals are introduced into the POM cluster [MnV13O38] to improve and optimize the rate performance, discharge capacity and cycle life. The inclusion of Mn in [MnV13O38] may lead to sluggish conductivity resulting from Jahn–Teller distortion.29 To avoid the limitation and utilize POMs as fascinating and advanced materials, we explored our research interest in this field, mainly in the Keggin polyoxometalate, a type of polyoxometalate with Mo and V. The choice of Keggin type in various polyoxometalates lies in the material design suitable for metal ion batteries with the multi-electron reduction during the redox process.30 The vanadium substituted in the Keggin polyoxometalate improves the redox potential31 and the counter cations H+ and Na+ in the cluster enhance the stability32 and the specific capacity during the charge/discharge process.
Owing to the fact that the redox property of POMs is tunable by the substitution of hetero bimetals and heteroatoms in the anionic cluster and changes in the counter cations,27,32–34 in this study, we have employed a Keggin type [PMo10V2O40]5− cluster with H+ and Na+ as counter cations (denoted as H-POM and Na-POM), the first developed electrodes for rechargeable Na-ion batteries in the electrode materials database. The main reasons for choosing [PMo10V2O40]5− are as follows: (1) variable redox behaviors of the metals; (2) inclusion of vanadium in the anionic cluster increases the redox potential; (3) combination of molybdenum and vanadium in POMs exhibits higher reduction potential as they are easily reducible.31 Density functional theory (DFT) based periodic calculations are used to explore the geometrical changes of Na5[PMo10V2O40] in both the charge and discharge states.
Experimental
Synthesis of the Na-POM
The synthesis of the H-POM is given in our previous work.35 The Na-POM was synthesized according to a patent with slight modifications.36 Typically, V2O5 (5 mmol) was dispersed in 20 ml of distilled water and heated at 70 °C. To the above mixture, Na2CO3 (5 mmol) was added, and the solution was heated to reflux at 90 °C for 2 h. Then, MoO3 (50 mmol) was added into the reaction mixture with constant stirring and reflux for an additional 1 h. The solution was filtered to remove the impurities. Na2CO3 (7.5 mmol) was added into the filtrate solution followed by the addition of H3PO4 (1 mmol) and heated to reflux for an additional 3 h. The final product was obtained by drying. Yield: 6.29 g (68%). The simple reaction mechanism is given below.| V2O5 + Na2CO3 → 2NaVO3 |
| 2NaVO3 + 10MoO3 + 1.5Na2Co3 + H3PO4 → Na5PMo10V2O40 + 1.5CO2 + 1.5H2O |
Electrode preparation
The electrochemical properties of the electrodes were analyzed with CR2032 type coin cells. The electrodes were prepared as follows: POM, Super P black, and polyvinylidene fluoride (PVDF) in a weight ratio of 50![[thin space (1/6-em)]](https://www.rsc.org/images/entities/char_2009.gif) :
:![[thin space (1/6-em)]](https://www.rsc.org/images/entities/char_2009.gif) 40
40![[thin space (1/6-em)]](https://www.rsc.org/images/entities/char_2009.gif) :
:![[thin space (1/6-em)]](https://www.rsc.org/images/entities/char_2009.gif) 10 are dispersed in the N-methyl pyrrolidone (NMP) solvent to form a homogeneous slurry. The homogeneous slurry is then cast onto aluminium foil, followed by vacuum drying at 110 °C overnight. After drying, the electrodes are hot pressed in a roller and punched into 15 mm diameter. Using the punched electrodes with Na metal as an anode, glass fiber as a separator, and 1 M NaPF6 in propylene carbonate (PC) as an electrolyte, half-cells are assembled in an argon filled glove box (O2 < 0.1 ppm, H2O < 0.1 ppm).
10 are dispersed in the N-methyl pyrrolidone (NMP) solvent to form a homogeneous slurry. The homogeneous slurry is then cast onto aluminium foil, followed by vacuum drying at 110 °C overnight. After drying, the electrodes are hot pressed in a roller and punched into 15 mm diameter. Using the punched electrodes with Na metal as an anode, glass fiber as a separator, and 1 M NaPF6 in propylene carbonate (PC) as an electrolyte, half-cells are assembled in an argon filled glove box (O2 < 0.1 ppm, H2O < 0.1 ppm).
Results and discussion
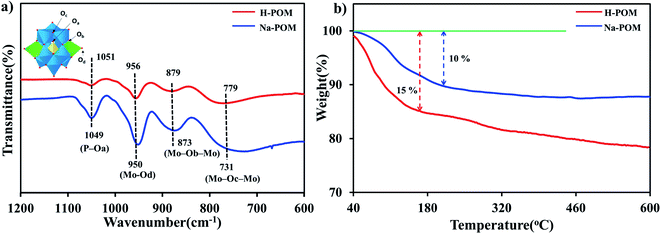
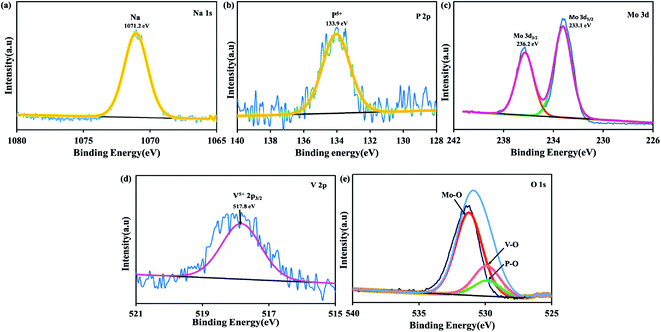
The PXRD pattern of both H-POM and Na-POM shows sharp peaks, an indication of the crystalline nature of the clusters (Fig. S1†), where both exhibit peaks around 8–9°, 17–23°, 26–31°, and 33–36°, characteristic peaks for the Keggin structure.37 A slight difference between the POMs are observed due to the cations around the cluster. The counter cations of the POM usually stabilize the negative charge and influence the self-assembly process. Considering that H+ has an even smaller ionic radius compared to Na+, we would expect shifts in the 2 theta values and lattice contraction. Fig. 1a shows the FT-IR spectra with the identified peaks of the Keggin structure in the range of 731, 873, 950, and 1049 cm−1 which are attributed to intra-octahedral oxygen M–Oc–M, inter-octahedral oxygen M–Ob–M, terminal oxygen M–Od (where M = Mo and V) and central oxygen P–Oa of the Na-POM. The corresponding metal to oxygen bonding is displayed in the inset image. On the other hand, for the H-POM the bands are shifted to the higher wavenumbers 779, 879, 956, and 1051 cm−1. The difference in the wavenumbers is due to the effect of electronegativity of large Na+ ions around the cluster.38 Therefore, the FT-IR spectrum confirms the successful formation of the Keggin structure of H-POM and Na-POM.39 TGA illustrates the weight loss of the H-POM and Na-POM starting above 45 °C and continuing to 240 °C, which indicates the removal of lattice bound water molecules from the cluster,40 given in Fig. 1b. Both the H-POM and Na-POM undergo the gradual weight loss of 15% and 10%, but the Na-POM shows smaller weight loss than the H-POM.41The FE-SEM and HR-TEM images of the H-POM in Fig. 2a and b show the spherical cluster formation, whereas the Na-POM shows a rod-like morphology with 100–200 nm diameters in the size of unequal lengths in both FE-SEM and HR-TEM studies as given in Fig. 2c and d. The rod formation of the Na-POM rather than the H-POM cluster formation enhances the electrochemical properties. The XPS measurement of the H-POM is already given in our previous work.35 The fitted XP spectrum of the Na-POM cluster is given in Fig. 3a–e. The binding energy of 133.9 eV corresponds to the phosphorus in the 5+ oxidation state. The Mo 3d spectrum in Fig. 3c is deconvoluted into two peaks at 233.1 eV and 236.2 eV which correspond to the Mo 3d5/2 and Mo 3d3/2 for Mo in the 6+ oxidation state. The peak at 517.8 eV is assigned to the V5+ species in V 2p3/2 spectra in Fig. 3d.
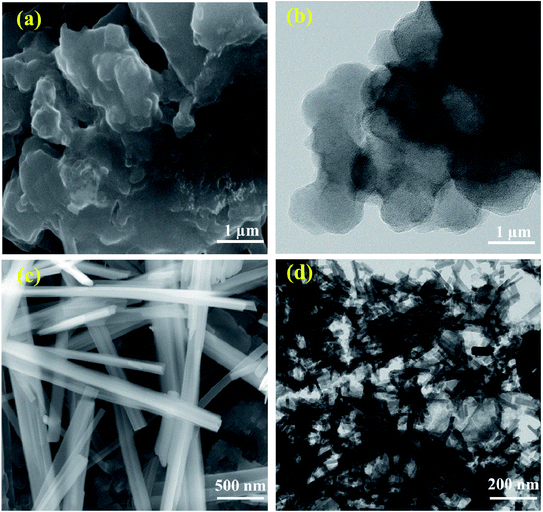 | ||
| Fig. 2 (a and c) FE-SEM images of the H-POM and Na-POM and (b and d) HR-TEM images of the H-POM and Na-POM. | ||
The XP spectra of Na 1s with a peak at 1071.2 eV, as shown in Fig. 3, confirm the sodium ions around the cluster. Thus the spectrum of the Na-POM shows the existence of P, Mo, V, and O, further confirming the formation of the Na5[PMo10V2O40] Keggin structure. Additionally, further to analyze the number of sodium ions around the cluster, flame photometry with higher solution concentration is performed. The experimental molar ratio of sodium of 7.15% relates to the theoretical molar ratio of 6.22%. The variance in the molar concentration of sodium ions results from the water. Based on these characterization results the desired Keggin clusters H5PMo10V2O40 and Na5PMo10V2O40 are formed successfully and further employed as electrodes for Na-ion batteries.
Electrochemistry
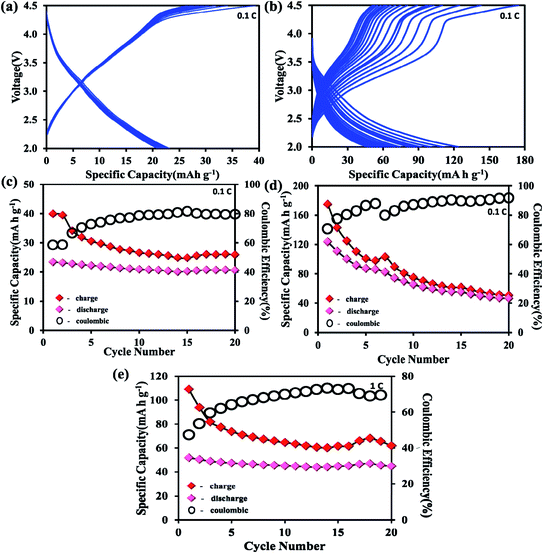
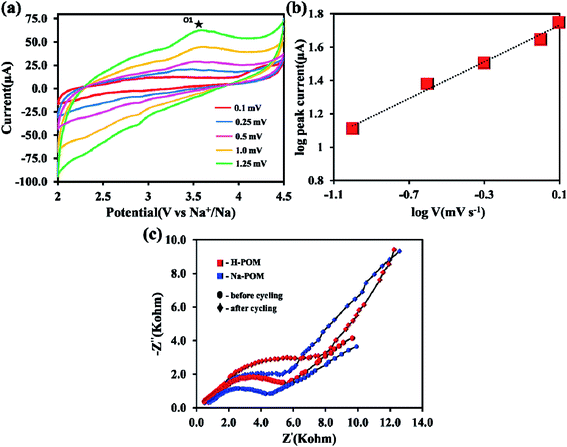
To understand the electrochemical behavior of the H-POM and Na-POM, the CV, GCD, and impedance studies are performed. The charge/discharge profiles of the H-POM and Na-POM for the initial twenty cycles are given in Fig. 4a and b. For the H-POM, as shown in Fig. 4a only one plateau region in both charge and discharge states shows the reduction/oxidation of molybdenum alone.The specific discharge capacity for the H-POM is 23 mA h g−1 at 0.1C in the initial cycle due to the lack of the reduction of the V5+ to V4+ and the charge/discharge life cycle of the H-POM at 0.1C for 100 cycles is given in Fig S3.† In Fig. 4b, the plateau at 2.7 V for the Na-POM in the first discharge cycle indicates the intercalation of sodium ions between the intercluster regions as shown in Fig. S2† by the reduction of higher valent molybdenum. But there is no distinct voltage plateau for the redox behavior of vanadium in the following cycles. The reason is, in the super-reduced state (i.e. discharge process), the outer and inner V–O increases, which results in the expansion/change in the geometries. This results in the lack of redox behavior of vanadium during the Na+ ion intercalation. Similarly, the two charge plateaus at 3.0 V and 4.2 V correspond to the oxidation of Mo4+ to Mo6+ and V4+ to V5+ for the Na-POM. Thus, it is indicated that the sodium ions de-intercalated from the intercluster cavities during oxidation. After the 1st cycle, the charge/discharge curves tend to show the plateaus in the same voltage regions, indicating better reversibility, with minimal capacity fading between the consecutive cycles. But practically the specific capacity was maintained at 46 mA h g−1 after twenty cycles. In Fig. 4d, the irreversible capacity loss and low coulombic efficiency (CE) in the initial and the following cycles are mainly due to the decomposition of the electrolyte and formation of the electrode–electrolyte interfacial (EEI) layer during the insertion/extraction which is common in most of the cathode materials.42,43 Another strong reason for the major capacity fading is the dissolution of the POM cluster which is also reported in other POM based electrode materials.44 The Na-POM shows higher specific discharge capacity when compared to the H-POM. The reason behind this fact is that the more dispersive nature of Na+ ions results in the feasible movement of the large Na+ ions intercalated within the intercluster regions. Due to the large expansion in the core structure and the bigger size of cations, the Na+ ions are bound less effectively to the anionic core which makes them easily accessible for stress-free exchange during charge–discharge studies, which is also explained and proved from the computational studies. The charge/discharge life cycle of the Na-POM at 0.1C and 1C rate for 100 cycles is studied and given in Fig. S4 and S5.† The irreversible capacity after 100 cycles at a 1C rate was maintained at 41 mA h g−1 as shown in Fig. 4e. Compared with the 0.1C rate, at higher current rate (say 1C), the less bound Na+ ions (known interaction distances from the DFT studies given in Table S1†) to the anionic core may activate faster and result in minimal capacity loss throughout the cycling.
The initial specific charge capacity of 174 mA h g−1 at 0.1C corresponds to 55% theoretical capacity (ca. 319 mA h g−1) contribution of 12 electron reduction per Na-POM cluster. The theoretical capacity of 319 mA h g−1 is the result of 22 electrons resulting from the redox couple of ten Mo6+/Mo4+ and two V5+/V4+. The major difference in the theoretical and the practical capacity is the result of partial reduction of the Mo6+/Mo4+ redox couple which is placed in the outer ring of the cluster. Instead of ten, only a few Mo6+/Mo4+ redox couples undergo the reaction, which results in the 10 electron transfer. Due to the larger ionic radius of Na+, rather than 22 Na+ ions, only 12 sodium ions are intercalated in the intercluster cavities.18 During the discharge process the Na-POM experiences huge volume expansion as a result of sodium ion intercalation in the intercluster cavities. In the DFT studies, the geometry of the Na-POM and its intercluster interaction in charged and super reduced states (i.e. [PMo10V2O40]27−) are explained. So instead of 22 electrons, only 12 electron transfers take place during the charge/discharge process. The above results indicate that the POM cluster behaves as an electron sponge29,45 and the Na-POM shows better electrochemical properties.
Ex situ studies
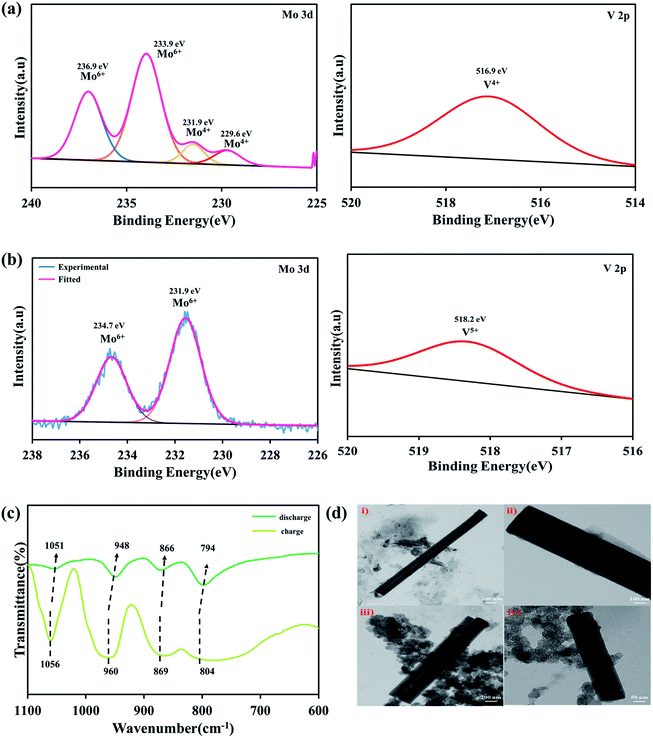
After cycling, the Na-POM cells are de-crimped and the electrodes are separated and washed with dimethyl carbonate inside a glovebox. The electrodes are sonicated in the water medium, where the Na-POM dissolves in water and is later recovered by vacuum drying. The morphological changes, structural evolution and redox reaction during the charge/discharge process are studied from the ex situ PXRD, HRTEM and XPS studies. In Fig. 5a the spectra after 1st discharge are given, where the signal for Mo 3d is deconvoluted into two peaks at 236.9 eV and 233.9 eV corresponding to the Mo6+ oxidation state of Mo 3d3/2 and Mo 3d5/2, and also the existence of signals at 231.9 eV and 229.6 eV corresponds to the Mo4+ oxidation state. The presence of Mo6+ in the POM cluster corroborates the partial reduction of Mo6+ to Mo4+. And the V 2p spectra given in Fig. 5a (right) centered at 516.4 eV clearly indicated the presence of V4+ in the POM. This validates that during the 1st discharge, all ten Mo6+ species don't undergo the reduction process and the two V5+ species undergo reduction. Thus it can be said that during discharge the reduction of Mo and V happens simultaneously with the insertion of Na+ ions around the intercluster regions, whereas after charging the presence of Mo6+ and V5+ as shown in Fig. 5b in the XP spectra indicates the reversibility of the POM cluster with the insertion/extraction of Na+ ions in the intercluster regions. FT-IR studies for the recovered samples are performed in transmission mode with KBr pellets. The ex situ FT-IR studies given in Fig. 5c show the important Mo–O bond shifts after charge and discharge processes. During the first discharge the absorption peak shifts to a lower wavelength as compared to that before the cycling process. The red shift of inter-octahedral oxygen M–Ob–M and terminal oxygen M–Od (where M = Mo and V) from 873, 950 cm−1 to 866, 948 cm−1 indicates the reduction/oxidation of Mo and V ions. The slight change in the peaks is the result of the decrease in the M–O stretching energy, attributed to the redox reaction of Mo6+/Mo4+ and V5+/V4+. In the following charge process, the wavenumber again shifts to a higher wavenumber, indicating the Na+ ions. The reversible shifts in the respective peaks indicate the reversibility of the Na-POM with multi-redox properties even after the charge/discharge process.29 The above results validated that the POM cluster is stable, reversible, and supports multi-electron transfer during the cycling performance. Fig. 5d shows the TEM images of the Na-POM after the 1st cycle and 100 cycles. The Na-POM exhibits a rod shape even after 100 cycles and in Fig. 5d(i), (iii) and (iv) the presence of individual particles with the sp carbon and PVDF is seen and the absence of agglomeration or change in the particle size is evident. Comparing the TEM images with that of the pristine Na-POM, no significant differences are observed and no specific damage or deposit is visible. The rod shape of the electrode could be essentially preserved even after cycling for a long time. This result illustrates the constructive merit of the Na-POM as a cathode for Na-ion batteries.Na+ ion kinetics
The Na+ ion kinetics in the Na-POM cluster is evaluated at the different scan rates of CV from 0.1 to 1.25 mV s−1 as shown in Fig. 6a. The different scan rate CV shows the quasi rectangular shape stretching in the anodic area, whereas there is no distinguishable peak in the cathodic area. The energy storage system involves two distinct processes namely, (1) diffusion controlled process, in batteries, and (2) surface controlled process, in capacitors. From the linear relationship between the response peak current (mA) and the scan rate (v), the kinetics is predicted by the below equation,| i = avb |
DFT studies on the POM cluster
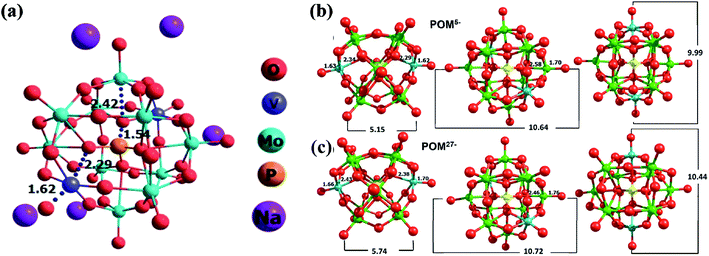
DFT simulations and the optimization of various structures are gaining widespread attention due to their high accuracy in predicting complex experimental structures.47 In our previous work, we have analyzed the H5[PMo10V2O40] cluster for LIB application. The current structure in this study is very similar to the previous material.35 Similarly, to compare the structural changes happening during the charging/discharging process, we analyzed POM5/POM27− anionic clusters. During the charging process, there are 5 Na+ ions in the vicinity of the POM and in the discharging state, there are 27 Na+ cations surrounded by the POM core. Hence, the respective charges of the anionic clusters are 5 and 27 negative state. This charge/discharge process corresponds to the exchange of 22 electrons. An earlier report on the Na-POM suggests the presence of sodium cations in the inter-cluster space.29 So the cations are placed in the vicinity of the anionic cluster and all the elements in the clusters are freely optimized (i.e. there are no constraints applied). The structures of POM5− and POM27− are given in Fig. 7b and c, respectively. The POM structure with excess electrons is termed “super-reduced” POM.30,47From Fig. 7b and c, it is clear that the outer Mo–O distance increases from 1.70 to 1.76 Å and the inner Mo–O distance reduces from 2.58 to 2.46 Å on the transition from POM5− to POM27−. There is no significant change in the central part of the POM (i.e. P–O distance). Both inner and outer V–O distances are enhanced in the POM27− compared to the POM5− structure. The peripheral and internal V–O bonds in the POM core significantly affect the geometries during the charging and discharging process. It is found from our calculation that the O–O (end to end, shown inFig. 7b and c) distance of the super-reduced form of the POM has enhanced and thus the structure of the super-reduced POM is expanded. This is contradicting with the previous report of super-reduced POM ([PMo12O40]27−), where they found a reduction in the size of the POM27−.30,47 These structural changes occurring during the charging/discharging process lead to a higher charge capacity of the Na-POM and hence make it a better material for rechargeable battery systems.
Also, we analyzed different properties such as BE and charge transfer of Na5[PMo10V2O40]. There are five Na+ cations surrounding each anionic core of the cluster; during the optimization the cations are stabilized in the inter-cluster cavity. The optimized geometry of the Na-POM is given in Fig. S2† which explains the occupancy of Na+ ions in the inter-cluster space. Fig. 7a is the optimized geometry of a single unit cell of the Na-POM. After optimization, the changes in the crystal structure are noted and the corresponding volume change is calculated. From Table S1,† it is clear that there is a huge change in the lattice parameters and volume of the Na-POM. The Na-POM structure is expanded about 36% from the original crystal structure. The corresponding volume change in the H-POM was 12.12%. The large expansion of the Na-POM is due to the relatively larger size of Na+ when compared to H+. The expanded anionic core can affect the binding of cations to the cluster. So we calculated the complexation energy between cations and the anionic cluster. The BE between anions and cations is found to be −32.91 eV for the Na-POM. Due to the large expansion in the core structure and bigger size of cations, the Na+ ions are bound less effectively to the anionic core. The calculated BE for H+ in the H-POM is −100.65 eV.35 It is very important to note that the complexation energy of the Na-POM structure is significantly very less compare to the H-POM. Due to the dispersive nature of Na+ ions, they can easily diffuse on the surface and flow between the electrodes during the redox reaction. This interesting phenomenon makes the charge/discharge process more efficient compared to the H-POM. From this result, it is clear that the Na+ bound to the anionic cluster has a major impact on the electron transfer process compared to the H+. To quantify the charge transfer between Na+ and anionic clusters, we performed Lӧwdin population analysis for the optimized geometries. The charge corresponding to anions and cations is −3.63 and 3.63 a.u for the Na-POM. The charge transfer potential is significantly higher compared to that of the H-POM (−0.642 and 0.642 a.u.) structure. This higher charge transfer can be correlated with the less charge transfer resistance observed experimentally from the EIS. The less complexation energy and more charge transfer of the Na-POM make it a good electrochemical material for Na-ion batteries.
Conclusion
In summary, a Keggin type Na5PMo10V2O40 polyoxometalate (Na-POM) is synthesized, characterized by PXRD, FT-IR and XPS studies and used as a cathode material for Na-ion batteries. The higher redox potential of POM can be tuned by varying the counter ions, heteroatoms and transition metals of the cluster. The Na-POM at 0.1C rate exhibits a specific discharge capacity of 123 mA h g−1 in the initial cycle. The charge capacity pertains to the multi-electron redox reaction of Mo6+/Mo4+ and V5+/V4+ in the super-reduced state. The intercalation mechanism in both the charge and discharge state of the Na-POM is explored from the DFT calculations. Thus, the less bound sodium ions intercalated in the intercluster cavities enhance the electrochemical behavior. The higher capacity with the multi-electron transfer is the result of the Na+ ion intercalation/deintercalation in/from the intercluster cavities. This result increases the future hope for the upcoming Na-ion batteries.Conflicts of interest
There is no conflicts to declare.Acknowledgements
This work was financially supported by the Department of Science and Technology (DST)-Science and Engineering Research Board (SERB) funded project by the Government of India (EEQ/2018/000063). The authors acknowledge and thank the supercomputing facility at SRMIST, SRM Central Instrumentation Facility (SCIF), Nanotechnology Research Centre (NRC), India.References
- J. B. Dunn, L. Gaines, J. C. Kelly, C. James and K. G. Gallagher, Energy Environ. Sci., 2015, 8, 158–168 RSC.
- D. Luo, P. Shi, S. Fang, W. Guo, L. Yang and S. I. Hirano, Inorg. Chem. Front., 2017, 4, 650–658 RSC.
- M. Li, Y. Dai, X. Pei and W. Chen, Inorg. Chem. Front., 2019, 6, 2528–2538 RSC.
- H. Li, T. Yang, B. Jin, M. Zhao, E. Jin, S. Jeong and Q. Jiang, Inorg. Chem. Front., 2019, 6, 1535–1545 RSC.
- Q. Han, T. Jin, Y. Li, Y. Si, H. Li, Y. Wang and L. Jiao, Inorg. Chem. Front., 2019, 6, 1238–1244 RSC.
- K. V. Kravchyk, M. V. Kovalenko and M. I. Bodnarchuk, Sci. Rep., 2020, 10, 1–8 CrossRef PubMed.
- M. Wan, S. Kang, L. Wang, H. W. Lee, G. W. Zheng, Y. Cui and Y. Sun, Nat. Commun., 2020, 11, 1–10 Search PubMed.
- H. Jia, X. Li, J. Song, X. Zhang, L. Luo, Y. He, B. Li, Y. Cai, S. Hu, X. Xiao, C. Wang, K. M. Rosso, R. Yi, R. Patel and J. G. Zhang, Nat. Commun., 2020, 11, 1–9 Search PubMed.
- C. Lv, Y. Peng, J. Yang, C. Liu, X. Duan, J. Ma and T. Wang, Inorg. Chem. Front., 2018, 5, 3053–3060 RSC.
- S. Li, X. Song, X. Kuai, W. Zhu, K. Tian, X. Li, M. Chen, S. Chou, J. Zhao and L. Gao, J. Mater. Chem. A, 2019, 7, 14656–14669 RSC.
- Y. Zhu, Z. Zhang, J. Bao and S. Zeng, Int. J. Energy Res., 2020, 44, 1–8 CrossRef.
- Z. Liu, K. Jiang, S. Chu, J. Wu, H. Xu, X. Zhang, P. Wang, S. Guo and H. Zhou, J. Mater. Chem. A, 2020, 8, 23820–23826 RSC.
- F. Zeng, W. Cheng, Y. Pan, M. Yu, Y. Qu and C. Yuan, J. Mater. Chem. A, 2020, 8, 23919–23929 RSC.
- T. Shibata, Y. Fukuzumi, W. Kobayashi and Y. Moritomo, Sci. Rep., 2015, 5, 8–11 Search PubMed.
- B. Fu, X. Zhou and Y. Wang, J. Power Sources, 2016, 310, 102–108 CrossRef CAS.
- D. Wu, X. Li, B. Xu, N. Twu, L. Liu and G. Ceder, Energy Environ. Sci., 2015, 8, 195–202 RSC.
- K. Xi, S. Chu, X. Zhang, X. Zhang, H. Zhang, H. Xu, J. Bian, T. Fang, S. Guo, P. Liu, M. Chen and H. Zhou, Nano Energy, 2020, 67, 104215 CrossRef CAS.
- S. Wang, F. Chen, T. Y. Zhu, X. D. He, J. Y. Liao, L. M. Zhang, X. Ding, Q. Hu and C. H. Chen, ACS Appl. Mater. Interfaces, 2020, 12, 44671–44678 CrossRef CAS PubMed.
- X. Jiang, L. Yang, B. Ding, B. Qu, G. Ji and J. Y. Lee, J. Mater. Chem. A, 2016, 4, 14669–14674 RSC.
- X. Li, Y. Huang, J. Wang, L. Miao, Y. Li, Y. Liu, Y. Qiu, C. Fang, J. Han and Y. Huang, J. Mater. Chem. A, 2018, 6, 1390–1396 RSC.
- J. A. S. Oh, H. He, J. Sun, X. Cao, B. Chua, Y. Huang, K. Zeng and L. Lu, ACS Appl. Energy Mater., 2020, 3, 6870–6879 CrossRef CAS.
- F. Makhlooghiazad, M. Sharma, Z. Zhang, P. C. Howlett, M. Forsyth and L. F. Nazar, J. Phys. Chem. Lett., 2020, 11, 2092–2100 CrossRef CAS PubMed.
- Z. Yang, G. Li, J. Sun, L. Xie, Y. Jiang, Y. Huang and S. Chen, Energy Storage Mater., 2020, 25, 724–730 CrossRef.
- W. Pan, W. Guan, S. Liu, B. Bin Xu, C. Liang, H. Pan, M. Yan and Y. Jiang, J. Mater. Chem. A, 2019, 7, 13197–13204 RSC.
- M. Chen, W. Hua, J. Xiao, D. Cortie, W. Chen, E. Wang, Z. Hu, Q. Gu, X. Wang, S. Indris, S. L. Chou and S. X. Dou, Nat. Commun., 2019, 10, 1–11 CrossRef PubMed.
- Y. Fang, J. Zhang, L. Xiao, X. Ai, Y. Cao and H. Yang, Adv. Sci., 2017, 4, 1600392 CrossRef PubMed.
- B. Huang, D. H. Yang and B. H. Han, J. Mater. Chem. A, 2020, 8, 4593–4628 RSC.
- S. Hartung, N. Bucher, H. Y. Chen, R. Al-Oweini, S. Sreejith, P. Borah, Z. Yanli, U. Kortz, U. Stimming, H. E. Hoster and M. Srinivasan, J. Power Sources, 2015, 288, 270–277 CrossRef CAS.
- J. Liu, Z. Chen, S. Chen, B. Zhang, J. Wang, H. Wang, B. Tian, M. Chen, X. Fan, Y. Huang, T. C. Sum, J. Lin and Z. X. Shen, ACS Nano, 2017, 11, 6911–6920 CrossRef CAS PubMed.
- H. Wang, S. Hamanaka, Y. Nishimoto, S. Irle, T. Yokoyama, H. Yoshikawa and K. Awaga, J. Am. Chem. Soc., 2012, 134, 4918–4924 CrossRef CAS PubMed.
- T. Wei, M. Zhang, P. Wu, Y. J. Tang, S. L. Li, F. C. Shen, X. L. Wang, X. P. Zhou and Y. Q. Lan, Nano Energy, 2017, 34, 205–214 CrossRef CAS.
- J. J. Chen and M. A. Barteau, Ind. Eng. Chem. Res., 2016, 55, 9857–9864 CrossRef CAS.
- S. Lu, Y. Lv, W. Ma, X. Lei, R. Zhang, H. Liu and X. Liu, Inorg. Chem. Front., 2017, 4, 2012–2016 RSC.
- B. J. S. Johnson, R. C. Schroden, C. Zhu and A. Stein, Inorg. Chem., 2001, 40, 5972–5978 CrossRef CAS PubMed.
- M. Priyadarshini, S. Shanmugan, K. P. Kirubakaran, A. Thomas, M. Prakash, C. Senthil, C. W. Lee and K. Vediappan, J. Phys. Chem. Solids, 2020, 142, 109468 CrossRef CAS.
- S. L. D. John, H. Grate, S. Mahajan, D. R. Hamm and K. A. Klingman, Catalytic system for olefin oxidation to carbonyl products, CA2077548A1, 1991.
- H. Wang, L. Fang, Y. Yang, L. Zhang and Y. Wang, Catal. Sci. Technol., 2016, 6, 8005–8015 RSC.
- X. Chen, Y. Liu, H. Wang, M. Yuan, X. Wang and Y. Chen, RSC Adv., 2014, 4, 11232–11239 RSC.
- F. Yang, Y. Hou, M. Niu, T. Lu, W. Wu and Z. Liu, Energy Fuels, 2017, 31, 4–11 CrossRef.
- H. Wang, M. Zhao, Q. Zhao, Y. Yang, C. Wang and Y. Wang, Ind. Eng. Chem. Res., 2017, 56, 2711–2721 CrossRef CAS.
- N. Mizuno and M. Misono, Chem. Rev., 1998, 98, 199–218 CrossRef CAS PubMed.
- K. Kaliyappan, T. Or, Y. Deng, Y. Hu, Z. Bai and Z. Chen, Adv. Funct. Mater., 2020, 30, 1–10 CrossRef.
- L. Yu, L. P. Wang, H. Liao, J. Wang, Z. Feng, O. Lev, J. S. C. Loo, M. T. Sougrati and Z. J. Xu, Small, 2018, 14, 1–22 Search PubMed.
- S. Greiner, M. H. Anjass, M. Fichtner and C. Streb, Inorg. Chem. Front., 2019, 7, 134–139 RSC.
- E. Ni, S. Uematsu, Z. Quan and N. Sonoyama, J. Nanopart. Res., 2013, 15, 1732 CrossRef.
- S. Ding, B. Zhou, C. Chen, Z. Huang, P. Li, S. Wang, G. Cao and M. Zhang, Nano-Micro Lett., 2020, 12, 1–13 CrossRef PubMed.
- Y. Nishimoto, D. Yokogawa, H. Yoshikawa, K. Awaga and S. Irle, J. Am. Chem. Soc., 2014, 136, 9042–9052 CrossRef CAS PubMed.
Footnote |
| † Electronic supplementary information (ESI) available. See DOI: 10.1039/d1ra02092g |
| This journal is © The Royal Society of Chemistry 2021 |

