 Open Access Article
Nanostructured CuO with a thin g-C3N4 layer as a highly efficient photocathode for solar water splitting†
Hyojung Baeab,
Vishal Burungaleb,
Wonkyeong Nab,
Hokyun Rhoc,
Soon Hyung Kanga,
Sang-Wan Ryu a and
Jun-Seok Ha
 *abc
*abc
aOptoelectronics Convergence Research Center, Chonnam National University, 77 Yongbong-ro, Buk-gu, Gwangju 61186, Korea. E-mail: jsha@jnu.ac.kr
bSchool of Chemical Engineering, Chonnam National University, 77 Yongbong-ro, Gwangju 61186, Korea
cEnergy Convergence Core Facility, Chonnam National University, 77 Yongbong-ro, Buk-gu, Gwangju 61186, Republic of Korea
First published on 30th April 2021
Abstract
A g-C3N4/CuO nanostructure featuring improved photoelectrochemical properties was successfully prepared using a facile and cost-effective method involving electrodeposition and thermal oxidation. The improved photoelectrochemical properties were mainly ascribed to the increased surface area and improved charge transportation of the g-C3N4/CuO photocathode. This photocathode can be used in novel strategies for resolving problems associated with low-efficiency CuO photocathodes.
Introduction
In recent years, photoelectrochemical (PEC) water splitting has emerged as a promising technology for addressing the existing energy and environmental crises. This is because PEC water splitting shows tremendous potential for directly utilizing solar energy and offers useful, environmentally benign, clean energy.1,2 In particular, this process involves different types of semiconductors that are used to absorb photons, which are further converted into free–electron–hole pairs. Semiconductors such as p-GaInP2, p-InP, p-WSe2, p-Si, p-CdS, and p-type CuxO have been extensively explored for their use as potential PEC photocathodes.3–9 Among these, CuxO is one of the most promising candidates owing to its excellent characteristics; for instance, it features the most adequate bandgap in the visible region and a significantly low toxicity, and it can be prepared easily. Most importantly, it is abundant in the Earth's crust, which considerably lowers the overall cost of CuxO-based technologies. More specifically, compared to the widely investigated cuprous oxide (Cu2O), CuO is more thermodynamically stable. Moreover, unlike Cu2O with a bandgap of 2.1 eV, CuO with a direct bandgap of ∼1.5 eV can absorb a vast majority of the solar spectrum. Therefore, CuO is a promising photocathode for achieving potentially higher solar conversion efficiencies than those afforded by Cu2O-based photocathodes.10,11Despite these promising characteristics, few studies have investigated the use of CuO for PEC water splitting. This is mainly due to its low PEC activity that results from its low conductivity and carrier mobility, as well as its poor charge separation and transfer capabilities. Moreover, CuO experiences stability issues due to photocorrosion. Consequently, additional efforts are required to improve the PEC performance of CuO-based photocathodes and prevent or lessen their photocorrosion.
There are several possible approaches to address this, including defect engineering, the construction of junctions and Z-scheme systems, and the loading of cocatalysts. Additionally, changing the morphology and controlling the grain of … are also viable options.12–18 In particular, the use of appropriate cocatalysts can significantly enhance the photocatalytic performance of CuO. This is because cocatalysts provide active sites while suppressing charge recombination and reverse reactions on the surface of CuO. Additionally, cocatalysts facilitate reactions by lowering the activation energy; therefore, they could further improve the kinetics of CuO-based water reduction.19,20 Hence, it is critical that novel, simple, and low-cost strategies are developed to accelerate electron–hole separation, which would enhance photocatalytic activity. Graphitic carbon nitride (g-C3N4) has been widely demonstrated as a photocatalyst owing to its adequate band structure, high visible-light adsorption coefficient, low cost, and relatively high thermal stability.21–26
Previous studies have focused on the heterostructure of g-C3N4/CuO to prevent the recombination of photogenerated carriers and improve the overall absorption of the composite in the visible-light region.27–33 However, reported g-C3N4/CuO composites are almost all powder photocatalysts, which are difficult to separate from liquid systems. Furthermore, few studies have employed thin layers of g-C3N4 when developing photocathodes. Therefore, in this study, we developed a facile strategy for preparing a g-C3N4/CuO photocathode that is applicable to PEC water splitting. To ensure well-defined junctions were formed between g-C3N4 and CuO, Cu2O was first fabricated via an electrodeposition method. Electrodeposition is preferred among the applicable techniques owing to its long-term stability, flexibility, relatively low cost, and good reproducibility of film properties. In addition, the morphology, structure, and orientation of the final products can be controlled when using this approach. A urea precursor for g-C3N4 was loaded onto the surface of the obtained Cu2O. Finally, g-C3N4/CuO was fabricated using thermal oxidation, which not only improves the film crystallinity but also increases the grain size of the CuO film.34 The resultant g-C3N4/CuO photocathode exhibited highly efficient PEC water-splitting performance. Moreover, this performance enhancement was investigated from the perspective of interfacial interactions using PEC measurements.
Results and discussion
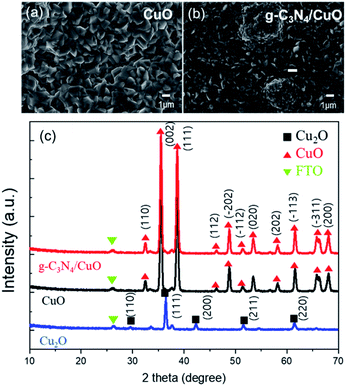
The surface morphologies of the CuO and g-C3N4/CuO thin films after thermal oxidation were observed via scanning electron microscopy (SEM). Fig. 1(a) shows that the CuO thin film has a small grain boundary with a size of ∼1 μm. Unlike that of CuO, the surface of g-C3N4/CuO exhibited a few humps (Fig. 1(b)). These are not due to g-C3N4 but rather self-assembled CuO, which is attributed to the large amount of urea used to prepare g-C3N4/CuO.7 From the cross-section SEM images, the CuO nanostructure was observed (Fig. S4†). The phase structures of the as-prepared Cu2O, CuO, and g-C3N4/CuO thin films were determined using X-ray diffraction (XRD) (Fig. 1(c)). The peak patterns were attributed to the monoclinic Cu2O and CuO phases. The main diffraction peaks observed for Cu2O were at 2θ = 37.52° and 43.54° and correspond to the (111) and (200) planes, respectively, whereas the CuO peaks at 2θ = 32.52°, 35.54°, and 38.72° correspond to the (110), (002), and (111) planes, respectively. After thermal oxidation, the Cu2O-related peak was no longer observed, which further confirmed that Cu2O was converted to CuO. The characteristic peak of g-C3N4 was absent in the diffractogram of g-C3N4/CuO, which indicates that the concentration of g-C3N4 was significantly low, hindering its detection via XRD. This implies the formation of a considerably thin g-C3N4 layer.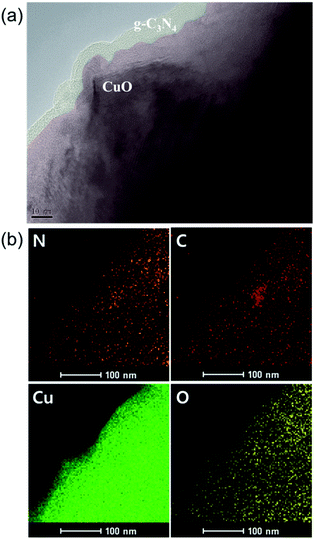 | ||
| Fig. 1 Field-emission scanning electron microscopy (FE-SEM) images of (a) CuO and (b) g-C3N4/CuO. (c) Comparison of X-ray diffraction (XRD) patterns for Cu2O, CuO, and g-C3N4/CuO. | ||
The nanostructure of this g-C3N4/CuO thin film was then observed using transmission electron microscopy (TEM). The image in Fig. 2(a) is shaded to better distinguish CuO from g-C3N4; the former is lighter and the latter is darker due to their different electron penetrabilities. The TEM images indicate that the thin layer of g-C3N4 covers the entire surface of the CuO film. The thickness of the g-C3N4 layer is approximately 3 nm. The presence of this g-C3N4 layer on the surface of the CuO film was further confirmed using energy-dispersive X-ray spectrometry (EDS) elemental mapping (Fig. 2(b)). This mapping also shows that copper, oxygen, carbon, and nitrogen are present. These findings are also in agreement with the results obtained using an electron probe X-ray micro analyzer (Fig. S5†), which indicated the presence of g-C3N4-related peaks (such as those of carbon and nitrogen) and a low percentage of nitrogen. The formation of g-C3N4/CuO thin films was further investigated via Fourier-transform infrared (FT-IR) analysis. The FT-IR spectra of the CuO and g-C3N4/CuO thin films are presented in Fig. 3(a). The spectrum of CuO exhibits a band at 800 cm−1, which relates to the characteristic breathing mode of CuO.28 For the g-C3N4/CuO thin film, the bands between 3000 cm−1 and 3400 cm−1 are attributed to the N–H stretching vibration, whereas the bands over the range of 1100–1600 cm−1 are attributed to the C![[double bond, length as m-dash]](https://www.rsc.org/images/entities/char_e001.gif) N and C–N stretching vibration modes.29 It is evident that the main characteristic bands of g-C3N4 appear in the spectrum of the g-C3N4/CuO thin film. The light absorption properties of the CuO and g-C3N4/CuO thin films were characterized using UV-vis spectroscopy, as shown in Fig. 3(b). The optical band gap can be estimated by utilizing Tauc's equation, (αhν)1/n = A(hν − Eg), in which α is the absorption coefficient, ÒF; is Planck's constant, ν is the light frequency, Eg is the bandgap energy, and A is a constant. For direct transition, the value of n is 1/2. The corresponding Tauc plots are represented in Fig. 3(c). The CuO film demonstrated an absorption edge at 950 nm, and its Eg value was calculated to be 1.30 eV using the Kubelka–Munk theory. The g-C3N4/CuO thin film featured an absorption edge at 930 nm, with its Eg calculated to be 1.33 eV. Based on it being slightly reduced in the visible light range, we concluded that the thin layer of g-C3N4 on CuO does not interfere with the absorption of light.
N and C–N stretching vibration modes.29 It is evident that the main characteristic bands of g-C3N4 appear in the spectrum of the g-C3N4/CuO thin film. The light absorption properties of the CuO and g-C3N4/CuO thin films were characterized using UV-vis spectroscopy, as shown in Fig. 3(b). The optical band gap can be estimated by utilizing Tauc's equation, (αhν)1/n = A(hν − Eg), in which α is the absorption coefficient, ÒF; is Planck's constant, ν is the light frequency, Eg is the bandgap energy, and A is a constant. For direct transition, the value of n is 1/2. The corresponding Tauc plots are represented in Fig. 3(c). The CuO film demonstrated an absorption edge at 950 nm, and its Eg value was calculated to be 1.30 eV using the Kubelka–Munk theory. The g-C3N4/CuO thin film featured an absorption edge at 930 nm, with its Eg calculated to be 1.33 eV. Based on it being slightly reduced in the visible light range, we concluded that the thin layer of g-C3N4 on CuO does not interfere with the absorption of light.
 | ||
| Fig. 2 (a) Transmission electron microscopy (TEM) images and (b) the corresponding energy-dispersive X-ray spectrometry (EDS) mapping obtained from the g-C3N4/CuO thin film. | ||
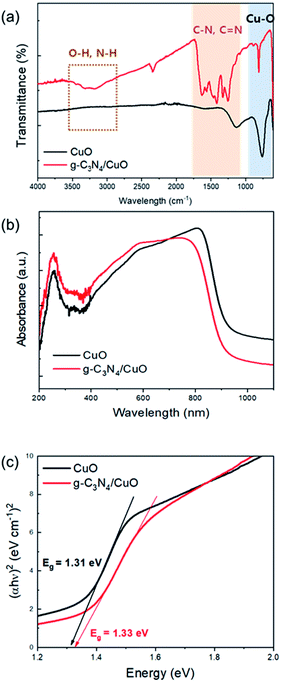 | ||
| Fig. 3 (a) Fourier-transform infrared (FT-IR) spectra, (b) UV-vis spectra and (c) Tauc plots for the CuO and g-C3N4/CuO thin films. | ||
The chemical states of CuO and g-C3N4/CuO were determined using X-ray photoelectron spectroscopy (XPS), and the Gaussian–Lorentzian method was employed for analyzing the spectral regions of the XPS survey (Fig. 4). The overall spectrum primarily comprises two regions that represent the Cu 2p (970–925 eV) and O 1s (540–526 eV) spin–orbit levels. Fig. 4(a) and (b) display the high-resolution spectrum of Cu 2p, separated into Cu 2p3/2 and Cu 2p1/2 peaks at 933.8 eV and 953.8 eV, respectively. Additional confirmation regarding the CuO state is obtained from the broad satellite peaks at a higher binding energy than the main peaks. The main peak of Cu 2p3/2 at 933.8 eV is accompanied by two satellite peaks toward higher binding energies of approximately 943.8 eV and 941.5 eV, which suggests that CuO is completely converted from Cu2O by thermal oxidation.30,31 The XPS O 1s spectra are presented in Fig. 4(c) and (d). The notable peak at 529 eV can be attributed to O2− in CuO and g-C3N4/CuO. The fitted spectra of the O 1s spectra display four peaks centered at 529.5 eV, 530.0 eV, 531.6 eV, and 533.0 eV, which correspond to the metal oxide, surface hydroxyl group, C![[double bond, length as m-dash]](https://www.rsc.org/images/entities/char_e001.gif) O, and C–O, respectively. The peak intensity for the hydroxyl-group peak in the spectrum of the g-C3N4/CuO thin film is higher than that of the hydroxyl-group peak in the spectrum of the CuO thin film. This implies that g-C3N4/CuO contains more hydroxyl groups on its surface than CuO does. This could enhance the reaction site, where electrons react with protons in the electrolyte. Therefore, g-C3N4/CuO can provide a better reaction sites for hydrogen generation than those provided by CuO.
O, and C–O, respectively. The peak intensity for the hydroxyl-group peak in the spectrum of the g-C3N4/CuO thin film is higher than that of the hydroxyl-group peak in the spectrum of the CuO thin film. This implies that g-C3N4/CuO contains more hydroxyl groups on its surface than CuO does. This could enhance the reaction site, where electrons react with protons in the electrolyte. Therefore, g-C3N4/CuO can provide a better reaction sites for hydrogen generation than those provided by CuO.
 | ||
| Fig. 4 High-resolution X-ray photoelectron spectroscopy (XPS) spectra of Cu 2p for (a) CuO and (b) g-C3N4/CuO films and of O 1s for (c) CuO and (d) g-C3N4/CuO films. | ||
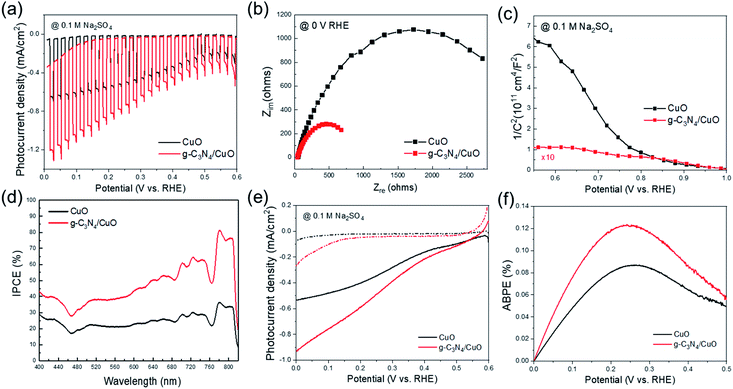
To assess the PEC ability of the CuO and g-C3N4/CuO photocathodes, a three-electrode configuration was used. Fig. 5(a) depicts the chopped photocurrent of the samples from 0 V to 0.6 V vs. the reversible hydrogen electrode (RHE) with light on/off intervals of 1 s. The photocurrent density of g-C3N4/CuO was −0.85 mA cm−2 at 0 V (vs. the RHE), which was 1.5 times greater than that of CuO (−0.5 mA cm−2).
To better understand the enhancement afforded to the photocathode by g-C3N4/CuO, electrochemical impedance spectroscopy (EIS) was used to evaluate the interface reaction between the photocathode and the electrolyte. EIS measurements were conducted at a frequency range of 105 to 10−1 Hz. As shown in Fig. 5(b), semicircles can be clearly distinguished in the Nyquist plots for each sample. These were used to understand the charge transfer process at the electrode–electrolyte interface, where the semicircle diameter is equivalent to the charge transfer resistance (Rct).15 The Rct of the g-C3N4/CuO photocathode is lower than that of the CuO photocathode, which indicates that g-C3N4 reduces the charge transfer process at the interface between the CuO surface and the electrolyte. Hence, g-C3N4 plays a significant role in accelerating the charge separation and transfer at the interface, thereby enhancing PEC performance.
The flat-band potential (Vfb) and carrier density (Nd) of the CuO and g-C3N4/CuO nanostructured photocathodes were determined using Mott–Schottky (MS) measurements at a fixed frequency of 1 kHz. The 1/C2 variable can be determined using eqn (1):
 | (1) |
 | (2) |
Fig. 6 shows the stability of the Cu2O, CuO, and g-C3N4/CuO thin films under an applied potential of 0 V vs. RHE. Although the Cu2O thin film exhibits the highest photocurrent density among the three films, its photostability degrades rapidly. Meanwhile, the CuO thin film features a lower photocurrent density than that of the Cu2O thin film and its photostability remains consistent. The photocurrent of the g-C3N4/CuO thin film was also maintained for 4000 s. This indicates that g-C3N4 can improve the photocatalytic properties of … while maintaining photostability.
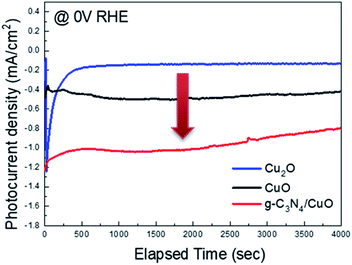 | ||
| Fig. 6 Amperometric (i–t) curves of the Cu2O, CuO, and g-C3N4/CuO photocathodes under visible-light irradiation. | ||
Conclusions
A g-C3N4/CuO nanostructure was fabricated via electrodeposition and thermal oxidation. The XRD pattern confirmed the monoclinic phase of the CuO film, while the TEM and FT-IR results revealed that a significantly thin g-C3N4 layer was successfully formed over the surface of the CuO film. In addition, the MS results demonstrated the p-type nature of the CuO and g-C3N4/CuO thin films. Based on the XPS results, the g-C3N4/CuO thin film features more reaction sites than the CuO thin film does. Moreover, according to the EIS results, the transfer resistance of the g-C3N4/CuO thin film is lower than that of the CuO thin film. The PEC properties of the g-C3N4/CuO photocathode are superior to those of the CuO photocathode due to the benefits provided by g-C3N4, namely the increased surface area and the improved charge separation and transfer efficiency across the thin films and the electrode–electrolyte interface. Moreover, the stability of the g-C3N4/CuO photocathode suggests that g-C3N4 is highly suitable as a direct protection layer. The results of this work suggest that g-C3N4 is a suitable, potential catalyst for PEC water splitting.Materials and methods
Preparation of Cu2O thin film
Fluoride-doped tin oxide (FTO) on a glass substrate (surface resistivity: ∼8–9 Ω) was used as the substrate. The FTO was cleaned via sonication for 5 min in ethanol, isopropyl alcohol (IPA), and deionized (DI) water before being dried using a N2 gas gun. Initially, 0.5 M Cu2SO4·5H2O in 40 mL of DI water was mixed with 12 mL of lactic acid. The solution was stirred until it was fully mixed. Subsequently, 7 g of NaOH was added while stirring until a clear solution was obtained and the pH was just over 11. For the electrodeposition of Cu2O, a three-electrode configuration was used, in which the working electrode was the FTO substrate, the reference electrode (RE) was Ag/AgCl in saturated KCl, and the counter electrode (CE) was a Pt wire. The cleaned FTO samples were dipped into the solution, and a potential of −0.6 V vs. Ag/AgCl was applied for 1 h at 60 °C without stirring. The residue on the surface of the samples was rinsed using DI water and then dried in air. To prepare CuO, the samples were annealed in a muffle furnace at 520 °C for 3 h under an air atmosphere (with a ramping rate of 5 °C min−1).Preparation of g-C3N4/CuO thin film
A conventional thermal condensation method with urea as a precursor was used to synthesize g-C3N4. Before placing Cu2O in the muffle furnace to prepare CuO, a diluted solution of urea in methanol was prepared by adding 2 g of urea to 10 mL of methanol, which was then stirred for 1 h at room temperature. The CuO samples were subsequently dipped into the solution for 30 min, and the urea precursor formed as a self-condensate on the CuO surface. All the prepared samples were then placed into crucibles with covers and annealed at 520 °C for 3 h in a muffle furnace. The g-C3N4/CuO thin film was ready for use after being cooled to room temperature.Characterization
A D2 phaser XRD diffractometer (Bruker AXS Analytical Instruments Pvt. Ltd., Germany) was used to record XRD patterns of the samples, and an X'PERT PRO MRD PW3388/60 at the Energy Convergence Core Facility in Chonnam National University was used for confirming the structure and phase composition. The morphology of the samples was analyzed using field-emission SEM (FE-SEM) and TEM. FT-IR spectra were measured in the range 400–4000 cm−1 using a Spectrum 400 instrument. UV-vis spectra were determined using UV-vis spectroscopy (UV-2450). PEC analysis was carried out using a potentiostat (Parstat 4000). The PEC cell consisted of Ag/AgCl as the RE, a Pt wire as the CE, and the fabricated photocathode as the working electrode; the electrolyte was N2-saturated 0.1 M Na2SO4. A 300 W xenon lamp (Newport) was used for the light illumination experiments, and the light that was chopped onto the photocathodes was calibrated to simulate AM 1.5 illumination (1 sun). All potentials were referenced to the RHE according to the following relationship: VRHE = VAg/AgCl + 0.197 V + 0.059 V × pH.Conflicts of interest
There are no conflicts to declare.Acknowledgements
This research was supported by Basic Science Research Program through the National Research Foundation of Korea funded by the Ministry of Education, Science and Technology (NRF-2019R1I1A1A01048518) and Priority Research Centers Program through the National Research Foundation of Korea (NRF) funded by the Ministry of Education, Science and Technology (2018R1A6A1A03024334) and the Ministry of Trade, Industry and Energy (MOTIE) and Korea Institute for Advancement of Technology (KIAT) through the International Cooperative R&D Program (No. P0006851).References
- N. S. Lewis and D. G. Nocera, Proc. Natl. Acad. Sci. U. S. A., 2006, 103, 15729–15735 CrossRef CAS PubMed.
- D. Chen, Z. Liu and S. Zhang, Appl. Catal., B, 2020, 265, 118580 CrossRef.
- F. Bozheyev, F. Xi, P. Plate, T. Dittrich, S. Fiechter and K. Ellmer, J. Mater. Chem. A, 2019, 7, 10769–10780 RSC.
- S. Liu, Z. Luo, L. Li, H. Li, M. Chen, T. Wang and J. Gong, Nano Energy, 2018, 53, 125–129 CrossRef CAS.
- J. Gu, Y. Yan, J. L. Young, K. X. Steirer, N. R. Neale and J. A. Turner, Nat. Mater., 2016, 15, 456–460 CrossRef CAS PubMed.
- M. H. Lee, K. Takei, J. Zhang, R. Kapadia, M. Zheng, Y. Z. Chen, J. Nah, T. S. Matthews, Y. L. Chueh, J. W. Ager and A. Javey, Angew. Chem., Int. Ed., 2012, 51, 10760–10764 CrossRef CAS PubMed.
- Z. Wang, L. Zhang, T. U. Schülli, Y. Bai, S. A. Monny, A. Du and L. Wang, Angew. Chem., 2019, 131, 17768–17773 CrossRef.
- P. Wang, Y. Tang, X. Wen, R. Amal and Y. H. Ng, ACS Appl. Mater. Interfaces, 2015, 7, 19887–19893 CrossRef CAS PubMed.
- A. Mahmood, F. Tezcan and G. Kardaş, Int. J. Hydrogen Energy, 2017, 42, 23268–23275 CrossRef CAS.
- C. Wadia, A. P. Alivisatos and D. M. Kammen, Environ. Sci. Technol., 2009, 43, 2072–2077 CrossRef CAS PubMed.
- S. Masudy-Panah, R. Siavash Moakhar, C. S. Chua, H. R. Tan, T. I. Wong, D. Chi and G. K. Dalapati, ACS Appl. Mater. Interfaces, 2016, 8, 1206–1213 CrossRef CAS PubMed.
- Y. Bessekhouad, D. Robert and J. V. Weber, Catal. Today, 2005, 101, 315–321 CrossRef CAS.
- S. J. A. Moniz, S. A. Shevlin, D. J. Martin, Z. X. Guo and J. Tang, Energy Environ. Sci., 2015, 8, 731–759 RSC.
- W. Septina, R. R. Prabhakar, R. Wick, T. Moehl and S. D. Tilley, Chem. Mater., 2017, 29, 1735–1743 CrossRef CAS.
- F. Wu, F. Cao, Q. Liu, H. Lu and L. Li, Sci. China Mater., 2016, 59, 825–832 CrossRef CAS.
- Y. Hou, X. Y. Li, Q. D. Zhao, X. Quan and G. H. Chen, Appl. Phys. Lett., 2009, 95, 093108 CrossRef.
- C. Liu, F. Meng, L. Zhang, D. Zhang, S. Wei, K. Qi, J. Fan, H. Zhang and X. Cui, Appl. Surf. Sci., 2019, 469, 276–282 CrossRef CAS.
- V. Ragupathi, M. A. Raja, P. Panigrahi and N. Ganapathi Subramaniam, Optik, 2020, 208, 164569 CrossRef CAS.
- R. Liu, Z. Zheng, J. Spurgeon and X. Yang, Energy Environ. Sci., 2014, 7, 2504–2517 RSC.
- H. Xing, L. E, Z. Guo, D. Zhao and Z. Liu, Chem. Eng. J., 2020, 394, 124907 CrossRef CAS.
- A. Naseri, M. Samadi, A. Pourjavadi, A. Z. Moshfegh and S. Ramakrishna, J. Mater. Chem. A, 2017, 5, 23406–23433 RSC.
- J. Fu, J. Yu, C. Jiang and B. Cheng, Adv. Energy Mater., 2018, 8, 1–31 CAS.
- C. Hu, Y. C. Chu, Y. R. Lin, H. C. Yang and K. H. Wang, Polymers, 2019, 11, 182 CrossRef PubMed.
- X. Wu, X. Wang, F. Wang and H. Yu, Appl. Catal., B, 2019, 247, 70–77 CrossRef CAS.
- Z. Liu and X. Lu, Chin. J. Catal., 2018, 39, 1527–1533 CrossRef CAS.
- C. Hu, Y. C. Chu, M. S. Wang and X. H. Wu, J. Photochem. Photobiol., A, 2017, 348, 8–17 CrossRef CAS.
- Y. Duan, Mater. Res. Bull., 2018, 105, 68–74 CrossRef CAS.
- S. M. Hosseini, R. Siavash Moakhar, F. Soleimani, S. K. Sadrnezhaad, S. Masudy-Panah, R. Katal, A. Seza, N. Ghane and S. Ramakrishna, Appl. Surf. Sci., 2020, 530, 147271 CrossRef.
- S. Zhang, J. Yan, S. Yang, Y. Xu, X. Cai, X. Li, X. Zhang, F. Peng and Y. Fang, Chin. J. Catal., 2017, 38, 365–371 CrossRef CAS.
- S. Hong, Y. Yu, Z. Yi, H. Zhu, W. Wu and P. Ma, Nano, 2016, 11, 7–10 CrossRef.
- J. Bai, Y. Sun, M. Li, L. Yang, J. Li and S. Hu, New J. Chem., 2018, 42, 13529–13535 RSC.
- H. Seyed Morteza Hosseini, R. Siavash Moakhar, F. Soleimani, S. Khatiboleslam Sadrnezhaad, S. Masudy-Panah, R. Katal, A. Seza, N. Ghane and S. Ramakrishna, Appl. Surf. Sci., 2020, 530, 147271 CrossRef.
- N. Chidhambaram and K. Ravichandran, Mater. Lett., 2017, 207, 44–48 CrossRef CAS.
- S. Masudy-Panah, R. Siavash Moakhar, C. S. Chua, A. Kushwaha, T. I. Wong and G. K. Dalapati, RSC Adv., 2016, 6, 29383–29390 RSC.
Footnote |
| † Electronic supplementary information (ESI) available. See DOI: 10.1039/d1ra02193a |
| This journal is © The Royal Society of Chemistry 2021 |

