 Open Access Article
Thermal, ferroelastic, and structural properties near phase transitions of organic–inorganic perovskite type [NH3(CH2)3NH3]CdBr4 crystals
Ae Ran Lim *ab
*ab
aDepartment of Carbon Convergence Engineering, Department of Science Education, Jeonju University, Jeonju 55069, Korea. E-mail: aeranlim@hanmail.net; arlim@jj.ac.kr
bAnalytical Laboratory of Advanced Ferroelectric Crystals, Jeonju University, Jeonju 55069, Korea
First published on 13th May 2021
Abstract
Hybrid perovskites have potential applications in several electrochemical devices such as supercapacitors, batteries, and fuel cells. Therefore, we studied the thermal behavior and structural dynamics of organic–inorganic hybrid perovskite [(NH3)(CH2)3(NH3)]CdBr4 crystals near phase transition temperatures, TC2 (=328 K) and TC1 (=363 K), which are correlated to the structural dynamics of cations and anions. The structural geometry and molecular dynamics with emphasis on the role of the [(NH3)(CH2)3(NH3)] cation and CdBr6 anion were discussed in terms of MAS 1H NMR, MAS 13C NMR, 14N NMR, and 113Cd NMR as a function of the temperature. The environments surrounding 1H, 13C, 14N, and 113Cd are investigated near TC1 and TC2 using these results. Spin–lattice relaxation times T1ρ were discussed in terms of the change in temperature. The discontinuous changes of 1H T1ρ and 13C T1ρ near TC1 are consistent with the change of the lattice constant. Shorter T1ρ values at high temperature indicate that 1H and 13C in the organic chains are more flexible at these temperatures. Based on these results, the physicochemical properties of the cation and anion during the III–II–I phase transitions were discussed. This study was conducted to improve the relatively weak thermal stability compared to the high efficiency for a variety of applications.
I. Introduction
Organic–inorganic compounds based on two-dimensional (2D) hybrid perovskites, particularly [(CnH2n+1NH3)]2BX4 (n = 1, 2, 3,…; B = Mn, Co, Cu, Zn, Cd; X = Cl, Br) and [NH3(CH2)nNH3]BX4 (n = 2, 3,…), have attracted considerable attention in recent years. The monoammonium [(CnH2n+1NH3)]2BX4 (ref. 1–7) and diammonium [NH3(CH2)nNH3]BX4 series have been extensively studied owing to their relative stability and potential applications.8–13 The properties and structural phase transitions of organic–inorganic hybrid perovskites are related to their structures and the interaction of cationic units with complex anionic sublattices.14 The phase transitions for diammonium [NH3(CH2)nNH3]BX4 compounds have their origin in the dynamics of the cations, in particular from the dynamics of the NH3 groups forming hydrogen bonds with the halogen atoms of the anion layers and hindered rotational motions of the entire alkyl group around the long molecular axis.10 For B = Mn, Cu, or Cd, the structure consists of the corner shared octahedral (BX6)2− alternated with organic layers. In contrast, for B = Co or Zn, isolated tetrahedral structures are formed in the inorganic layer (BX4)2− sandwiched between layers of organic cations.15–23 These compounds have attracted attention owing to the multiplicity of their crystal structures, which is correlated to the structural dynamics of cations and anions. Ferroelasticity is commonly observed in materials with a perovskite crystal structure. Recently, the ferroelastic twin domain observed in organic–inorganic hybrid perovskite likewise garnered significant attention.24–27 2D hybrid perovskites are promising for a variety of applications, including photovoltaics, photocatalysis, batteries, and energy storage.28,29The [NH3(CH2)3NH3]CdBr4 (1,3-propanediammonium tetrabromocadmate) crystal (n = 3; B = Cd; X = Br), a member of the diammonium [NH3(CH2)nNH3]BX4 series, belongs to the orthorhombic structure at room temperature. This crystal with Cd is a very special case; it exhibits an unusual phase sequence, i.e., its stable phase at the highest temperature is the one with the lowest symmetry.30 This crystal undergoes two phase transitions, at temperatures of 326 K (=TC2) and 368 K (=TC1).10,30 The room temperature phase III was determined in the space group Pnma (point group mmm) of the orthorhombic structure. Its lattice constants have been reported as a = 7.721 Å, b = 19.054 Å, c = 7.898 Å, and Z = 4.30 In this phase, Cd atoms are surrounded by six bromine atoms forming a nearly regular octahedron CdBr6. Of these six bromine atoms, four Br atoms are bridging atoms shared with the neighboring octahedral, and two Br atoms are terminal atoms resulting in bidimensional anion planes. These formations are connected by hydrogen bonds N–H⋯Br and the cation. The phase II above TC2 has the space group Ima2 (point group mmm) and the same orthorhombic structure. In the highest phase I, this crystal is in the monoclinic structure with the space group P21/m (point group 2/m). The lattice constants a and b increase continuously with rising temperature, but the value of c decreases slightly at TC2 and shortens rapidly at TC1. The monoclinic angle β abruptly increases with increasing temperature, reaching approximately 95.5° in this phase, whereas in phases II and III, its value was constant at β = 90°.30
For [NH3(CH2)3NH3]CdBr4 crystals, a temperature dependence experiment addressing the 79,81Br nuclear quadrupole resonance (NQR) near the phase transition temperatures was studied by Ishihara et al.31,32 The X-ray structure analysis at room temperature was likewise reported.32 Further, the spectroscopic properties of this crystal with its phase sequence were investigated via various experimental methods: differential scanning calorimetry (DSC), infrared (IR), far infrared (FIR), and Raman spectroscopy measurements.10 Recently, optical and dilatometric studies presented the multidomain states obtained by optical polarizing microscopic observation.14 Although [NH3(CH2)3NH3]CdBr4 has numerous applications, the physicochemical properties and molecular dynamics of its crystals have not been studied to date.
In this study, the structure and phase transition temperatures of [NH3(CH2)3NH3]CdBr4 crystals are investigated via X-ray diffraction and DSC. Thermogravimetric analysis (TGA) and differential thermal analysis (DTA) experiments were performed to obtain a better understanding of the thermal properties. The chemical shifts and molecular dynamics were probed by 1H magic-angle spinning nuclear magnetic resonance (MAS NMR) and 13C MAS NMR as a function of temperature to elucidate the role of the [NH3(CH2)3NH3] cation. Furthermore, the chemical shifts for 14N and 113Cd of the CdBr6 anion were recorded by static NMR spectra as a function of the temperature. The spin–lattice relaxation times (T1ρ) in the rotating frame were discussed in terms of the change of temperature. Based on these results, the structural dynamics of the [NH3(CH2)3NH3] cation and CdBr4 anion during the III–II–I phase transitions were discussed. The ferroelastic twin domain walls in all phases were observed as well. Finally, we compare the physicochemical properties of [NH3(CH2)3NH3]CdBr4 with those of [NH3(CH2)3NH3]CdCl4 previously reported. Moreover, the physicochemical properties revealed important information regarding the basic mechanisms that enable their widespread applicability.
II. Experimental method
An aqueous solution containing NH2(CH2)3NH2·2HBr and CdBr2 was slowly evaporated at a constant temperature of 300 K to yield single crystals of [NH3(CH2)3NH3]CdBr4. The [NH3(CH2)3NH3]CdBr4 single crystal grown here has a colorless and transparent square shape.The structure of the [NH3(CH2)3NH3]CdBr4 crystal at 298 K was analyzed using an X-ray diffraction system equipped with a Cu-Kα radiation source. The lattice parameters were determined by single crystal X-ray diffraction at the Western Seoul Center of Korea Basic Science Institute (KBSI). The crystals were mounted on a Bruker D8 Venture equipped with an I μS micro-focus sealed tube Mo-Kα and a PHOTON III M14 detector.
DSC (TA, DSC 25) experiments were conducted at a heating rate of 10 K min−1 in a temperature range of 200–600 K in nitrogen atmosphere. TGA and DTA experiments were performed on a thermogravimetric analyzer (TA Instrument) in the temperature range of 300–870 K with the same heating rate. The type of fan used in experiment was Al.
The NMR spectra of [NH3(CH2)3NH3]CdBr4 crystals were measured on a 400 MHz Avance II+ Bruker solid-state NMR spectrometer at the Western Seoul Center of KBSI. The MAS 1H and 13C NMR experiments were conducted at the Larmor frequencies of 400.13 and 100.61 MHz, respectively. To minimize the spinning sideband, a MAS rate of 10 kHz was employed. Tetramethylsilane (TMS) was used as the standard to record the NMR spectra. T1ρ values were measured using the π/2 − τ sequence method by varying spin-locking pulses. The width of the π/2 pulse for 1H and 13C was 3.56–3.72 μs. Further, static 14N NMR and 113Cd NMR spectra of a [NH3(CH2)3NH3]CdBr4 single crystal were measured at Larmor frequencies of 28.90 and 88.75 MHz, respectively, and the chemical shift was referenced with respect to NH3NO3 and CdCl2O8·6H2O as standard samples, respectively. The 14N NMR experiments were performed using a solid-state echo sequence. An almost constant temperature within error range ±0.5 K was maintained, even when the rate of flow of nitrogen gas and the heater current were adjusted.
The ferroelastic domain pattern in the (001) plane was studied using an optical polarizing microscope. A hot stage (Linkam, THMS 600) and temperature controller maintained the temperature of the crystal.
III. Results and discussion
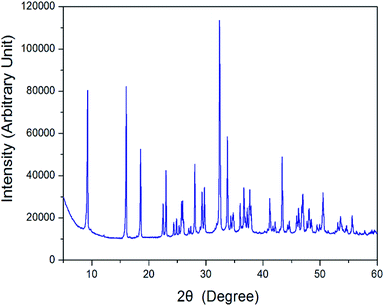
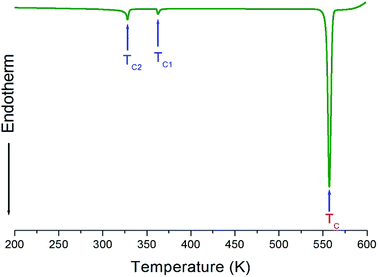
The X-ray powder diffraction pattern of the [NH3(CH2)3NH3]CdBr4 at 298 K are displayed in Fig. 1. And, the lattice constants for [NH3(CH2)3NH3]CdBr4 crystal are determined to be a = 7.711 ± 0.003 Å, b = 19.148 ± 0.008 Å, and c = 7.856 ± 0.004 Å. This result is consistent with that reported previously.30Three endothermic peaks at 328 K, 363 K, and 557 K were observed in the DSC curves of [NH3(CH2)3NH3]CdBr4, as shown in Fig. 2. Two endothermic peaks at 328 K and 363 K are consistent with those previously reported by Staskiewicz et al.30 In order to understand the peak of 557 K, we performed the TGA and DTA experiments and the results are presented in Fig. 3. On the DTA curve, two small endothermic peaks at 328 and 363 K are assigned to the structural phase transitions detected in the DSC experiment. A large endothermic peak at 557 K is assigned to the onset of thermal decomposition temperature (=Td) by the DTA and a polarizing microscope experiments. This was characterized by a loss in the weight of the compound. It was observed that [NH3(CH2)3NH3]CdBr4 (Mw = 508.16 mg) crystals begin to lose weight as the temperature rises. The amount remaining as solid residue is calculated from the molecular weights and balanced chemical reactions. [NH3(CH2)3NH3]CdBr4 lost 16 and 32% of its weight at temperatures of approximately 614 and 638 K, respectively. The weight loss can be attributed to the decomposition of HBr and 2HBr moieties, respectively, as shown in Fig. 3. At approximately 850 K, the 98% of the total weight of this crystal is lost.
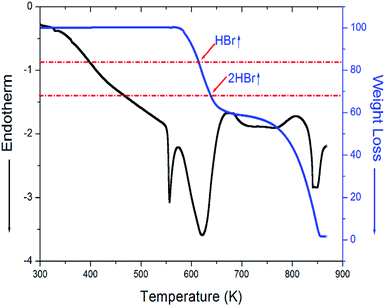 | ||
| Fig. 3 Thermogravimetric analysis (TGA) and differential thermal analysis (DTA) curves for [NH3(CH2)3NH3]CdBr4 crystal. | ||
The temperature-dependent 1H NMR chemical shifts for [NH3(CH2)3NH3]CdBr4 crystals were recorded by MAS NMR, as shown in Fig. 4. Only one resonance signal was observed at low temperature. The observed resonance signal exhibits asymmetric shapes due to overlapping lines of the 1H for two types of NH3 and CH2 in [NH3(CH2)3NH3] cations. The spinning sidebands were marked with open circles. At 180 K, a single resonance line is present at 7.35 ppm, which subsequently splits into two resonance lines above 300 K (inset Fig. 4).
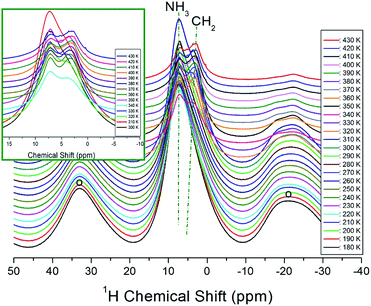 | ||
| Fig. 4 In situ 1H MAS NMR spectra for CH2 and NH3 of [NH3(CH2)3NH3]CdBr4 at several temperatures. The spinning sidebands are marked with open circles (inset: expansion of 1H NMR signals above 300 K). | ||
At 330 K, which is higher than TC2, the NMR spectrum is separated by two resonance lines showing chemical shifts of 7.24 and 3.88 ppm for NH3 and CH2, respectively. The 1H chemical shifts of NH3 indicated by dotted lines in Fig. 4 are almost independent of the temperature, while those of CH2 slightly shift toward the lower side as the temperature increases. From these results, the surrounding environment of H of NH3 does not change depending on the temperature, and that of H of CH2 changes slightly according to the temperature.
The 1H MAS NMR spectrum was measured with respect to several delay times at each temperature. The relationship between the intensities of the NMR signals and the delay times is as follows:33–35
| I(t) = I(0)exp(−t/T1ρ), | (1) |
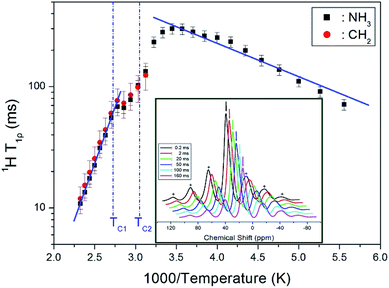
![[thin space (1/6-em)]](https://www.rsc.org/images/entities/char_2009.gif) exp(−Ea/kBT), where ω1 denotes the radiofrequency power of the spin lock pulse, and Ea represents the activation energy. Different limits are satisfied for ω1τC in each of the three temperature ranges, separated by TC1 = 363 K and TC2 = 328 K. Specifically, the limit ω1τC ≫ 1 applies for both T > TC1 and TC2 < T < TC1, and the limit ω1τC ≪ 1 for T < TC2. As indicated by the solid lines in Fig. 5, Ea = 5.21 ± 0.38 kJ mol−1 at temperature below TC2, while above TC1, Ea = 35.98 ± 0.68 kJ mol−1. The decrease in T1ρ values with temperature indicates an increase in proton mobility at higher temperatures.
exp(−Ea/kBT), where ω1 denotes the radiofrequency power of the spin lock pulse, and Ea represents the activation energy. Different limits are satisfied for ω1τC in each of the three temperature ranges, separated by TC1 = 363 K and TC2 = 328 K. Specifically, the limit ω1τC ≫ 1 applies for both T > TC1 and TC2 < T < TC1, and the limit ω1τC ≪ 1 for T < TC2. As indicated by the solid lines in Fig. 5, Ea = 5.21 ± 0.38 kJ mol−1 at temperature below TC2, while above TC1, Ea = 35.98 ± 0.68 kJ mol−1. The decrease in T1ρ values with temperature indicates an increase in proton mobility at higher temperatures.
The 13C MAS NMR chemical shifts in [NH3(CH2)3NH3]CdBr4 were measured with respect to the change in temperature, as shown in Fig. 6. The 13C MAS NMR spectrum for TMS was obtained at 38.3 ppm at 300 K. This peak at 38.3 ppm was taken as the standard and calibrated as a peak at zero ppm. Here, the CH2 sandwiched between two other CH2 is labeled as CH2-1, and the CH2 close to NH3 is labeled CH2-2. At 300 K, the carbon signals corresponding to the CH2-1 and CH2-2 in [NH3(CH2)3NH3]CdBr4 appear at 25.55 and 39.96 ppm, respectively. Below TC2, 13C resonance signals show two resonance lines for CH2-1 and CH2-2. Between TC2 and TC1, 13C resonance signal was separated into three or four resonance lines. Their resonance lines at temperatures above TC1 were again reduced to two. Here, below TC2, the chemical shifts of CH2-1 and CH2-2 are shifted slightly upward as the temperature increases, but at temperatures above TC1, the chemical shifts of the two resonance lines are almost independent of the temperature.
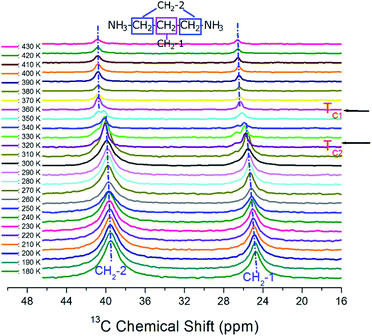 | ||
| Fig. 6 In situ 13C MAS NMR spectra for CH2-1 and CH2-2 of [NH3(CH2)3NH3] CdBr4 as a function of temperature. | ||
The change in the full width at half maximum (FWHM) for 13C NMR spectra with respect to the temperature is shown in Fig. 7. The 13C NMR line widths for CH2-1 and CH2-2 decreased with an increase in temperature. The line width of the resonance line is approximately 2.8 and 4.5 ppm, respectively, for CH2-1 and CH2-2 at low temperature. However, as the temperature increases, the line width changes from a Gaussian to a Lorentzian shape, and it decreases rapidly. In particular, it is markedly reduced near TC2 and TC1. The line width decreases with increasing temperature due to internal molecular motion, and that of CH2-2 is broader than that of CH2-1.
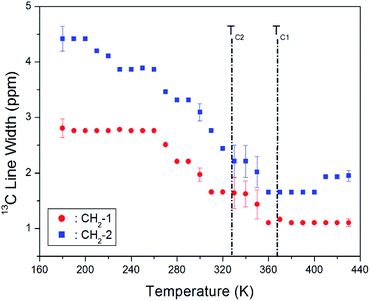 | ||
| Fig. 7 Line widths of 13C MAS NMR signal for CH2-1 and CH2-2 in [NH3(CH2)3NH3]CdBr4 as a function of temperature. | ||
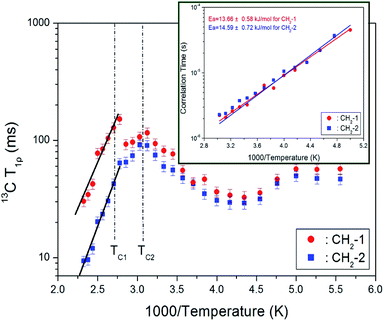
The intensities of 13C MAS NMR signals for CH2-1 and CH2-2 in [NH3(CH2)3NH3]CdBr4 were measured by varying the delay times at each temperature. The decay curves for CH2-1 and CH2-2 were fitted to a single exponential equation in eqn (1). 13C T1ρ values were measured by the spin-locking pulse sequence with a locking pulse of 69.44 kHz. From the slope of their recovery traces, the 13C T1ρ values were obtained for CH2-1 and CH2-2 as a function of 1000/temperature, as shown in Fig. 8. The values of T1ρ are somewhat continuous near TC2, and discontinuous near TC1. Similar to the results of 1H T1ρ, the discontinuous change near TC1 is consistent with the result of a rapid shortening of the lattice constant c-value. The T1ρ vs. inverse temperature curves shows minima at 32.65 and 29.14 ms for CH2-1 and CH2-2 at 230 K, respectively. This trend indicates that distinct molecular motions exist, where the minimum T1ρ was attributed to the uniaxial rotation of CH2 ions. The T1ρ values were described by the correlation time τC for molecular motion. The T1ρ value for the molecular motion is given by:34
| 1/T1ρ = C(γC2γH2ℏ2/r6){4τC/[1 + ω12τC2] + tC /[1 + (ωH − ωC)2τC2] + 3τC/[1 + ωH2τC2] + 6τC/[1 + (ωH + ωC)2τC2] + 6τC/[1 + ωH2τC2]} | (2) |
![[thin space (1/6-em)]](https://www.rsc.org/images/entities/char_2009.gif) exp(−Ea/kBT), where τo, Ea, and kB denote the pre-correlation time, activation energy of the motions, and Boltzmann constant, respectively.33 As the magnitude of Ea depends on the molecular dynamics, we plotted on a logarithmic scale τC vs. 1000/temperature (inset of Fig. 8). Below TC2, Ea values for CH2-1 and CH2-2 are 13.66 ± 0.58 and 14.59 ± 0.72 kJ mol−1, respectively, and above TC1, Ea values for CH2-1 and CH2-2 are 30.34 ± 3.41 and 35.64 ± 2.16 kJ mol−1, respectively.
exp(−Ea/kBT), where τo, Ea, and kB denote the pre-correlation time, activation energy of the motions, and Boltzmann constant, respectively.33 As the magnitude of Ea depends on the molecular dynamics, we plotted on a logarithmic scale τC vs. 1000/temperature (inset of Fig. 8). Below TC2, Ea values for CH2-1 and CH2-2 are 13.66 ± 0.58 and 14.59 ± 0.72 kJ mol−1, respectively, and above TC1, Ea values for CH2-1 and CH2-2 are 30.34 ± 3.41 and 35.64 ± 2.16 kJ mol−1, respectively.
Static 14N NMR investigations of [NH3(CH2)3NH3]CdBr4 single crystal were conducted over the temperature range of 180–430 K. The 14N spectra obtained using the solid-state echo method by static NMR is shown in Fig. 9. Two 14N NMR signals were recorded from the quadrupole interactions due to the spin number I = 1. The lines with the same color below TC2 indicate the same pairs for 14N. Near 328 K (=TC2), the number of resonance lines and chemical shifts of the NMR spectrum showed abrupt changes. The changes in the 14N chemical shift as a function of temperature were attributed to variations in the structural geometry. The chemical shift of the 14N signals below TC2 exhibited almost continuous change, and it was difficult to observe the N signal due to the wider line width above the TC2 temperature. Near TC2, the electric field gradient tensors at N sites varied, reflecting changes in the atomic configuration around the nitrogen atom. The environment around 14N in the NH3 groups indicates that the change is large near TC2. Furthermore, at the temperature below TC2, two different 14N spectra were explained as follows. According to previously reported X-ray results,30 there are no reports related to two different N sites, whereas there are reports of twin domain observations; therefore, the two different N sites are attributed to the twin domain.
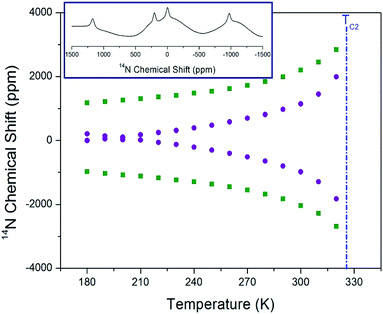 | ||
| Fig. 9 Static 14N chemical shifts of [NH3(CH2)3NH3]CdBr4 single crystal as a function of temperature (inset: 14N chemical shift at 180 K). | ||
Static 113Cd NMR experiments were employed to examine the structural environment in CdBr6 anions of the [NH3(CH2)3NH3]CdBr4 single crystal. The spectrum exhibits only one peak due to the spin of I = 1/2. 113Cd NMR spectra were obtained at several temperatures, as shown in Fig. 10. The NMR chemical shift was recorded using CdCl2O8·6H2O as the standard. At 300 K, the line width is 37.95 ppm. As shown in Fig. 10, the chemical shifts for 113Cd are almost constant for temperatures increasing from 180 to 410 K. This result indicates that the environment of the Cd atom surrounded by six Br atoms does not change with increasing temperature.
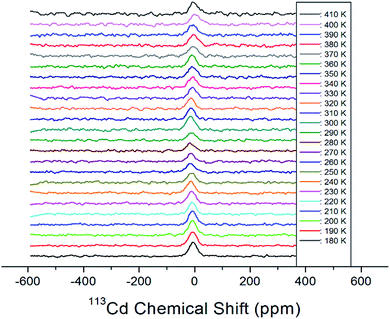 | ||
| Fig. 10 Static 113Cd chemical shifts of [NH3(CH2)3NH3]CdBr4 single crystal as a function of temperature. | ||
A crystal is ferroelastic when it has two or more orientation states in the absence of mechanical stress, and is capable to shift from one to another by mechanical stress. Several parallel lines representing ferroelastic twin domain walls are present at room temperature phase III (Fig. 11(a)), and we did not observe any changes to the domain pattern in phase II. The symmetry of phase II remains orthorhombic, and the domain wall is preserved (Fig. 11(b)). Similarly, the same domain pattern was observed in the monoclinic phase I (Fig. 11(c)). The twin boundary exists in the same direction at all temperatures. Here, the [NH3(CH2)3NH3]CdBr4 crystal exists in two crystallographic phases: monoclinic (2/m) above 363 K, orthorhombic (mmm) between 328 and 363 K, and orthorhombic (mmm) below 328 K. For the transition from the mmm of the orthorhombic phase to the 2/m of the monoclinic phase, the domain wall orientations were expressed as x = 0 and z = 0. According to Aizu36 and Sapriel,37 the equations of the twin domain walls are reflected the ferroelasticity of mmmF2/m. In this case, this corresponds to “inverse” mmmF2/m suggested by Prezeslawski et al.,14 unlike the mmmF2/m reported by Sapriel. Hence, our results support the mechanism of ferroelastic twin domains. Further, the two types of inequivalent 14N NMR lines are attributed to the ferroelastic twin domain structure.
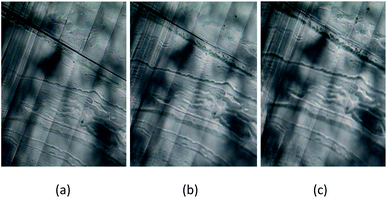 | ||
| Fig. 11 Ferroelastic domain wall patterns of [NH3(CH2)3NH3]CdBr4 crystal at (a) phase III (297 K), (b) phase II (333 K), and (c) phase I (383 K). | ||
IV. Conclusions
We considered the physical properties of organic–inorganic hybrid perovskite [(NH3)(CH2)3(NH3)]CdBr4 crystals. First, the structure and phase transition temperatures (328 K and 363 K) were confirmed by X-ray diffraction and DSC experiments, respectively. We found that the TGA curve exhibits stability until 557 K. Second, the 1H NMR chemical shifts of CH2 for crystallographic environments changed more significantly with temperature than those for NH3. At temperatures below TC2, the 13C chemical shifts change to a slightly upward chemical shift, whereas above TC1, the chemical shift hardly changes. Furthermore, the 14N chemical shift changes with temperature, whereas the 113Cd chemical shift is independent of it. This is because the environments around N change, while the 113Cd chemical shifts were not attributed to the rotation of CdBr6 octahedra. Finally, 1H T1ρ shows fast motion at low temperature and slow motion at high temperature, while 13C T1ρ shows molecular motion at low temperature and slow motion at high temperature. Shorter T1ρ values at high temperature indicate that 1H and 13C in the organic chains are more flexible at these temperatures.We compared the physical properties of the previously reported [(NH3)(CH2)3(NH3)]CdCl4 crystals,38 and those of [NH3(CH2)3NH3]CdBr4 examined in this study. This is summarized in Table 1. The decomposition temperature of [NH3(CH2)3NH3]CdBr4 is higher than that of [NH3(CH2)3NH3]CdCl4. In the two compounds, the tendency of the 1H and 13C T1ρ values in terms of the temperature change is very similar, while their activation energies are very different, as shown in Table 1; [NH3(CH2)3NH3]CdBr4 has a large Ea at high temperatures, whereas [NH3(CH2)3NH3]CdCl4 has a large Ea at low temperature. Notably, their 113Cd chemical shifts depend on the temperature change, which indicates the difference between the surrounding environments of CdBr6 and CdCl6 octahedra in the two compounds. Although the two crystals contain the same cations, the observed differences in structural dynamics obtained from the chemical shifts and T1ρ values of the two compounds can be attributed to the differences in halogen atoms Br− and Cl− surrounding of Cd. These results provide insights into the molecular dynamics of the [NH3(CH2)3NH3]CdBr4 crystals, and are expected to facilitate their potential applications.
| [NH3(CH2)3NH3]CdBr4 | [NH3(CH2)3NH3]CdCl4 | |
|---|---|---|
| Structure | Orthorhombic | Orthorhombic |
| Space group | Pnma | Pnma |
| Lattice constant | a = 7.711 | a = 7.34163 |
| b = 19.148 | b = 19.0300 | |
| c = 7.856 | c = 7.49273 | |
| TC | 328, 363, 557 | 375 |
| Td | 580 | 520 |
| 1H T1ρ | 280.16 (NH3 and CH3 at 300 K) | 411.53 (NH3 at 300 K) |
| 551.12 (CH2 at 300 K) | ||
| 13C T1ρ | 81.59 (CH2-1 at 300 K) | 37.13 (CH2-1 at 300 K) |
| 59.80 (CH2-2 at 300 K) | 29.13 (CH2-2 at 300 K) | |
| 1H Ea | 35.98 (phase I) | 25.36 (phase I) |
| 5.21 (phase III) | 8.37 (phase II) | |
| 13C Ea (CH2-1) | 30.34 (phase I) | 10.18 (phase I) |
| 13.66 (phase III) | 29.96 (phase II) | |
| 13C Ea (CH2-2) | 35.64 (phase I) | 8.45 (phase I) |
| 14.59 (phase III) | 39.94 (phase II) |
Conflicts of interest
There are no conflicts to declare.Acknowledgements
This research was supported by the Basic Science Research program through the National Research Foundation of Korea, funded by the Ministry of Education, Science, and Technology (grant numbers 2018R1D1A1B07041593 and 2016R1A6A1A03012069).References
- R. Kind, S. Plesko, P. Gunter, J. Ross and J. Fousek, Phys. Rev. B: Condens. Matter Mater. Phys., 1981, 23, 5301 CrossRef CAS.
- D. B. Mitzi, K. Chondroudis and C. R. Kagan, IBM J. Res. Dev., 2001, 45, 29 CAS.
- D. B. Mitzi, J. Chem. Soc., Dalton Trans., 2001, 1, 1 RSC.
- K. Pradeesh, J. J. Baumberg and G. Vijaya Prakash, Appl. Phys. Lett., 2009, 95, 173305 CrossRef.
- Z. Cheng and J. Lin, CrystEngComm, 2010, 12, 2646 RSC.
- K. Pradeesh, G. S. Yadav, M. Singh and G. Vijaya Prakash, Mater. Chem. Phys., 2010, 124, 44 CrossRef CAS.
- H.-Y. Zhang, X.-J. Song, H. Cheng, Y.-L. Zeng, Y. Zhang, P.-F. li, W.-Q. Liao and R.-G. Xiong, J. Am. Chem. Soc., 2020, 142, 4604 CrossRef CAS PubMed.
- X. Zhang, J.-X. Shen, M. E. Turiansky and C. G. Van de Walle, Nat. Mater., 2021, 60, 8198 Search PubMed.
- S. Saikumar, J. J. Ahmad, G. Baumberg and G. Vijaya Prakash, Scr. Mater., 2012, 67, 834 CrossRef.
- B. Staskiewicz, O. Czupinski and Z. Czapla, J. Mol. Struct., 2014, 1074, 723 CrossRef CAS.
- B. Staskieqicz, I. Turowska-Tyrk, J. Baran, Cz. Gorecki and Z. Czapla, J. Phys. Chem. Solids, 2014, 75, 1305 CrossRef.
- S. Ahmad, C. Hanmandlu, P. K. Kanaujia and G. Vijaya Prakash, Opt. Mater. Express, 2014, 4, 1313 CrossRef CAS.
- S. Gonzalez-Carrero, R. E. Galian and J. Perez-Prieto, Part. Part. Syst. Charact., 2015, 32, 709 CrossRef CAS.
- J. Prezeslawski, Z. Czapla, M. Crofton and S. Dacko, Ferroelectrics, 2018, 534, 220 CrossRef.
- H. Arend, K. Tichy, K. Baberschke and F. Rys, Solid State Commun., 1976, 18, 999 CrossRef CAS.
- S. Skaarup and R. W. J. Berg, Solid State Chem., 1978, 26, 59 CrossRef CAS.
- C. Sourisseau and G. Lucazeau, J. Raman Spectrosc., 1979, 8, 311 CrossRef CAS.
- H. von Kanel, Phys. B, 1979, 96, 167 CrossRef.
- C. Sourisseau, G. Lucazeau and A. J. Dianoux, J. Phys., 1983, 44, 967 CrossRef CAS.
- K. Chhor, J. F. Bocquet and C. Pommier, J. Chem. Thermodyn., 1985, 17, 379 CrossRef CAS.
- V. V. Eremenko, V. I. Fomin and V. S. Kurnosov, Phys. B, 1994, 194–196, 187 CrossRef CAS.
- J.-C. Bissey, N. Filloleau, N.-B. Chanh, R. Berger and S. Flandrois, Solid State Commun., 1998, 106, 385 CrossRef CAS.
- M. M. Bogdan, M. I. Kobets and E. N. Khats’ko, Low Temp. Phys., 1999, 25, 192 CrossRef CAS.
- I. M. Hermes, S. A. Bretschneider, V. W. Bergmann, D. Li, A. J. Klasen, W. Mars, F. Tremel, H.-J. Laquai, M. M. Butt, R. Berger, B. J. Rodriguez and S. A. L. Weber, J. Phys. Chem. C, 2016, 120, 5724 CrossRef CAS.
- E. Strelcov, Q. Dong, T. Li, J. Chae, Y. Shao, Y. Deng, A. Gruverman, J. Huang and A. Centrone, Sci. Adv., 2017, 3, e1602165 CrossRef PubMed.
- Y. Liu, L. Collins, R. Proksch, S. Kim, B. R. Watson, B. Doughty, T. R. Calhoun, M. Ahmadi, A. V. Levlev, S. Jesse, S. T. Retterer, A. Belianinov, K. Xiao, J. Huang, B. G. Sumpter, S. V. Kalinin, B. Hu and O. S. Ovchinnikova, Nat. Mater., 2018, 17, 1013 CrossRef CAS.
- D.-W. Fu, J.-X. Gao, P.-Z. Huang, R.-Y. Ren, T. Shao, L.-J. Han, J. Liu and J.-M. Gong, Angew. Chem., 2020, 59, 17477 CrossRef CAS PubMed.
- M. Elseman, A. E. Shalan, S. Sajid, M. M. Rashad, A. M. Hassan and M. Li, ACS Appl. Mater. Interfaces, 2018, 10, 11699–11707 CrossRef PubMed.
- J. A. Aramburu, P. Garcia-Fernandez, N. R. Mathiesen, J. M. Garcia –Lastra and M. Moreno, J. Phys. Chem. C, 2018, 122, 5071–5082 CrossRef CAS.
- B. Staskiewicz and A. Staskiewicz, J. Phys. Chem. Solids, 2017, 106, 65 CrossRef CAS.
- H. Ishihara, S.-Q. Dou, K. Horiuchi, V. G. Krishnan, H. Paulus, H. Fuess and Al. Weiss, Z. Naturforsch., A: Phys. Sci., 1996, 51, 1216 CrossRef CAS.
- H. Ishihara, K. Horiuchi, K. Yamada, T. Okuda, V. G. Krishnan and Al. Weiss, Chem. Lett., 1996, 371 CrossRef CAS.
- A. Abragam, The Principles of Nuclear Magnetism, Oxford University Press, 1961 Search PubMed.
- J. L. Koenig, Spectroscopy of Polymers, Elsevier, New York, 1999 Search PubMed.
- R. K. Harris, Nuclear Magnetic Resonance Spectroscopy, Pitman Pub., UK, 1983 Search PubMed.
- K. Aizu, Phys. Rev. B: Solid State, 1970, 2, 754 CrossRef.
- J. Sapriel, Phys. Rev. B: Solid State, 1975, 12, 5128 CrossRef CAS.
- A. R. Lim, J. Solid State Chem., 2021, 295, 121909 CrossRef CAS.
| This journal is © The Royal Society of Chemistry 2021 |

