 Open Access Article
Pyrolysis of a typical low-rank coal: application and modification of the chemical percolation devolatilization model
Tong Lv ab,
Mengxiang Fang
 *ab,
Huaixiang Liab,
Jiqing Yanab,
Jianmeng Cen
 ab,
Zhixiang Xiaab,
Jianglei Tianab and
Qinhui Wang
 ab
ab
aState Key Laboratory of Clean Energy Utilization, Zhejiang University, Hangzhou 310027, P. R. China. E-mail: mxfang@zju.edu.cn
bEnergy Research Base, Zhejiang University, Qingshanhu, Lin'an, Hangzhou 311300, P. R. China
First published on 18th May 2021
Abstract
The chemical percolation devolatilization (CPD) model can simulate the formation of various products during the coal pyrolysis process and predict the products composition relatively accurately. In this study, the pyrolysis products of a typical low-rank coal were calculated using the CPD model, and several model improvements were proposed by combining the experimental results in a lab-scale pyrolysis system. The chemical structural parameters calculated from the Genetti correlations were verified by adjusting the initial fraction of char bridges (c0) from 0.098 to 0.25. A yield difference (Δftar) was defined in this paper to analyze the consumption of tar fragments in the model, and it was found that the deviations between experiments and calculations resulted from the weak influence of crosslinking. A modification expression was adopted to amplify the tar consumption:  , which improved the accuracy of the model on the tar yield with errors of less than ±0.5 wt%. Furthermore, this paper also developed a correlation in an exponential form about gas composition, which attempted to extend the application of the CPD coalification reference mesh for the coal away from interpolation triangles. The improved model by the correlation predicted CH4, CO, and CO2 yields for this typical low-rank coal accurately in most cases. Compared with the original CPD model, the modified model showed better agreement with the experimental results and predicted 71.4% and 88.6% of the data points in this work within ±10% and ±20% errors, respectively.
1. Introduction
Pyrolysis is an effective and mild coal conversion process. The poly-generation technology based on coal pyrolysis can produce many valuable products such as high-calorific pyrolysis gas, upgraded coal tar, and clean solid fuel char or coke, which will realize multi-level efficient utilization of coal resources.1,2 The products of coal pyrolysis are affected by various factors, including coal type, temperature, pressure, particle size, heating rate, atmosphere and residence time.3 By investigating different experimental conditions, the establishment of a coal pyrolysis kinetics model will be helpful to predict the composition distribution of pyrolysis products more accurately.4,5Generally, kinetics models of coal pyrolysis involve global and network models.6 Early research on coal pyrolysis models mainly started from simplified mechanisms and proposed global models based on one-step reaction, two-step competitive reactions, or multi-stage finite parallel reactions.7 With the development of analysis and testing technology, characterization methods such as 13C-NMR, TG-FTIR, and Py-FIMS have been increasingly used in the study of coal structures. These technologies provide the accessibility for researchers to deeply understand the chemical structures of coal molecular networks. Until now, the most widely accepted three types of coal pyrolysis network models are the functional group-depolymerization, vaporization, cross-linking (FG-DVC) model,8,9 the FLASHCHAIN model,10 and the chemical percolation devolatilization (CPD) model.11–13 These network models describe the generation of product precursors of char, tar, and light gas through simplified coal chemical structures and grid statistics, while having different characteristics in terms of network hypothesis and bond breaking reactions during pyrolysis.
The CPD pyrolysis model developed by Grant et al.11–13 has gained wide international acceptance in the past 30 years owing to its advantages of good comprehensibility, fast calculation speed, and wide applicability.14 In this model, coal is assumed to be an array of aromatic structural units connected by aliphatic bridges. The analytical relationships between bridge scission and fragment fraction were obtained by introducing two-dimensional Bethe lattice percolation statistics. By combining the flash distillation model based on vapor pressure correlations and the crosslinking mechanism of non-vaporized fragments, the mass fractions of char, tar and light gas could be calculated. The structural parameters required for the model can be obtained either from the 13C-NMR analysis of coal samples13,15 or the correlations based on proximate and ultimate analyses.16 In addition to the applications of coal pyrolysis, the concepts in the CPD model have been extended for other fuels, including biomass,17 oil shale,18 asphalt,19 black liquor,20 and scrap tyres21 by adjusting the kinetic parameters or several modification mechanisms.
In this paper, the CPD model was applied to calculate the pyrolysis products for a typical Chinese low-rank coal. The product composition of this coal was also investigated using a small pyrolysis experimental system. By combining the results from experiments and model calculations, the structural parameter and related mechanisms in the original CPD model were modified and improved in this work, which made an attempt to provide a reference for the utilization of the CPD model in a wider range.
2. Experimental and modelling
2.1 CPD model
It is generally believed that the organic part of coal consists of complex macromolecular polymeric substances whose cores are condensed aromatic structures.22 The condensed aromatic rings are interconnected by various non-aromatic bridge bonds, and there may exist several alkyl side chains or functional groups attached to them. In the CPD model, one site is adopted to represent a fused aromatic ring and coal is assumed to be an array of aromatic structural sites. The coordination number σ + 1 is defined as the number of attachments (i.e., bridges and side chains) per aromatic cluster. The bridges in coal are categorized into char and labile bridges, denoted by c and b respectively, and p represents the fraction of intact bridges in the assumed coal Bethe lattices (i.e., p = b + c). During pyrolysis, the char bridges can remain intact while the labile bridges are the positions where reactions start first. For the coherence of symbols in this paper, the letter b is used to represent labile bridges instead of £ used in original CPD papers.11–14As shown in Fig. 1(a), the pyrolysis reactions in the CPD model start with the activation of labile bridges. The breaking of chemical bonds in a labile bridge results in the generation of a reactive bridge intermediate (b*), which reacts rapidly in two competitive pathways. The intermediate may be stabilized to form two side chains (i.e., pathway 1) which will gradually break away to produce light gas through slower reactions in the subsequent pyrolysis process, or released as light gas directly (i.e., pathway 2) with the relinking of two associated sites to form a stable char bridge. The ki values (i = b, c, δ, g) represent the Arrhenius rate constants for the different reactions. All the reactions are described with first-order kinetics with distributed activation energies, and a competition coefficient is defined as the ratio of the reaction rate of the two parallel reactions: ρ = kδ/kc. Combining mass conservation and initial conditions, the values of b, δ, c, g1, g2 and g (= g1 + g2) at every moment can be calculated using numerical methods.11,12
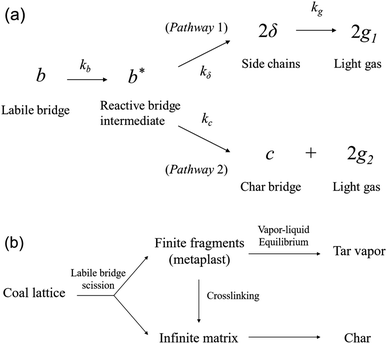 | ||
| Fig. 1 Reaction mechanisms in the CPD model: (a) bridge reaction and (b) tar formation6 (adapted with permission from Elsevier © 2015). | ||
It should be noted that the molecular fragments with a finite number of sites derived from bridge scission in the model correspond to the tar precursors formed during pyrolysis, while the infinite matrix corresponds to the precursor of coal char, as shown in Fig. 1(b). The analytical relationships between bridge scission and fragment fraction can be obtained using Bethe lattice percolation statistics, which will be helpful for the calculation of the mass fraction of light gas and fragments during pyrolysis. In the CPD model, it is assumed that the fragments produced by bridge breaking undergo rapid flash distillation.12 The fragments released into the vapor phase form coal tar, while non-vaporized fragments are temporarily saved as metaplast in the liquid phase.13 The tar yield is the sum of all fragment fractions in the gas phase, while the metaplast will continue the vapor–liquid equilibrium process at the next moment, or crosslink to the char matrix back stably as shown in Fig. 1(b). The final char yield is the part of the pyrolysis products deducting tar and light gas.
2.2 Pyrolysis experimental
Pingshuo (PS) bituminous coal from Shanxi Province in China was selected as the test sample in this work. Before the experiments, the coal sample was crushed and sieved to a particle size of 0.096–0.15 mm, and dried at 105 °C for 4 h. The proximate and ultimate analyses of the coal samples are presented in Table 1.The experiments were carried out on a lab-scale pyrolysis system, as shown in Fig. 2, which contained gas supply devices, a reaction furnace, and products collection and measurement devices. The reactor consisted of a horizontal tube furnace with a program temperature control and a quartz reaction tube with a length of 700 mm and an inner diameter of 44 mm. Pure N2 (>99.99 vol%) was chosen as the carrier gas in this system at a flow rate of 400 mL min−1. The liquid products were captured by the coil condensers in a cold trap at −10 °C. The volume of the pyrolysis gas was measured by a wet gas flowmeter. Gaseous products were dried in a bottle filled with silica gel balls, and sent to a gas chromatography for component analysis after collection with a gas bag.
The 10 g coal sample was placed in a quartz boat on one side of the quartz reaction tube before the experiment. The reactor was first purged with N2 for at least 20 min to remove air from the system. After the temperature reached the set value, the quartz boat with the coal sample was pushed into the center of the reaction zone in the tube furnace. The sample was heated rapidly to the desired temperature (500, 600, 700, 800, and 900 °C) and kept for 15 min. After the pyrolysis reaction, the heat source of the furnace was turned off and the N2 atmosphere was still maintained until the pyrolysis products were cooled to room temperature.
The char yield was measured from the weight difference of the quartz boat before and after each experiment. The liquid products included tar and water, and the total yield was calculated by the weight difference of the entire tar capture system. After washing with acetone, the tar and water in the trap were collected in a conical flask with a cover. The water content of the mixed liquid was determined using a Karl-Fischer moisture meter (ZDJ-3S). The weight of tar was obtained by subtracting the weight of the water from the total liquid products. The composition of the gaseous products was analyzed with GC Agilent 7890A. Detailed descriptions of the experimental method are available in our previous work.23,24
The yields of the different pyrolysis products on a dry ash-free basis were obtained from eqn (1)–(5):
 | (1) |
 | (2) |
 | (3) |
 | (4) |
 | (5) |
2.3 Application of the CPD model
The input parameters for the model consist of nine kinetic parameters and five chemical structural parameters. For temperatures no higher than 1500 K and heating rates ranging from 1 K s−1 to 104 K s−1, it was verified by many experiments that the nine kinetic parameters were independent for coal type and showed good agreement between the predicted and measured devolatilization rates,26 as listed in Table 2.| Parameters | Values | Description |
|---|---|---|
| Eb | 231.9 kJ mol−1 | Bridge scission activation energy |
| σb | 5.0 kJ mol−1 | Bridge scission standard deviation |
| Ab | 2.6 × 10¹⁵ s−1 | Bridge scission pre-exponential factor |
| Eg | 288.9 kJ mol−1 | Gas release activation energy |
| σg | 33.9 kJ mol−1 | Gas release standard deviation |
| Ag | 3.0 × 10¹⁵ s−1 | Gas release pre-exponential factor |
| ρ | 0.9 | Competition coefficient |
| Ecross | 272.1 kJ mol−1 | Crosslinking activation energy |
| Across | 3.0 × 10¹⁵ s−1 | Crosslinking pre-exponential factor |
The five chemical structural parameters related to coal types in the CPD model include the average coordinate number σ + 1, the average molecular weight of aromatic clusters Mclust and side chains Mδ, and the initial fraction of intact bridges p0 and labile bridges c0. The first four structural parameters for PS coal in this work were determined using the Genetti et al.16 correlation, which was developed from the 13C-NMR data and the ultimate and proximate analyses of parent coals:
| S = c1 + c2C + c3C2 + c4H + c5H2 + c6O + c7O2 + c8V + c9V2 | (6) |
| S | Mδ | Mclust | p0 | σ + 1 |
|---|---|---|---|---|
| c1 | 421.957 | 1301.41 | 0.48981 | −52.1054 |
| c2 | −8.64692 | 16.3879 | −0.00982 | 1.63872 |
| c3 | 0.04639 | −0.18749 | 0.000133 | −0.01075 |
| c4 | −8.47272 | −454.773 | 0.155483 | −1.23688 |
| c5 | 1.18173 | 51.7109 | −0.02439 | 0.093194 |
| c6 | 1.15366 | −10.072 | 0.007052 | −0.16567 |
| c7 | −0.0434 | 0.076083 | 0.000219 | 0.004096 |
| c8 | 0.55677 | 1.36022 | −0.01105 | 0.009261 |
| c9 | −0.00655 | −0.03136 | 0.000101 | −8.267 × 10⁻⁵ |
The initial fraction of char bridges c0 is the only empirical value among the five structural parameters, which cannot be obtained from the measurements. For most coal types, it is in the range of 0 to 0.36. The high bond energy chemical structures contribute to a large value of c0 in high-rank coals, while the values of c0 in low-rank coals are related to early crosslinking.26 A similar correlation was also developed based on the carbon and hydrogen content to calculate the recommended value,16 as shown in eqn (7), where the first and second items are applied to high- and low-rank coals, respectively. Meanwhile, an adjustment may be required during the practical utilization of the CPD model.14,19,27,28
c0 = min{0.36, max[0.118C − 10.1,![[thin space (1/6-em)]](https://www.rsc.org/images/entities/char_2009.gif) 0]} 0]} ![[thin space (1/6-em)]](https://www.rsc.org/images/entities/char_2009.gif) + min{0.15, max[0.014O − 0.175, 0]} + min{0.15, max[0.014O − 0.175, 0]}
| (7) |
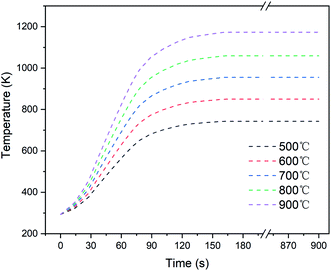
Furthermore, the required temperature profiles of the coal samples for the CPD model were measured with an armor thermocouple in the pre-experiments, as shown in Fig. 3. The temperature of the coal sample rose rapidly in the first two minutes and then increased gradually to a steady value. Owing to the heat loss and thermal resistance of the quartz boat, the steady-state temperature averages in each condition were slightly lower than the set values.
3. Results and discussion
3.1 Experimental results
The experimental results of the pyrolysis product composition for PS coal are presented in Table 4. The experiment under each condition was repeated three times and all results were averaged with a relative error of less than ±2%. The volumes of all gaseous products were measured at room temperature and pressure (293 K, 101 kPa).| T (°C) | Char (wt%) | Tar (wt%) | Water (wt%) | CH4 (mL g−1) | H2 (mL g−1) | CO (mL g−1) | CO2 (mL g−1) | C2–C3 (mL g−1) | Others (mL g−1) | Gas total (mL g−1) |
|---|---|---|---|---|---|---|---|---|---|---|
| 500 | 77.73 | 3.84 | 7.19 | 6.15 | 1.05 | 3.91 | 3.58 | 0.34 | 1.73 | 16.56 |
| 600 | 67.96 | 5.17 | 9.33 | 20.27 | 12.21 | 9.77 | 8.92 | 3.91 | 5.58 | 60.65 |
| 700 | 60.58 | 4.22 | 11.36 | 32.54 | 52.22 | 20.78 | 27.11 | 30.54 | 9.64 | 172.84 |
| 800 | 58.61 | 3.65 | 12.06 | 38.93 | 106.70 | 37.04 | 30.93 | 37.53 | 14.25 | 265.38 |
| 900 | 56.24 | 3.09 | 11.09 | 43.22 | 164.51 | 58.00 | 37.17 | 75.48 | 22.73 | 404.11 |
With increasing pyrolysis temperature, the decomposition of organic matter in coal is gradually completed, and the content of residual volatile matter in the solid decreases. The char yield decreases from 77.73 wt% at 500 °C to 56.24 wt% at 900 °C, while the gas yield increases from 16.56 mL g−1 to 404.11 mL g−1. However, the tar yield increases first and then declines with temperature, reaching a maximum value of 5.17 wt% at 600 °C. The secondary cracking and polycondensation reactions for tar fragments at high temperatures, especially above 700 °C, contributes to the drop of tar yield.23 The water yield is almost stable at the temperatures higher than 700 °C and the maximum 12.06 wt% appears at 800 °C. In the composition of the pyrolysis gas, CH4 accounts for the highest proportion at temperatures below 600 °C. Because of the dehydrogenation polycondensation reactions of aromatic structures in coal at high temperature,24 the hydrogen yield increases significantly and takes up the highest percentage instead of methane above 700 °C.
3.2 Structural parameters verification
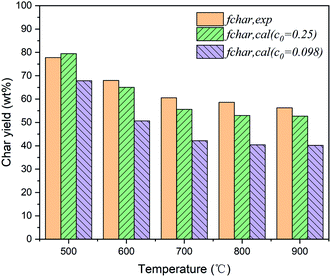
The original and modified structural parameters for PS coal are listed in Table 5, and the reasons for modification are mainly discussed in the next two paragraphs. According to the input conditions above, the mass fractions of the solid product (i.e., char yield fchar) at different temperatures were calculated using the CPD model, as presented in Fig. 4.| Parameters | Mδ | Mclust | p0 | σ + 1 | c0 |
|---|---|---|---|---|---|
| Original value | 37.2 | 383.6 | 0.64 | 5.36 | 0.098 |
| Modified value | 37.2 | 383.6 | 0.64 | 5.36 | 0.25 |
It can be seen from Fig. 4 that the recommended value for the initial fraction of char bridges from eqn (7) (i.e., original value c0 = 0.098) cannot accurately describe the devolatilization characteristics of this coal. The calculated values of char yield are always lower than the experimental values in the entire temperature range, and the deviation is over 15 wt% above 600 °C.
A similar phenomenon was also observed in previous studies that the total yield of volatile products in the model was notably higher than expected. Bai et al.28 investigated the pyrolysis characteristics of Shaanxi long-flame coal and found that the optical value of c0 should be improved from 0 to 0.21. Cheng et al.19 conducted a series of thermogravimetric experiments for asphalt with high volatile matter, and the results indicated that the c0 value was supposed to be modified from 0 to 0.27. It was found that the bridge bonds of organic matter in low-rank coals were partly crosslinked before the devolatilization process,16 which limited the number of chemical bonds to be activated during pyrolysis as well as the total yield of volatile products. Consequently, it can be inferred that the suitable value of c0 is probably higher than the result calculated by eqn (7) for low-rank coals. Namely, the increase in the initial fraction of char bridges can provide an approach to achieve satisfactory predictions when the yield of total volatile products is overestimated by the CPD model. In this study, a series of attempts were made by gradually increasing the c0 value, and it was observed that a good agreement was obtained when c0 was improved from 0.098 to 0.25, as shown in Fig. 4. The char yield deviations between the model calculated and experimental results were significantly reduced after modification and were always within ±5 wt% at 500–900 °C. Therefore, the only adjustable input parameter in the CPD model was confirmed and the other four structural parameters remained unchanged, as shown in Table 5.
3.3 Tar yield and crosslinking
The pyrolysis tar yields of PS coal from model calculations (ftar,exp) and experiments (ftar,cal) are compared in Fig. 5(a). As the temperature rises, the tar yield calculated by the CPD model increases steadily to a specific value, while it does not show a tendency to increase first and then decrease, as in experimental results.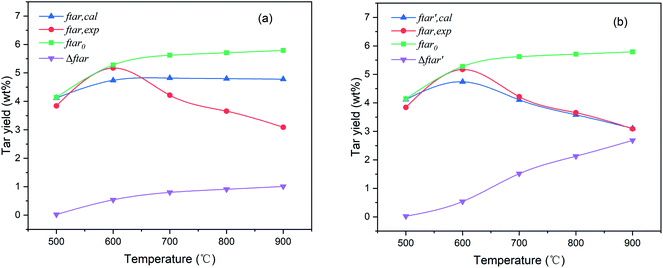 | ||
| Fig. 5 Comparison of calculated and experimental results of tar yield: (a) unmodified, (b) modified. | ||
In the CPD model, only two kinetic parameters, the activation energy (Ecross) and the pre-exponential frequency factor (Across) of crosslinking, were used to describe the effect of the secondary reaction on the tar yield. To further analyze the discrepancy between the calculated and experimental results, the curve of the tar yield without crosslinking (ftar0) is also presented in Fig. 5(a). In this case, the crosslinking activation energy was presumed to be infinite, so that no fragments could reconnect to the char matrix. This curve is at the top of Fig. 5(a) with no turning point in the entire temperature range. With the temperature rising from 500 °C to 900 °C, the tar yield without crosslinking increased continuously from 4.14 to 5.79 wt%. However, the recombination between tar precursors and char (or tar precursors themselves) was inevitable during pyrolysis, which would consume the number of fragments and cause the tar yield to decrease. Therefore, a yield difference (Δftar) was defined to evaluate the consumption of tar fragments which was equal to the displacement of the tar yield with or without crosslinking. It can be found from Fig. 5(a) that although the trend of Δftar was still increasing with temperature, the rate was quite low especially above 700 °C. The increment of consumption rate did not match the growth rate, the tar yield continued to increase slightly with the pyrolysis temperature in the model.
From the discussion above, the deviation in tar yield was derived from the relatively weak influence of crosslinking in the CPD model. To improve the prediction of the model about the pyrolysis products, a modification was developed in this study to amplify the crosslinking effect:
 | (8) |
 is a modified value of Δftar, and the two items in brackets correspond to the tar consumption at low and high temperatures respectively. Namely, the crosslinking mechanism in the original CPD model will still be used at a low pyrolysis temperature,
  , while an alternative expression is applied to describe the tar consumption at high temperature,
  .
.
Thus, the tar yield in the modified model  is:
is:
 | (9) |
Since crosslinking does not affect the release of light gas, the char yield needs to be adjusted accordingly for mass conservation:
 | (10) |
The effect of crosslinking on the tar yield in the modified CPD model is shown in Fig. 5(b). In contrast to Fig. 5(a), it can be seen that the tar consumption in the crosslinking has been improved, and a good agreement was obtained between the experimental and calculated values after modification. The maximum tar yield was also observed at 600 °C. In the temperature range of 500–900 °C, the error of the tar yield in the modified CPD model was always within ±0.5 wt% and it decreased with increasing temperature, even falling below ±0.1 wt% above 700 °C. Likewise, the trend of  in Fig. 5(b) also shows that the crosslinking greatly inhibits the release of tar particularly at temperatures above 700 °C during the devolatilization process of coal pyrolysis.
3.4 Gas composition
The composition of coal pyrolysis gas is quite complicated and it is also desirable to predict the information about gas components as accurately as possible. It is generally believed that the release of various light gases originates from the decomposition of functional groups in coal. For example, CO corresponds to the decomposition of ether, methoxy, and carbonyl; CH4 corresponds to the methyl and methoxy groups; while CO2 corresponds to the carboxyl, ester group, and carbonate.25 In order to conveniently predict the content of each component in the pyrolysis gas, Genetti29 developed a simple triangular interpolation method as an extension to the CPD model. In this method, the major components of light gases are divided into five types, H2O, CH4, CO, CO2, and others. The experimental results of twelve typical coals were collected from Solomon et al.30 and Chen et al.,31 and a two-dimensional reference mesh was developed based on the element contents on a dry ash-free basis of these 12 coals, as shown in Fig. 6. For other coal samples, only the H/C and O/C molar ratios were required to determine the position in the mesh, and the predicted results could be obtained from the weighted average of the light gas compositions of the three vertex coals in the triangle. The extent of light gas release (Xgas) was defined as the ratio of the gas yield to its maximum, as follows, and a series of lookup tables for it have been established with these 12 coals in the extended CPD model.
 | (11) |
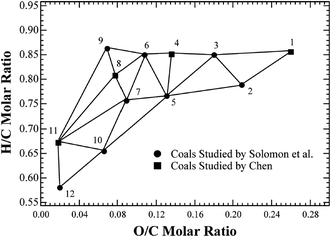 | ||
| Fig. 6 Reference mesh of pyrolysis gas components in the coalification diagram. Coals: (1) Dietz, (2) Beulah-Zap, (3) Wyodak, (4) Illinois No. 6(I), (5) Illinois No. 6(II), (6) Utah Blind Canyon, (7) Lewis Stockton, (8) Pittsburgh No. 8, (9) York Canyon, (10) Upper Freeport, (11) Lower Kittanning, and (12) Pocahontas No. 3.14 (Reprinted with permission from American Chemical Society © 2019.) | ||
Therefore, the gas composition in the extended CPD model is obtained from the interpolation of the coal types and the extent of light gas release. This convenient method will still be applied in this work. It should be noted that the pyrolysis water in this experimental system was collected by condensation, and the following discussion of gas composition will not include water to ensure the consistency between the model and experiments.
From the ultimate analysis of PS coal in Table 1, the coordinates of the H/C and O/C molar ratios were not located inside any interpolation triangle. Nevertheless, the nearest node in the mesh can provide a rough reference in most cases. Considering the experimental results in Table 4, the gas yield shows an exponential growth trend approximately with temperature. Thus, a correlation in exponential form was developed for the yield of CH4, CO, and CO2 based on the nearest node, as follows:
 | (12) |
| CH4 | CO2 | CO | |
|---|---|---|---|
| R1 | 0.1709 | 0.0162 | 0.3833 |
| R2 | 1.4178 | 0.4757 | 0.1956 |
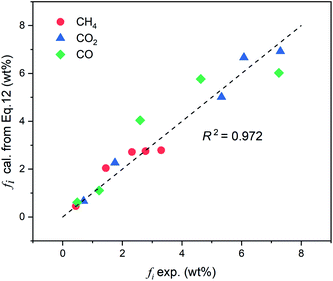
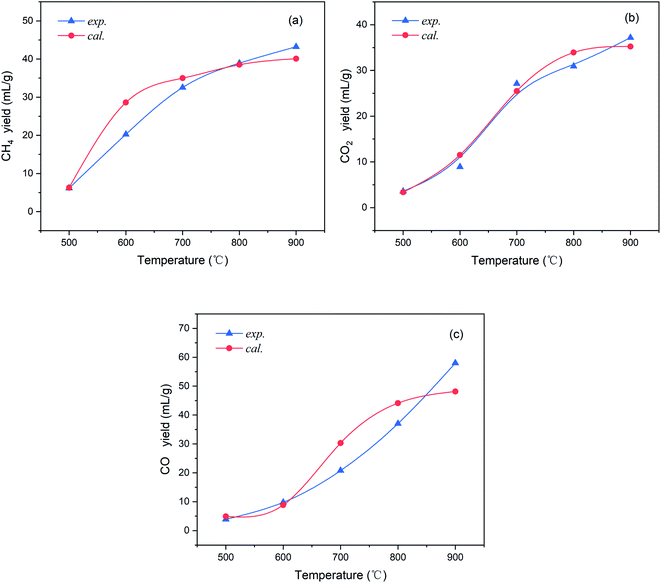
Fig. 7 shows a comparison of the gas yields between the experimental and calculated values. It can be observed that the yields of these three gases calculated from the correlation show good agreement with the experimental results (setting y = x, R2 = 0.972), and most of the calculated data points are close to the true values. For a clearer comparison, the trends of the CH4, CO2, and CO yields (in mL g−1) with the pyrolysis temperature from the correlation and experiments are presented in Fig. 8(a–c) respectively.
As seen in Fig. 8, the trends of the three pyrolysis gas yields calculated by the correlation are consistent with the experimental values at 500–900 °C. Among them, the CO2 yield shows the best agreement and the deviations are always less than ±3 mL g−1 throughout the temperature range. The calculated value of CH4 yield is relatively overestimated at approximately 600 °C, while, otherwise, the errors are all within an acceptable range. The CO yield has a deviation no greater than ±10 mL g−1 above 700 °C, and the error is very small at temperatures lower than 600 °C. In summary, the extension of the CPD model by the correlation shows good accuracy for the light gas composition of this coal.
3.5 Evaluation of the modified CPD model
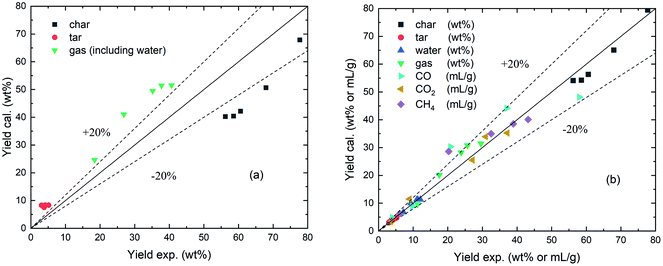
In this study, the CPD model was optimized with an adjustment of structural parameter, an amplified crosslinking mechanism, and a correlation of gas composition. The parameters adjustment was with respect to the total yield of volatile products, and the crosslinking modification with respect to the tar yield. In addition, the gas composition correlation was mainly related to the extension and supplement to the coalification reference mesh. Fig. 9 presents a comparison between the original and modified CPD models for the pyrolysis products of PS coal. As shown in Fig. 9(a), the original CPD shows moderate consistency with the experimental results overall, while the relative errors are over ±20% in most cases. Fig. 9(b) shows the calculated yields from the modified CPD model versus the experimental data. The gas components are also included in the same coordinate as the unit mL g−1 for a suitable distribution of data points in the figure. It can be seen that the modified model shows better agreement for the pyrolysis products including char, tar, water, gas, CO, CO2, and CH4. It predicted 71.4% and 88.6% of the data points in this work within ±10% and ±20% errors, respectively, and the mean relative error is only 4.2%. For the yields of char, tar and water, the deviations of the modified CPD model are always less than 4.5, 0.5 and 0.8 wt%, respectively. Moreover, the deviations for gas component yields are less than 3.2 mL g−1 in over 70% of cases. Thus, it can be concluded that the modifications in this paper not only improved the accuracy but also serve as a good attempt to extend the CPD model.4. Conclusions
The pyrolysis products of a typical low-rank coal were calculated using the CPD model. In addition, the product distribution of this coal was obtained on a lab-scale pyrolysis system. Several improvements of the CPD model were developed by comparing the results of the model calculations and experiments. The main conclusions are as follows:(1) The chemical structural parameters were verified by the experimental results by adjusting the initial fraction of char bridges c0 from 0.098 to 0.25. It can be concluded that the appropriate values of this parameter in the CPD model should be increased if an excessive yield of volatile products is observed for fuels with high volatile matter content.
(2) The formation of tar during pyrolysis is derived from the fragments produced by the breaking of bridge bonds. The release trend of tar calculated by the original CPD model deviated from the experimental data, which resulted from the relatively weak influence of crosslinking on the tar consumption. A modification was made to amplify the consumption of tar fragments in this study, and the modified CPD model showed good agreement with the experimental tar yield with errors less than ±0.5 wt% over the entire temperature range.
(3) The interpolation mesh method of gas composition effectively extended the applicable range of the CPD model for different coal types. A correlation in exponential form was developed to match the model with the experimental data for the coal away from the reference mesh. The CPD model improved by the correlation predicted the yield of CH4, CO, and CO2 for PS coal accurately in most cases.
(4) Compared with the original CPD model, the modified model improved the prediction accuracy for coal pyrolysis products including char, tar, water, gas, CO, CO2, and CH4, and provided a reference for the application of the CPD model over a wider range of conditions.
Nomenclature
| A | Ash content |
| Ai | Pre-exponential factor (i = b, c, δ, g, cross), s−1 |
| b | Labile bridge |
| b* | Reactive bridge |
| c | Char bridge |
| c0 | Initial fraction of char bridges |
| ci | Coefficients of structural parameters (i = 1–9) |
| cal | Calculated |
| cross | Crosslinking |
| Ei | Activation energy (i = b, c, δ, g, cross), kJ mol−1 |
| exp | Experimental |
| f | Mass fraction |
| f′ | Modified mass fraction |
| f# | Mass fraction calculated from the reference coal |
| FC | Fixed carbon content |
| g1, g2, g | Light gas released from pathway 1, 2 and both |
| ki | Rate constants (i = b, c, δ, g, cross), kJ mol−1 |
| M | Molecular weight or moisture content |
| p | Intact bridge |
| p0 | Initial fraction of intact bridge |
| R1, R2 | Modification coefficients |
| S | Structural parameters |
| T | Temperature, K |
| V | Volatile matter; or volume, mL |
| W | Weight, g |
| x | Volume fraction |
| X | Extent of light gas release |
| Y | Yield, mL g−1 or wt% |
| ρ | Competition coefficient |
| σ | Standard deviation, kJ mol−1 |
| σ + 1 | Coordination number |
Subscripts
| clust | Aromatic cluster |
| cross | Crosslinking |
| δ | Side chain |
Conflicts of interest
The authors declare that there are no conflicts of interest.Acknowledgements
This work was supported by the National Key R&D Program of China (2018YFB0605000).References
- M. Wang, L. Jin, H. Zhao, X. Yang, Y. Li, H. Hu and Z. Bai, In situ catalytic upgrading of coal pyrolysis tar over activated carbon supported nickel in CO2 reforming of methane, Fuel, 2019, 250, 203–210 CrossRef CAS.
- Z. Zhang, H. Chang, T. Gao, T. Lan, J. Zhang, M. Sun, L. Xu and X. Ma, Catalytic upgrading of coal pyrolysis volatiles over metal-loaded HZSM-5 catalysts in a fluidized bed reactor, J. Anal. Appl. Pyrolysis, 2019, 139, 31–39 CrossRef CAS.
- L. Liang, W. Huang, F. Gao, X. Hao, Z. Zhang, Q. Zhang and G. Guan, Mild catalytic depolymerization of low rank coals: a novel way to increase tar yield, RSC Adv., 2015, 5, 2493–2503 RSC.
- A. P. Richards, C. Johnson and T. H. Fletcher, Correlations of the elemental compositions of primary coal tar and char, Energy Fuels, 2019, 33, 9520–9537 CrossRef CAS.
- X. Liang, Q. Wang, Z. Luo, H. Zhang, K. Li, Y. Feng, A. R. Shaikh and J. Cen, Simulation of nitrogen transformation in pressurized oxy-fuel combustion of pulverized coal, RSC Adv., 2018, 8, 35690–35699 RSC.
- Q. Guan, D. Bi, W. Xuan and J. Zhang, Kinetic model of hydropyrolysis based on the CPD model, Fuel, 2015, 152, 74–79 CrossRef CAS.
- T. H. Fletcher and A. P. Richards, A comparison of simple global kinetic models for coal devolatilization with the CPD model, Fuel, 2016, 185, 171–180 CrossRef.
- P. R. Solomon, D. G. Hamblen, R. M. Carangelo, M. A. Serio and G. V. Deshpande, Models of tar formation during coal devolatilization, Combust. Flame, 1988, 71, 137–146 CrossRef CAS.
- P. R. Solomon, D. G. Hamblen, R. M. Carangelo, M. A. Serio and G. V. Deshpande, General model of coal devolatilization, Energy Fuels, 1988, 2, 405–422 CrossRef CAS.
- S. Niksa and A. R. Kerstein, Flashchain theory for rapid coal devolatilization kinetics. 1. Formulation, Energy Fuels, 1991, 5, 647–665 CrossRef CAS.
- D. M. Grant, R. J. Pugmire, T. H. Fletcher and A. R. Kerstein, Chemical model of coal devolatilization using percolation lattice statistics, Energy Fuels, 1989, 3, 175–186 CrossRef CAS.
- T. H. Fletcher, A. R. Kerstein, R. J. Pugmire and D. M. Grant, Chemical percolation model for devolatilization. 2. Temperature and heating rate effects on product yields, Energy Fuels, 1990, 4, 54–60 CrossRef CAS.
- T. H. Fletcher, A. R. Kerstein, R. J. Pugmire, M. S. Solum and D. M. Grant, Chemical percolation model for devolatilization 3. Direct use of 13C NMR data to predict effects of coal type, Energy Fuels, 1992, 6, 414–431 CrossRef CAS.
- T. H. Fletcher, Review of 30 years of research using the chemical percolation devolatilization model, Energy Fuels, 2019, 33, 12123–12153 CrossRef CAS.
- M. S. Solum, R. J. Pugmire and D. M. Grant, 13C solid-state NMR of Argonne-premium coals, Energy Fuels, 1989, 3, 187–193 CrossRef CAS.
- D. Genetti, T. H. Fletcher and R. J. Pugmire, Development and application of a correlation of 13C NMR chemical structural analyses of coal based on elemental composition and volatile matter content, Energy Fuels, 1999, 13, 60–68 CrossRef CAS.
- K. Wan, Z. Wang, Y. He, J. Xia, Z. Zhou, J. Zhou and K. Cen, Experimental and modeling study of pyrolysis of coal, biomass and blended coal-biomass particles, Fuel, 2015, 139, 356–364 CrossRef CAS.
- T. H. Fletcher, D. Barfuss and R. J. Pugmire, Modeling light gas and tar yields from pyrolysis of Green River oil shale demineralized kerogen using the chemical percolation devolatilization model, Energy Fuels, 2015, 29, 4921–4926 CrossRef CAS.
- Y. Cheng, T. Li, H. An, Y. Li and Y. Cheng, Modeling pyrolysis of asphalt using chemical percolation devolatilization theory, Fuel, 2017, 206, 364–370 CrossRef CAS.
- T. H. Fletcher, H. R. Pond, J. Webster, J. Wooters and L. L. Baxter, Prediction of tar and light gas during pyrolysis of black liquor and biomass, Energy Fuels, 2012, 26, 3381–3387 CrossRef CAS.
- V. Tan, G. A. De, T. Hosseini, J. A. Alhesan and L. Zhang, Scrap tyre pyrolysis: modified chemical percolation devolatilization (M-CPD) to describe the influence of pyrolysis conditions on product yields, Waste Manage., 2018, 76, 516–527 CrossRef CAS PubMed.
- K. Miura, Mild conversion of coal for producing valuable chemicals, Fuel Process. Technol., 2000, 62, 119–135 CrossRef CAS.
- Q. Wang, K. Li, Z. Guo, M. Fang and Z. Luo, Effects of CO atmosphere on the pyrolysis of a typical lignite, Chem. Eng. Technol., 2021, 44, 85–94 CrossRef CAS.
- Q. Wang, K. Li, Z. Guo, M. Fang, Z. Luo and K. Cen, Effects of CO2 atmosphere on slow pyrolysis of high-ash lignite, Carbon Resour. Convers., 2018, 1, 94–103 CrossRef.
- A. Arenillas, F. Rubiera and J. J. Pis, Simultaneous thermogravimetric-mass spectrometric study on the pyrolysis behaviour of different rank coals, J. Anal. Appl. Pyrolysis, 1999, 50, 31–46 CrossRef CAS.
- T. H. Fletcher, A. R. Kerstein, R. J. Pugmire, M. S. Solum and D. M. Grant, A Chemical Percolation Model for Devolatilization: Summary, Sandia Report SAND92-8207, 1992 Search PubMed.
- B. Yan, Y. Cheng, P. Xu, C. Cao and Y. Cheng, Generalized model of heat transfer and volatiles evolution inside particles for coal devolatilization, AIChE J., 2014, 60, 2893–2906 CrossRef CAS.
- J. Bai, L. Liang, Z. Zhang, P. Li, J. Yang, X. Hao, W. Huang and G. Guang, Simulation and analysis of catalytic depolymerization of low-rank coal by chemical percolation devolatilization model, CIESC J., 2019, 70, 265–274, DOI:10.11949/0438-1157.20190257.
- D. Genetti, An Advanced Model of Coal Devolatilization Based on Chemical Structure, M.S. thesis, Chemical Engineering Department, Brigham Young University, Provo, USA, 1999, https://www.et.byu.edu/%7Etom/Papers/Genetti_Thesis.pdf.
- P. R. Solomon, M. A. Serio, R. M. Carangelo, R. Bassilakis, D. Gravel, M. Baillargeon, F. Baudais and G. Vail, Analysis of the Argonne premium coal samples by thermogravimetric Fourier transform infrared spectroscopy, Energy Fuels, 1990, 4, 319–333 CrossRef CAS.
- J. Chen and S. Niksa, Coal devolatilization during rapid transient heating. 1. Primary devolatilization, Energy Fuels, 1992, 6, 254–264 CrossRef CAS.
| This journal is © The Royal Society of Chemistry 2021 |


