 Open Access Article
First-principles predictions of low lattice thermal conductivity and high thermoelectric performance of AZnSb (A = Rb, Cs)†
Enamul Haque
EH Solid State Physics Laboratory, Longaer, Gaffargaon-2233, Mymensingh, Bangladesh. E-mail: enamul.phy15@yahoo.com
First published on 26th April 2021
Abstract
Here, two compounds, AZnSb (A = Rb, Cs), have been predicted to be potential materials for thermoelectric device applications at high temperatures by using first-principles calculations based on density functional theory (DFT), density functional perturbation theory (DFPT), and Boltzmann transport theory. The layered structure, and presence of heavier elements Rb/Cs and Sb induce high anharmonicity (larger values of mode Grüneisen parameter), low Debye temperature, and intense phonon scattering. Thus, these compounds possess intrinsically low lattice thermal conductivity (κl), ∼0.5 W m−1 K−1 on average at 900 K. Highly non-parabolic bands and relatively wide bandgap (∼1.37 and 1.1 eV for RbZnSb and CsZnSb, respectively, by mBJ potential including spin–orbit coupling effect) induce large Seebeck coefficient while highly dispersive and two-fold degenerate bands induce high electrical conductivity. Large power factor and low values of κl lead to a high average thermoelectric figure of merit (ZT) of RbZnSb and CsZnSb, reaching 1.22 and 1.1 and 0.87 and 1.14 at 900 K for p-and n-type carriers, respectively.
1. Introduction
Many ABX compounds with 111 stoichiometry form either ZrBeSi or PbFCl type structures.1–3 These compounds have been found or predicted to exhibit some useful properties for practical applications, such as topological electronic structure.1–3 That's why topological materials have gained huge research interest to explore their potential applications in advanced electronic devices and their physical properties.4–9 Some of the antimony-based compounds exhibit topological behavior and its combination with other elements can crystallize in a wide range of structures, from zero to 3-dimensional motifs.9–15 These structures can be either too simple or too complex. The Sb-based compounds have thus a wide range of applications as thermoelectrics, photovoltaic, and other electronic components. A complex structured semiconducting material usually possesses low lattice thermal conductivity due to intense phonon scattering and exhibits practically useful thermoelectric performance. Yb14MnSb11, a complex structured p-type material, is a well-known material for thermoelectric device applications at high temperatures.16,17In recent decades, the demand for clean energy increases day by day and researchers are searching for novel materials with high thermoelectric performance. The thermoelectric performance of a material depends on its Seebeck coefficient (S), electrical conductivity (σ), total thermal conductivity (κtot = κe + κl, electronic (κe) plus lattice thermal conductivity (κl)), and absolute temperature (T). Many compounds have been found to exhibit large thermoelectric performance at high temperatures18,19 while others exhibit at low temperatures.20,21 The thermoelectric performance is defined by the expression22
From the above expression, the high-performance thermoelectric materials are required to possess a large Seebeck coefficient, high electrical conductivity, and low total thermal conductivity. A high-temperature thermoelectric material must have an optimum electronic bandgap to avoid carrier excitons at high temperatures. The lattice thermal conductivity is also a crucial factor for a large ZT value, which may be reduced through nano-structuring23,24 and alloying with suitable dopant.25,26 The search for a suitable dopant is very critical because it requires an extensive study through large computational resources or experimental setup. Therefore, the materials with intrinsic low lattice thermal conductivity and high electrical conductivity will enhance the thermoelectric device performance significantly.
Some 111 ABX hypothetical compounds were predicted by Zhang et al. in 2012.27 In this study, the authors reported the energetic stability of these compounds from-first-principles study that the compounds are favorable to form in the laboratory.27 They predicted that RbZnSb is formable in the LiYSn-type structure,27 a disordered ZrBeSi-type structure. In the last year, Owens-Baird et al. successfully synthesized AZnSb (A = Rb, Cs) compounds,2 which crystallize in the ZrBeSi-type structure. They reported that the melting or decomposition temperature of RbZnSb and CsZnSb is 975 and 1040 K, respectively.2
From first-principles based electronic structure calculations by using PBE functional, Owens-Baird et al. also reported that the AZnSb compounds are topologically trivial narrow bandgap semiconductors.2 The PBE functional underestimates the bandgap severely.28 To date, the accurate electronic structure and thermoelectric properties of these layered AZnSb compounds have not been reported. Besides, Gorai et al. predicted from first-principles calculations that KSnBi, RbSnBi, and NaGeP exhibit good thermoelectric performance for n-type carriers, and these compounds are n-type dopable.29 Therefore, it is worth studying the thermoelectric properties of AZnSb. In this article, i have reported the details of lattice dynamics, electronic structure by mBJ potential including spin–orbit coupling effect, and carrier transport properties of AZnSb. The AZnSb exhibit highly anisotropic transport properties and low lattice thermal conductivity, leading to a high average ZT of RbZnSb and CsZnSb, to 1.22 and 1.1 and 0.87 and 1.14 at 900 K for p-and n-type carriers, respectively.
2. Computational details
By using experimental values of the lattice parameters and atomic coordinates, the structural relaxations were performed in Quantum Espresso (QE) code30 with the PBEsol31 setting of generalized gradient approximation (GGA).32 In the QE,30 42 Ry cutoff energy for wavefunctions, 12 × 12 × 6 k-point, energy threshold 10−10 Ry, force convergence threshold 10−5 Ry/Au, and projector-augmented wave (PAW) pseudopotentials (from PSlibrary 1.0 (ref. 33)) were set in these calculations after extensive trials. The phonon dispersions and density of states were also calculated by using the same setting in QE. Then EPA code based on energy bins34 was used to calculate average electron-phonon dynamical matrix. The sensitivity to the energy bins of EPA method was verified by using EPA-MLS code.35 The resulted dynamical matrix was fed into BoltzTraP,36 a code implementing the Boltzmann transport equation (BTE) using constant relaxation time approximation (cRTA). To calculate the carrier lifetime, the BoltzTraP code was modified slightly to read the dynamical matrix. As the BoltzTraP requires energy eigenvalues, the electronic structure calculations were performed in Wien2K,37,38 a full-potential linearized augmented plane wave method (FP-LAPW) based code. In these calculations, PBEsol functional with mBJ potential including spin–orbit coupling effect (SOC) was used for accurate bandgap. Besides, A, Zn, and Sb sphere radii (Rmt) 2.3, 2.21, 2.21 bohr, valence band and conduction band separation energy −7.0 Ry, and kinetic energy cutoff RmtKmax = 7.0, a finer k-mesh 53 × 53 × 17, energy convergence 1 × 10⁻⁶ Ry and charge convergence 0.001e were set in Wien2K during these calculations. The values of cutoff energy, k-point, etc. were selected after extensive trials, in such a way that the increase of these parameters does not change the total energy more than 1 meV.By using the finite displacement method in Phono3py,39 the lattice thermal conductivity and other auxiliary parameters were calculated by creating 221 supercells. The second and third-order interatomic force constants (IFCs) were calculated in QE by using the same setting as before except the k-point (2 × 2 × 2 in this case). The resulted IFCs were fed into Phono3py to solve the phonon Boltzmann transport equation (pBTE) within the cRTA by using 14 × 14 × 14 q-point. This approach to calculating lattice thermal conductivity has been found to predict the lattice thermal conductivity reliably.40–42
3. Results and discussion
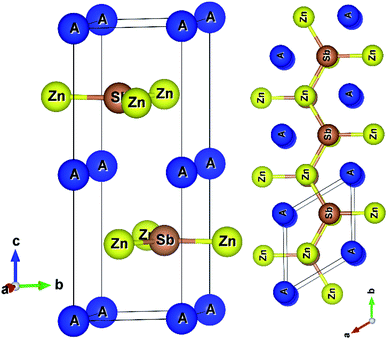
AZnSb compounds form a layered hexagonal structure with space group P63/mmc (#194),2 as shown in Fig. 1. The structures are well-known AlB2-type and three non-equivalent atoms have three unique positions in the unit cell.Graphene like layers of Zn3Sb3 stacking along cross-plane (z-axis) are formed, where two Zn3Sb3 rings from adjoining layers create a hexagonal prism locating the alkali metal at the center of the prism. The computed hexagonal lattice parameters are listed in Table 1. As usual, the PBEsol functional underestimates the experimental lattice parameters by less than one percent.
| Parameters | RbZnSb | CsZnSb | ||
|---|---|---|---|---|
| Computed | Exp.2 | Computed | Exp.2 | |
| a (Å) | 4.5144 | 4.5466 | 4.5297 | 4.5588 |
| c (Å) | 11.0629 | 11.0999 | 11.8698 | 11.9246 |
| c11 (GPa) | 80.7 | — | 70.7 | — |
| c12 (GPa) | 24.5 | — | 21.9 | |
| c13 (GPa) | 7.70 | — | 7.73 | — |
| c33 (GPa) | 33.8 | — | 39.3 | — |
| c44 (GPa) | 11.8 | — | 11.9 | — |
| B (GPa) | 27.4 | — | 26.7 | — |
| G (GPa) | 18.8 | — | 18.0 | — |
| vt (km s−1) | 2.024 | — | 1.897 | — |
| vl (km s−1) | 3.380 | — | 3.184 | — |
| θD (km s−1) | 208.3 | — | 190.4 | — |
The in-plane length (a) of AZnSb is almost independent of Rb/Cs's radii. As the Rb/Cs atoms are located between Zn–Sb layers, the cross-plane (c) length of the unit cell depends on their atomic radii. The elastic constants (listed in Table 1) of AZnSb satisfy the mechanical stability criteria described in ref. 44. The small value of the bulk modulus suggests that both compounds are less resistive to the external mechanical forces. According to Slack expression, the lattice thermal conductivity is directly proportional to the cube of the Debye temperature. In both compounds, the longitudinal and transverse sound propagates slowly, leading to a low value of the Debye temperature. The computed values of the Debye temperature of AZnSb are comparable to that of Bi2Te3, which possesses intrinsically low lattice thermal conductivity.21
3.1. Lattice dynamics
Fig. 2 demonstrates the dynamical stability of AZnSb compounds, as the phonon dispersions contain no negative frequencies over the Brillouin zone (BZ). The acoustic and lower energy optical phonons of RbZnSb arise from alkali metal (A) and Zn, while higher energy optical phonons are induced from Zn and Sb.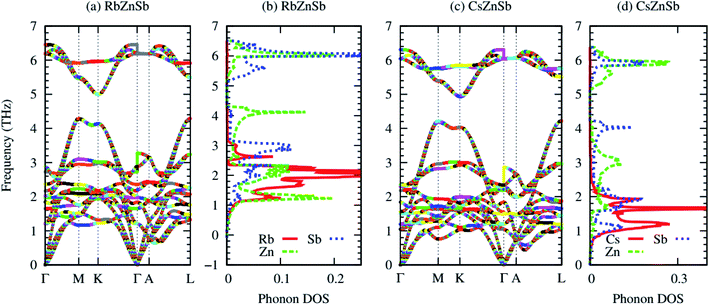 | ||
| Fig. 2 Phonon dispersion and atom projected density of states of RbZnSb (a–b) and CsZnSb (c–d), respectively. In the phonon dispersion, longitudinal and transverse optical (LO–TO) phonon splittings have been included by calculating macroscopic dielectric constant and Born effective charge (listed in the ESI†). | ||
However, the acoustic and lower energy optical phonons of CsZnSb originate from Cs and Sb with small contributions from Zn. The acoustic and lower energy optical phonons have usually major contributions in the heat conductions. From the phonon dispersion, it is clear that the acoustic and optical phonons are overlapped largely, which are non-conducive for heat. Metal antimonide (Sb) has a dominant contribution to the lower energy phonon, as shown in the atom projected phonon density of states in Fig. 2(b and d).
The cross-plane phonons induced from covalent-bonded Zn–Sb may have a negligible contribution to the lattice thermal conductivity.
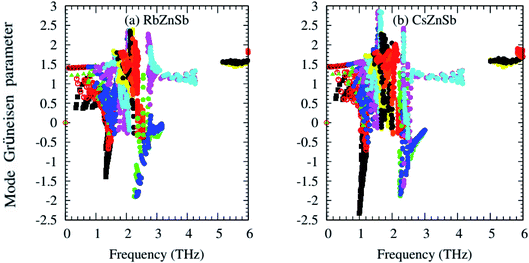
One of the most important phonon scattering factors, namely the Grüneisen parameter, has been calculated from second and third IFCs and presented graphically in Fig. 3. Unlike few ABX half-Heusler compounds, such as NbCoSb45 and ZrCoSb,46 with positive Grüneisen parameters values only, the mode Grüneisen parameter (γ) of AZnSb expands over positive and negative values for both compounds. The presence of heavier elements Rb/Cs may be responsible for the negative values of the mode Grüneisen parameter of AZnSb. That's why the negative values of γ of CsZnSb are larger than that of RbZnSb. The negative values of the γ suggest that the external effect, such as pressure/temperature, may easily cause the contraction of the compounds and these compounds would have negative values of the thermal expansion coefficient.47
Larger values of γ indicate high anharmonicity and vice versa. Both compounds possess larger values of γ, and thus, AZnSb compounds are highly anharmonic crystals due to their complex structure and heavier elements Rb/Cs and Sb-induced phonon softening. Therefore, such intense phonon scattering may lead to low lattice thermal conductivity. Let's have a look at it.
Fig. 4 shows the calculated anisotropic lattice thermal conductivity (κl) as a function of temperature. The κl values of both compounds are highly anisotropic due to the structural anisotropy. Both compounds possess relatively low lattice thermal conductivity (on average, κl < 2 W m−1 K−1 at 300 K) due to high anharmonicity. Such low values of κl of both compounds are relatively higher than that of few typical thermoelectric materials possessing ultralow values of κl, for example, Cs2PtI6 (0.15 W m−1 K−1, Tl3VSe4 (0.30 W m−1 K−1 at 300 K (ref. 48)), Tl2O (0.17 W m−1 K−1 at 300 K (ref. 49)), and SnSe (κl (along b-axis) = 0.7 W m−1 K−1 at 300 K (ref. 50)), at 300 K (ref. 51)), but comparable to that of NbCoSb (∼2.5 W m−1 K−1 (the sample synthesized at 900 °C) at 300 K (ref. 52)) and in-plane κl of best low-temperature thermoelectric Bi2Te3 (1.6 W m−1 K−1 at 300 K (ref. 48)). However, the room temperature κl values are much smaller than that of typical ABX thermoelectrics HfCoSb (∼14 W m−1 K−1 at 400 K (ref. 53) and ZrCoSb (∼15 W m−1 K−1 at 300 K (ref. 54)).
Interestingly, the cross-plane κl of AZnSb is almost independent of alkali metal (Rb/Cs), although the cross-plane (c) length of the unit cell strongly depends on Rb/Cs. Generally, the κl exhibits opposite trend to the structural anisotropy, i.e., the shorter the length of the unit cell along a certain direction will cause higher κl in that direction compared to other directions.
From Fig. 4(b), the majority of heat is conducted by acoustic and optical phonons with energy ∼1–2.5 THz. Higher energy optical phonons have almost negligible contributions to the heat conductions. The first derivative of cumulative phonon lifetime indicates that acoustic and optical phonons (induced from Rb/Cs–Sb) with energy ∼1–2.5 THz have the strongest interactions, as shown by the shadow region in Fig. 4(c).
3.2. Electronic structure
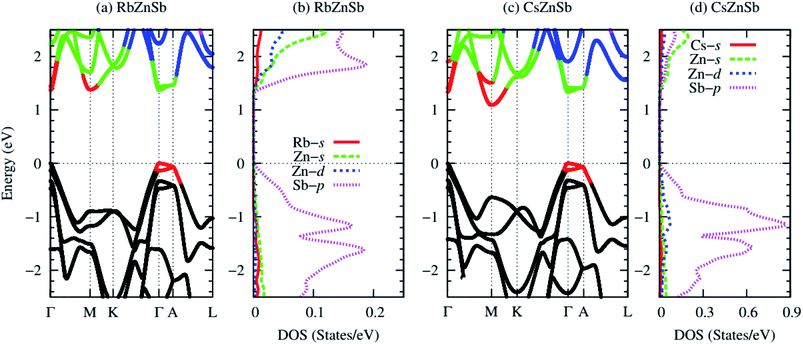
Electronic structure analysis is crucial for characterizing a thermoelectric material. Fig. 5 demonstrates the computed band structures and projected density of states of AZnSb by using PBEsol functional with mBJ potential including the SOC effect. Both compounds exhibit almost identical band structures. The conduction and valence bands are highly dispersive bands. The strong interaction between Zn-4s and Sb-5p states dominantly induces the dispersive nature of electronic bands. The topmost valence bands and lowest conduction bands of both compounds are two-fold degenerate bands with three valleys, i.e., the band degeneracy is six (Nv = 6). These degenerate bands originate from the structural symmetries, i.e., the presence of rotational and one inversion symmetry. The shape of the computed bandstructures shows an excellent agreement with that reported in ref. 2 by using PBE functional including SOC effect.Table 2 lists the computed bandgap and effective mass of AZnSb. Both compounds are direct bandgap semiconductors. The computed values of the bandgap are much higher than those reported (0.3 eV) in ref. 2 by using PBE functional. The PBE functional cannot fully compensate the unphysical self-interaction energy which pushes the occupied states upward, and thus, severely underestimates the bandgap.28 For example, the bandgap of ZnO calculated by PBE functional is 0.82 eV, while the experimental value is 3.44 eV and mBJ gives 2.71 eV.28
Fig. 5(b and d) demonstrates the orbital projected density of states of both compounds. The conduction bands near the Fermi level mainly arise from Zn-4s and Sb-5p states. The valence bands near the Fermi level originate mainly from Zn-3d and Sb-5p states. However, the alkali metal Rb/Cs has a negligible contribution in bandgap formulation. The slight reduction of the bandgap of CsZnSb compared to the RbZnSb is due to the change of unit cell length along the z-axis. As Rb/Cs has a significant contribution to the lattice thermal conductivity and negligible contributions to the electronic structure, doping with a suitable element on this cation site may be an effective way to optimize the thermoelectric performance further. The valence band maxima (VBM) and conduction band minima (CBM) are highly non-parabolic bands, which will favor a larger Seebeck coefficient, while the degenerate and dispersive band will be favorable for high electrical conductivity.
3.3. Carrier transport
The original BoltzTraP code calculates the transport coefficients within cRTA.36 To estimate the electrical conductivity and electronic part of the thermal conductivity, the code is required to modify for the calculation of carrier lifetime (relaxation time).In the modified code, the carrier lifetime (τ) is calculated by the following equation34
 | (1) |
![[small omega, Greek, macron]](https://www.rsc.org/images/entities/i_char_e0da.gif) v for the averaged frequency of phonon modes, gv2 for the averaged of the electron-phonon matrix, n(
v for the averaged frequency of phonon modes, gv2 for the averaged of the electron-phonon matrix, n(![[small omega, Greek, macron]](https://www.rsc.org/images/entities/i_char_e0da.gif) v, T) for the Bose–Einstein distribution function, f(ε +
v, T) for the Bose–Einstein distribution function, f(ε + ![[small omega, Greek, macron]](https://www.rsc.org/images/entities/i_char_e0da.gif) v, μ, T) for the Fermi–Dirac distribution function, gs = 2 for the degeneracy of spin, ε the energy of carriers, and ρ for the electronic density of states (DOS) per unit volume and energy.34 Readers should consult with ref. 34 for further details.
v, μ, T) for the Fermi–Dirac distribution function, gs = 2 for the degeneracy of spin, ε the energy of carriers, and ρ for the electronic density of states (DOS) per unit volume and energy.34 Readers should consult with ref. 34 for further details.
The computed carrier lifetime of both compounds exhibits a strong energy dependency as shown in Fig. 6. The τ of AZnSb shows a weak anisotropic behavior at all temperatures. The variations of τ with energy can be explained by using the equation:34
| τ−1 ∼ g2(ε)ρ(ε). | (2) |
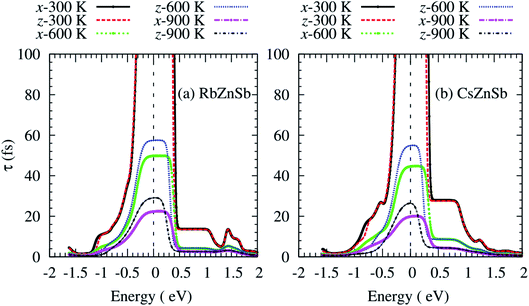 | ||
| Fig. 6 Anisotropic carrier lifetime as a function of the energy of (a) RbZnSb, and (b) CsZnSb at three consecutive temperatures. The dashed vertical lines at zero energy represent the Fermi level. | ||
From the above equation, the carrier lifetime changes inversely with the electronic density of states (ρ) per-unit energy and per-unit volume of the unit cell. In this case, the g exhibits a weak energy dependency. The temperature similarly affects the τ.
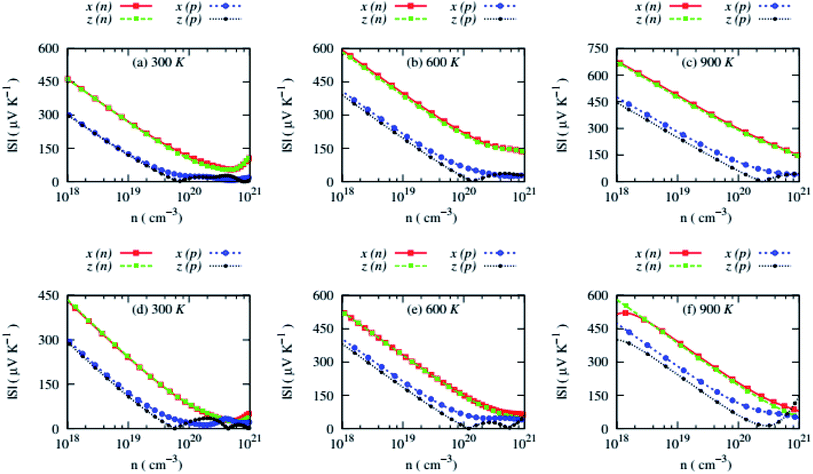
Both compounds possess almost isotropic Seebeck coefficient (S) for n-type carriers and weakly anisotropic S for n-type carriers, and the S falls sharply with carrier concentrations, as shown in Fig. 7.
The S of these compounds are large and n-type carriers induce much larger S due to highly non-parabolic bands than that of p-type carriers at certain carrier concentrations. At 2.49 × 1020 cm−3 carrier concentrations, the average S of n-type RbZnSb can reach up to 232.36 μV K−1 at 900 K while the S of p-type RbZnSb remains slightly higher, 237.97 μV K−1 at 900 K and 0.147 × 1020 cm−3. However, at 0.793 × 1020 cm−3 carrier concentrations, the S of n-type CsZnSb can reach up to 220 μV K−1 at 900 K while the S of p-type CsZnSb remains larger, 235.16 μV K−1 at 900 K and 0.149 × 1020 cm−3. Highly non-parabolic conduction band minima of n-type RbZnSb compared to that of n-type CsZnSb are responsible for larger Seebeck coefficient of n-type RbZnSb. On the other side, similar non-parabolic valence band maxima and effective mass of holes of p-type RbZnSb compared to that of p-type CsZnSb are responsible for identical Seebeck coefficient of both compounds for p-type carriers.
Electrical conductivity (σ) of AZnSb exhibits opposite trends compared to the Seebeck coefficient, i.e., it sharply rises with carrier concentrations and decreases with temperature, as shown in Fig. 8. The σ of these compounds is also highly anisotropic like lattice thermal conductivity. As the alkali metal has negligible contributions to the electronic structure, the values of σ show a weak dependency on the alkali metal Rb/Cs.
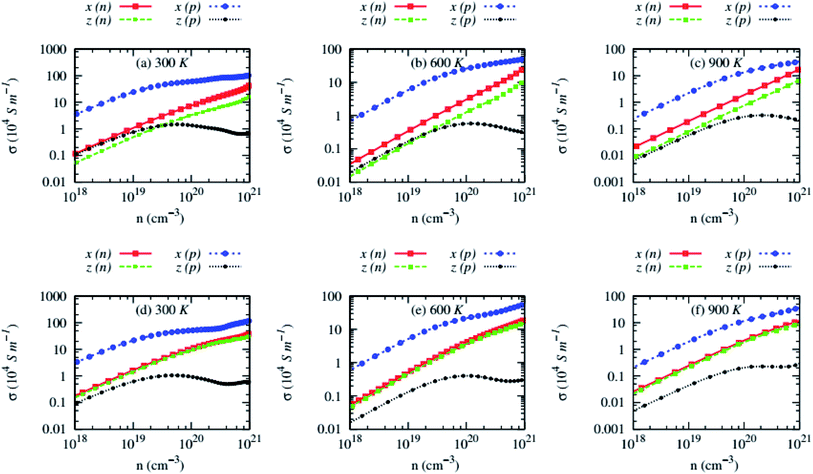 | ||
| Fig. 8 Anisotropic electrical conductivity (σ) as a function of carrier concentrations of (a–c) RbZnSb and (d–f) CsZnSb for both n-and p-type carriers at three consecutive temperatures. | ||
Interestingly, the anisotropic nature of the σ for n-type carriers strongly depends on the alkali metal. The σ of n-type RbZnSb exhibits anisotropic behavior while the values σ of n-type CsZnSb are almost isotropic. Although the values of in-plane electrical conductivity of both compounds are high for p-type carriers due to lighter effective mass, the cross-plane σ values are exceptionally low at all temperatures, especially above 1020 cm−3 carrier concentrations. The cross-plane σ of p-type AZnSb decreases slightly above 1020 cm−3. The carriers scattering above 1020 cm−3 might unprecedentedly rise along the z-direction.
The presence of multiple converged bands leads to forming the resonant level, which can be seen from the well-defined peak around the Fermi level in the electronic density of states, as shown in Fig. 5(b) and (d) for RbZnSb and CsZnSb, respectively. These bands are responsible for the abnormal rise/fall for Seebeck coefficient and electrical conductivity at high carrier concentrations above 1020 cm−3. As the peak of conduction bands of CsZnSb is week-defined (please see Fig. 5(d)), the abnormal changes of Seebeck coefficient and electrical conductivity of n-type carriers above 1020 cm−3 are slower compared to that of other cases.
The electrical conductivity of both compounds, except cross-plane σ of p-type carriers, is relatively high despite their wide bandgap ∼1.37 and 1.1 eV for RbZnSb and CsZnSb, respectively, which originates from the highly dispersive and degenerate bands, and relatively lighter effective mass. Notably, the electrical conductivity of RbZnSb is higher than that of CsZnSb, although its bandgap is comparatively wider, because of its lighter effective mass. The σ of AZnSb decreases with temperatures in all cases, suggesting the extrinsic nature of AZnSb compounds.
The carrier concentrations dependency of anisotropic power factor (PF) of AZnSb at three consecutive temperatures is shown in Fig. 9. Large Seebeck coefficient and high electrical conductivity along with in-plane lead to a high PF, reaching ∼4 mW m−1 K−2 at 300 K. The PF of n-type RbZnSb is exceptionally high at high temperatures due to larger Seebeck coefficient while it remains low (∼1 mW m−1 K−2) for n-type CsZnSb at all studied temperatures. However, the cross-plane PF of p-type AZnSb is very small due to low electrical conductivity.
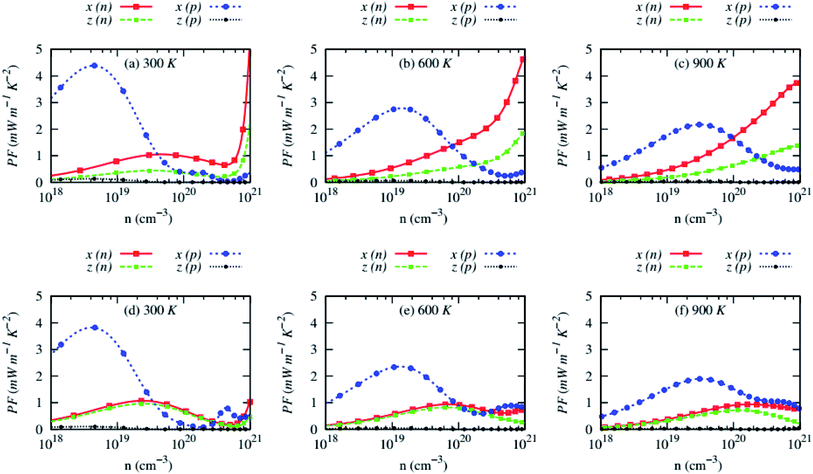 | ||
| Fig. 9 Anisotropic power factor (PF) as a function of carrier concentrations of (a–c) RbZnSb and (d–f) CsZnSb for both n-and p-type carriers at three consecutive temperatures. | ||
Fig. 10 demonstrates the carrier concentration dependency of the electronic part of the thermal conductivity. The electronic part of the thermal conductivity (κe) of both compounds is highly anisotropic and rises with carrier concentrations. The κe exhibits a weak dependency on the temperature. Like electrical conductivity, it decreases with the temperature slowly.
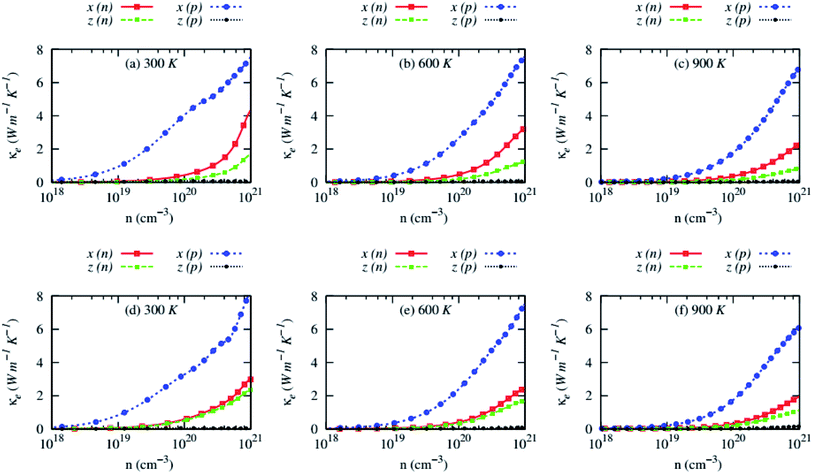 | ||
| Fig. 10 Anisotropic electronic thermal conductivity (κe) as a function of carrier concentrations of (a–c) RbZnSb and (d–f) CsZnSb for both n-and p-type carriers at three consecutive temperatures. | ||
The in-plane κe values of p-type AZnSb is much higher than that of other carriers and plane. The cross-plane κe of p-type AZnSb is very low due to the unprecedented slowing of the mobility of the carrier along that axes.
In all cases (except cross-plane κe of p-type carriers), the electronic part of the thermal conductivity dominates over the lattice thermal conductivity at high temperatures (from 600 K in Fig. 10). The computed transport coefficients of these compounds at optimum carrier concentrations and 900 K for both types of carriers are listed in Table 3.
| Compound | n | |S| | σ | PF | κtot | ZT | |
|---|---|---|---|---|---|---|---|
| RbZnSb | n | 24.95 | 232.36 | 3.614 | 1.95 | 1.44 | 1.22 |
| p | 1.471 | 237.97 | 2.146 | 1.21 | 0.99 | 1.10 | |
| CsZnSb | n | 7.936 | 220.01 | 1.670 | 0.81 | 0.84 | 0.87 |
| p | 1.495 | 235.16 | 1.881 | 1.04 | 0.82 | 1.14 | |
3.4. Thermoelectric performance
The large PF, low electronic part of the thermal conductivity, and lattice thermal conductivity lead to a high thermoelectric figure of merit (ZT), as shown in Fig. 11. The values of ZT of both compounds are anisotropic and strongly depend on the carrier crystallographic plane, especially for p-type carriers.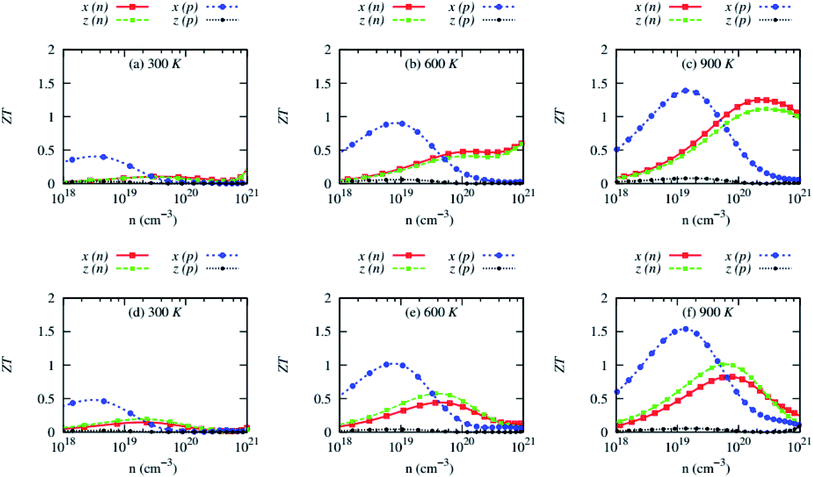 | ||
| Fig. 11 Anisotropic thermoelectric figure of merit (ZT) as a function of carrier concentrations of (a–c) RbZnSb and (d–f) CsZnSb for both n-and p-type carriers at three consecutive temperatures. | ||
The room temperature ZT of both compounds is very small, suggesting that they are not suitable for low-temperature thermoelectric applications, despite the in-plane ZT of p-type AZnSb can approach ∼0.5 at 300 K and ∼5 × 1018 cm−3. The variation of the carrier concentrations has been obtained from the rigid shift of the Fermi level to describe the thermoelectric properties of the studied compounds. During the experimental synthesis, the carrier concentration might be different or reached this optimum carrier concentration. But the calculated ZT at the optimum carrier concentrations, within the computational uncertainty, is expected to be obtainable experimentally. However, this does not necessarily describe the whole range of carrier concentrations of these compounds.
Although the in-plane ZT of p-type AZnSb is high, reaching ∼1.5 at 900 K and ∼1019 cm−3, the values of cross-plane ZT of both compounds for p-type carriers are impractically small due to low electrical conductivity. On the other side, the ZT of n-type AZnSb is less anisotropic and the value of RbZnSb and CsZnSb can reach a maximum of 1.22 and 0.87 at 900 K and ∼1020 cm−3, respectively.
Fig. 12 demonstrates the effect of temperature on the thermoelectric performance of AZnSb at fixed carrier concentrations ∼1020 cm−3 and ∼1019 cm−3 for n- and p-type carriers, respectively (for temperature-dependent transport coefficients, please see ESI†). The ZT sharply rises with temperature. This suggests that the ZT would be higher above 900 K. However, the experimental melting or decomposition temperature of RbZnSb and CsZnSb is 975 and 1040 K, respectively. Thus, the ZT above 900 K has not been studied.
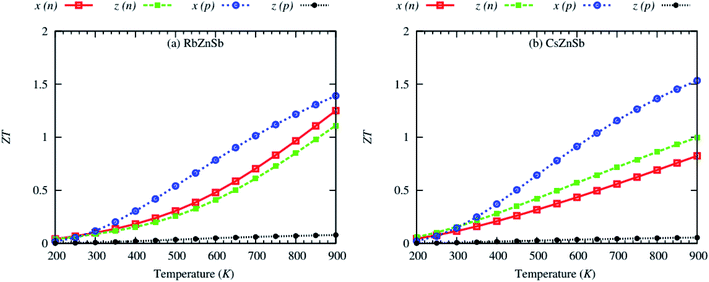 | ||
| Fig. 12 Anisotropic thermoelectric figure of merit (ZT) as a function of the temperature of (a) RbZnSb and (b) CsZnSb for both n-and p-type carriers at fixed carrier concentrations. | ||
Table 3 lists the calculated isotropic  of AZnSb at 900 K and fixed carrier concentration. On average, the ZT of RbZnSb is 1.22 and 1.1 at 900 K for p-and n-type carriers, respectively. On the other side, the average ZT of CsZnSb is slightly smaller but it is 0.87 and 1.14 at 900 K for p-and n-type carriers, respectively, within the computational accuracy. Therefore, the high values of the thermoelectric figure of merit (ZT) of layered AZnSb compounds suggest that they are potential materials for thermoelectric device applications, and experimental studies are encouraged to confirm this prediction.
4. Conclusions
In summary, systematic first-principles calculations have been performed to study structural, phonon transport, electronic structure, and carrier transport properties of AZnSb (A = Rb, Cs). Layered AZnSb compounds have low Debye temperature. The presence of heavier elements Rb/Cs causes phonon softening and leads to larger values of the mode Grüneisen parameter, expanding over negative and positive values, i.e., high anharmonicity. This leads to intense phonon scattering in both compounds and hence, low lattice thermal conductivity (κl), (∼0.5 W m−1 K−1 on the average at 900 K). Both compounds are direct bandgap (∼1.37 and 1.1 eV for RbZnSb and CsZnSb, respectively) semiconductors, and Zn-3d and Sb-5p states mainly formulate the bandgap, with negligible contributions from alkali metal Rb/Cs. The electronic bands are highly dispersive and two-fold degenerate. The CBM and VBM are also highly non-parabolic. The non-parabolic bands and wider bandgap of AZnSb induce a large Seebeck coefficient. The dispersive and two-fold degenerate characters of bands are responsible for the relatively high electrical conductivity of AZnSb. In a combination of larger Seebeck coefficient and electrical conductivity, both compounds have a larger power factor. The large power factor and low values of κl lead to a high average thermoelectric figure of merit (ZT) of RbZnSb and CsZnSb, reaching 1.22 and 1.1 and 0.87 and 1.14 at 900 K for p-and n-type carriers, respectively. Therefore, AZnSb are potential materials for high-temperature thermoelectric device applications.Data availability statement
The data that support the findings of this study are available from the corresponding author upon reasonable request.Conflicts of interest
There are no conflicts to declare.References
- L. M. Schoop, F. Pielnhofer and B. V Lotsch, Chem. Mater., 2018, 30, 3155–3176 CrossRef CAS.
- B. Owens-Baird, L.-L. Wang, S. Lee and K. Kovnir, Z. Anorg. Allg. Chem., 2020, 646, 1079–1085 CrossRef CAS.
- Q. Xu, Z. Song, S. Nie, H. Weng, Z. Fang and X. Dai, Phys. Rev. B: Condens. Matter Mater. Phys., 2015, 92, 205310 CrossRef.
- B. R. Bennett, R. Magno, J. B. Boos, W. Kruppa and M. G. Ancona, Solid-State Electron., 2005, 49, 1875–1895 CrossRef CAS.
- H. Kleinke, Chem. Mater., 2010, 22, 604–611 CrossRef CAS.
- G. Li and C. Felser, Appl. Phys. Lett., 2020, 116, 70501 CrossRef CAS.
- J. Sotor, G. Sobon, K. Grodecki and K. M. Abramski, Appl. Phys. Lett., 2014, 104, 251112 CrossRef.
- O. A. Tretiakov, A. Abanov, S. Murakami and J. Sinova, Appl. Phys. Lett., 2010, 97, 73108 CrossRef.
- D. Takane, S. Souma, T. Sato, T. Takahashi, K. Segawa and Y. Ando, Appl. Phys. Lett., 2016, 109, 91601 CrossRef.
- H. Kleinke, Chem. Soc. Rev., 2000, 29, 411–418 RSC.
- V. Gvozdetskyi, B. Owens-Baird, S. Hong, T. Cox, G. Bhaskar, C. Harmer, Y. Sun, F. Zhang, C.-Z. Wang and K.-M. Ho, et al., Chem. Mater., 2019, 31, 8695–8707 CrossRef CAS.
- J. Wang and K. Kovnir, J. Am. Chem. Soc., 2015, 137, 12474–12477 CrossRef CAS PubMed.
- A. H. Sommer, Appl. Phys. Lett., 1963, 3, 62–63 CrossRef CAS.
- A. S. Mikhaylushkin, J. Nylén and U. Häussermann, Chem.–Eur. J., 2005, 11, 4912–4920 CrossRef CAS PubMed.
- E. K. Huang, D. Hoffman, B.-M. Nguyen, P.-Y. Delaunay and M. Razeghi, Appl. Phys. Lett., 2009, 94, 53506 CrossRef.
- S. R. Brown, S. M. Kauzlarich, F. Gascoin and G. J. Snyder, Chem. Mater., 2006, 18, 1873–1877 CrossRef CAS.
- Y. Hu, G. Cerretti, E. L. K. Wille, S. K. Bux and S. M. Kauzlarich, J. Solid State Chem., 2019, 271, 88–102 CrossRef CAS.
- C. Yu, T.-J. Zhu, R.-Z. Shi, Y. Zhang, X.-B. Zhao and J. He, Acta Mater., 2009, 57, 2757–2764 CrossRef CAS.
- S. Chen and Z. Ren, Mater. Today, 2013, 16, 387–395 CrossRef CAS.
- H. J. Goldsmid, Introduction to thermoelectricity, Springer, 2010, vol. 121 Search PubMed.
- H. J. Goldsmid, Thermoelectric refrigeration, Springer, 2013 Search PubMed.
- A. Ioffe, Semiconductor Thermoelements and Thermoelectric Cooling, Infosearch, London, 1st edn, 1957 Search PubMed.
- S. Chandra and K. Biswas, J. Am. Chem. Soc., 2019, 141(15), 6141–6145 CrossRef CAS PubMed.
- C. J. Vineis, A. Shakouri, A. Majumdar and M. G. Kanatzidis, Adv. Mater., 2010, 22, 3970–3980 CrossRef CAS PubMed.
- S. D. Kang, J.-H. Pöhls, U. Aydemir, P. Qiu, C. C. Stoumpos, R. Hanus, M. A. White, X. Shi, L. Chen and M. G. Kanatzidis, et al., Materials Today Physics, 2017, 1, 7–13 CrossRef.
- M. Wambach, R. Stern, S. Bhattacharya, P. Ziolkowski, E. Müller, G. K. H. Madsen and A. Ludwig, Adv. Electron. Mater., 2016, 2, 1500208 CrossRef.
- X. Zhang, L. Yu, A. Zakutayev and A. Zunger, Adv. Funct. Mater., 2012, 22, 1425–1435 CrossRef CAS.
- D. Koller, F. Tran and P. Blaha, Phys. Rev. B: Condens. Matter Mater. Phys., 2011, 83, 195134 CrossRef.
- P. Gorai, A. Ganose, A. Faghaninia, A. Jain and V. Stevanović, Mater. Horiz., 2020, 7, 1809–1818 RSC.
- P. Giannozzi, S. Baroni, N. Bonini, M. Calandra, R. Car, C. Cavazzoni, D. Ceresoli, G. L. Chiarotti, M. Cococcioni and I. Dabo, et al., J. Phys.: Condens. Matter, 2009, 21, 395502 CrossRef PubMed.
- J. P. Perdew, A. Ruzsinszky, G. I. Csonka, O. A. Vydrov, G. E. Scuseria, L. A. Constantin, X. Zhou and K. Burke, Phys. Rev. Lett., 2008, 100, 136406 CrossRef PubMed.
- J. P. Perdew, K. Burke and M. Ernzerhof, Phys. Rev. Lett., 1996, 77, 3865 CrossRef CAS PubMed.
- A. Dal Corso, Comput. Mater. Sci., 2014, 95, 337–350 CrossRef CAS.
- G. Samsonidze and B. Kozinsky, Adv. Energy Mater., 2018, 8, 1800246 CrossRef.
- S. Bang, J. Kim, D. Wee, G. Samsonidze and B. Kozinsky, Materials Today Physics, 2018, 6, 22–30 CrossRef.
- G. K. H. Madsen and D. J. Singh, Comput. Phys. Commun., 2006, 175, 67–71 CrossRef CAS.
- P. Blaha, K. Schwarz, F. Tran, R. Laskowski, G. K. H. Madsen and L. D. Marks, J. Chem. Phys., 2020, 152, 74101 CrossRef CAS PubMed.
- P. Blaha, K. Schwarz, G. K. H. Madsen, D. Kvasnicka, J. Luitz, R. Laskowski, F. Tran L. D. Marks and WIEN2k, An Augmented Plane Wave + Local Orbitals Program for Calculating Crystal Properties, ed. K. Schwarz, Techn. Universität Wien, Austria, 2018, ISBN 3-9501031-1-2 Search PubMed.
- A. Togo, L. Chaput and I. Tanaka, Phys. Rev. B: Condens. Matter Mater. Phys., 2015, 91, 94306 CrossRef.
- A. Seko, A. Togo, H. Hayashi, K. Tsuda, L. Chaput and I. Tanaka, Phys. Rev. Lett., 2015, 115, 205901 CrossRef PubMed.
- K. Mizokami, A. Togo and I. Tanaka, Phys. Rev. B, 2018, 97, 224306 CrossRef CAS.
- H. Uchiyama, Y. Oshima, R. Patterson, S. Iwamoto, J. Shiomi and K. Shimamura, Phys. Rev. Lett., 2018, 120, 235901 CrossRef CAS PubMed.
- O. L. Anderson, J. Phys. Chem. Solids, 1963, 24, 909–917 CrossRef CAS.
- F. Mouhat and F.-X. Coudert, Phys. Rev. B: Condens. Matter Mater. Phys., 2014, 90, 224104 CrossRef.
- H. B. Ozisik, E. Deligoz, H. Ozisik and E. Ateser, Mater. Res. Express, 2020, 7, 25004 CAS.
- J. Shiomi, K. Esfarjani and G. Chen, Phys. Rev. B: Condens. Matter Mater. Phys., 2011, 84, 104302 CrossRef.
- M. T. Dove, V. Heine and K. D. Hammonds, Mineral. Mag., 1995, 59, 629–639 CrossRef CAS.
- S. Mukhopadhyay, D. S. Parker, B. C. Sales, A. A. Puretzky, M. A. McGuire and L. Lindsay, Science, 2018, 360, 1455–1458 CrossRef CAS PubMed.
- M. Sajjad, N. Singh, S. Sattar, S. De Wolf and U. Schwingenschlögl, ACS Appl. Energy Mater., 2019, 2, 3004–3008 CrossRef CAS.
- L.-D. Zhao, S.-H. Lo, Y. Zhang, H. Sun, G. Tan, C. Uher, C. Wolverton, V. P. Dravid and M. G. Kanatzidis, Nature, 2014, 508, 373 CrossRef CAS PubMed.
- M. Sajjad, Q. Mahmood, N. Singh and J. A. Larsson, ACS Appl. Energy Mater., 2020, 3(11), 11293–11299 CrossRef CAS.
- L. Huang, R. He, S. Chen, H. Zhang, K. Dahal, H. Zhou, H. Wang, Q. Zhang and Z. Ren, Mater. Res. Bull., 2015, 70, 773–778 CrossRef CAS.
- T. Sekimoto, K. Kurosaki, H. Muta and S. Yamanaka, Mater. Trans., 2006, 47, 1445–1448 CrossRef CAS.
- Y. Xia, S. Bhattacharya, V. Ponnambalam, A. L. Pope, S. J. Poon and T. M. Tritt, J. Appl. Phys., 2000, 88, 1952–1955 CrossRef CAS.
Footnote |
| † Electronic supplementary information (ESI) available. See DOI: 10.1039/d1ra01938d |
| This journal is © The Royal Society of Chemistry 2021 |


