
 Open Access Article
 This Open Access Article is licensed under a Creative Commons Attribution-Non Commercial 3.0 Unported Licence
Inner filter effect between upconversion nanoparticles and Fe(II)–1,10-phenanthroline complex for the detection of Sn(II) and ascorbic acid (AA)†
Haining Songa,
Yifei Zhoub,
Zexin Lia,
Haifeng Zhou*c,
Fenglei Suna,
Zhenlei Yuana,
Peng Guoa,
Guangjun Zhou *a,
Xiaoqiang Yua and
Jifan Hua
*a,
Xiaoqiang Yua and
Jifan Hua
aState Key Laboratory of Crystal Materials, Shandong University, Jinan, 250100, P. R. China. E-mail: gjzhou@sdu.edu.cn
bSchool of Mechanical, Electrical & Information Engineering, Shandong University, Weihai, 264209, P.R. China
cSchool of Materials Science and Engineering, Qilu University of Technology (Shandong Academy of Sciences), Jinan, 250353, P. R. China. E-mail: hfzhou@qlu.edu.cn
First published on 11th May 2021
Abstract
Dual-function and multi-function sensors can use the same material or detection system to achieve the purpose of detection of two or more substances. Due to their high sensitivity and specificity, dual-function and multi-function sensors have potential applications in many fields. In this article, we designed a dual-function sensor to detect Sn(II) and ascorbic acid (AA) based on the inner filter effect (IFE) between NaYF4:Yb,Er@NaYF4@PAA (UCNPs@PAA) and Fe(II)–1,10-phenanthroline complex. Fe(II)–1,10-phenanthroline complex has strong absorption in most of the ultraviolet-visible light range (350 nm–600 nm), and this absorption band overlaps with the green emission peak of UCNPs@PAA at 540 nm; Fe(II)–1,10-phenanthroline complex can significantly quench the green light emission of UCNPs@PAA. When Sn(II) or AA is added to the UCNPs@PAA/Fe(III)/1,10-phenanthroline, they can reduce Fe(III) to Fe(II). Fe(II) can react with 1,10-phenanthroline to form an orange complex, thereby quenching the green light emission of UCNPs@PAA. And the quenching efficiency is related to the concentration of Sn(II) and AA; there is a linear relationship between quenching efficiency and the concentration of Sn(II) and AA, within a certain concentration range the detection limits of this dual-function sensor for Sn(II) and AA are 1.08 μM and 0.97 μM, respectively. In addition, the dual-function sensor can also detect Sn(II) and AA in tap and spring water.
Introduction
In recent years, the development and construction of dual-function or even multi-function detection platforms has attracted extensive attention of researchers. They can use the same material or detection system to achieve the purpose of detection of two or more substances.1–3 Compared with the traditional single-function detection platforms, they have higher cost performance ratio and a wider range of potential applications.4,5 Great progress has been made in this respect. Sun et al. developed a bifunctional platform based on the fluorescence resonance energy transfer (FRET) between up-converted nanoparticles (UCNPs) and gold nanoparticles (Au NPs) for rapid, sensitive and specific recognition of Cd2+ and GSH.6 Han et al. constructed a multifunctional fluorescent probe capable of detecting H2O2 and cholesterol by simultaneously monitoring two different detection channels.7 We found that both Sn(II) and AA can reduce Fe(III) to Fe(II) without further reducing Fe(II) to Fe, so the platform designed by us can be used to detect Sn(II) and AA.Tin is a natural element in the earth's crust, the valence of the tin is 2+, 4+,8 the Sn(II) is mainly in the form of SnCl2 salt.9 In industry, SnCl2 is used as an analytical reagent to reduce the salts of metals such as gold, silver and other metals10 as well as a catalyst used in the esterification reaction.11 The use of both industry and daily life for Sn(II) can cause release of Sn. Due to the non-biodegradable of Sn(II)/Sn(IV), Sn(II)/Sn(IV) can cause serious pollution to the natural environment. These ions will enter human body through various channels. Excessive amounts of Sn can cause adverse effects on the human body's digestion, breathing and nervous system.12–14 Therefore, it is particularly important to explore an accurate, simple and effective method to detect Sn(II)/Sn(IV). Conventional analysis methods for detecting Sn(II) is atomic absorption spectrometry,13,14 spectral method,15 voltammetry,16,17 and potential method,18,19 etc. These methods cannot differentiate between samples of Sn(II) and Sn(IV). Compared with the conventional detection methods, fluorescent sensors20–22 have high sensitivity, strong specificity and transient response.
Fluorescent sensors can be used not only for the detection of Sn(II), but also for the detection of Ascorbic acid, which is a water-soluble vitamin and an essential trace element23 for keeping human healthy.24 But excessive intake of AA can cause allergic rash, diarrhea and kidney stones.25,26 Therefore, the quantitative detection of AA content is particularly critical. Up to now, researchers have established a variety of methods for the detection of AA content in food or tap water, such as: liquid chromatography, enzyme-based colorimetry, electrochemical method, nuclear magnetic resonance and spectrophotometry,27–30 etc. However, due to the limitations of the above detection methods, these methods are not attractive. In order to overcome the limitations of the above methods. Fluorescent sensors31–33 has entered our sight for its high sensitivity, specificity and low cost.
According to the above-mentioned researches for detecting Sn(II) and AA, fluorescence method has the potential to be applied to the detection of two substances. The mechanism of fluorescence method for detecting substances is commonly used fluorescence resonance energy transfer (FRET).6 The distance between the fluorescent probe and the fluorescent absorber is strict and the experimental operation is complicated. The inner filter effect (IFE)32,34 does not require strict conditions, also can achieve the same effect, so IFE is simpler and more practical. The key to designing IFE-based fluorescent sensors is the choice of fluorescent probes and fluorescent absorbers.6 Lanthanide-doped UCNPs have excellent optical properties such as strong light stability, deep penetration of excitation light, and negligible fluorescence background,35 which can well replace traditional fluorescent probes (quantum dots and organic dyes, etc.). The choice of fluorescent absorber should meet the requirements for detecting two substances.
Therefore, we designed a dual-function nanosensor based on IFE using NaYF4:Yb,Er@NaYF4 UCNPs and Fe(III)/1,10-phenanthroline. UCNPs can emit strong green light under the excitation of 980 nm laser, and their main emission peaks are located at 522, 540 and 655 nm. Because the absorption spectra of Fe(III) and 1,10-phenanthroline do not overlap with green emission of UCNPs. The addition of Fe(III) and 1,10-phenanthroline will not affect the fluorescence of UCNPs. After adding Sn(II) or AA, Sn(II) can react with Fe(III) as follows
| Sn2+ + 2Fe3+ = Sn4+ + 2Fe2+ |
Sn(II) can reduce Fe(III) to Fe(II), and will not continue to react with Fe(II) to produce iron element.
AA can react with Fe(III) as follows
| C6H8O6 + 2Fe3+ = C6H6O6 + 2Fe2+ + 2H+ |
AA reacts with Fe(III) and becomes dehydroascorbic acid while Fe(III) is converted to Fe(II). At the same time, AA does not continue to react with Fe(II).33 Both Sn(II) and AA can react with Fe(III), the Fe(II) produced can react with 1,10-phenanthroline to form an orange complex, this complex has strong absorption band in the range of 350 nm to 600 nm, the absorption band overlaps the green emission peak of UCNPs at 540 nm. Based on the IFE, Fe(II)–1,10-phenanthroline as fluorescent absorber. The green emission of UCNPs can be weakened, and the quenching efficiency is related to the concentration of Sn(II) or AA (Scheme 1). The nanosensor demonstrates high sensitivity and specificity, moreover, the reaction process of the bifunctional nanosensor is very fast. The NaYF4:Yb,Er@NaYF4 UCNPS/Fe(III)/1,10-phenanthroline nanosensor provide a rapid, effective, sensitive and specific detection platform for the detection of Sn(II) or AA content in tap water or spring water.
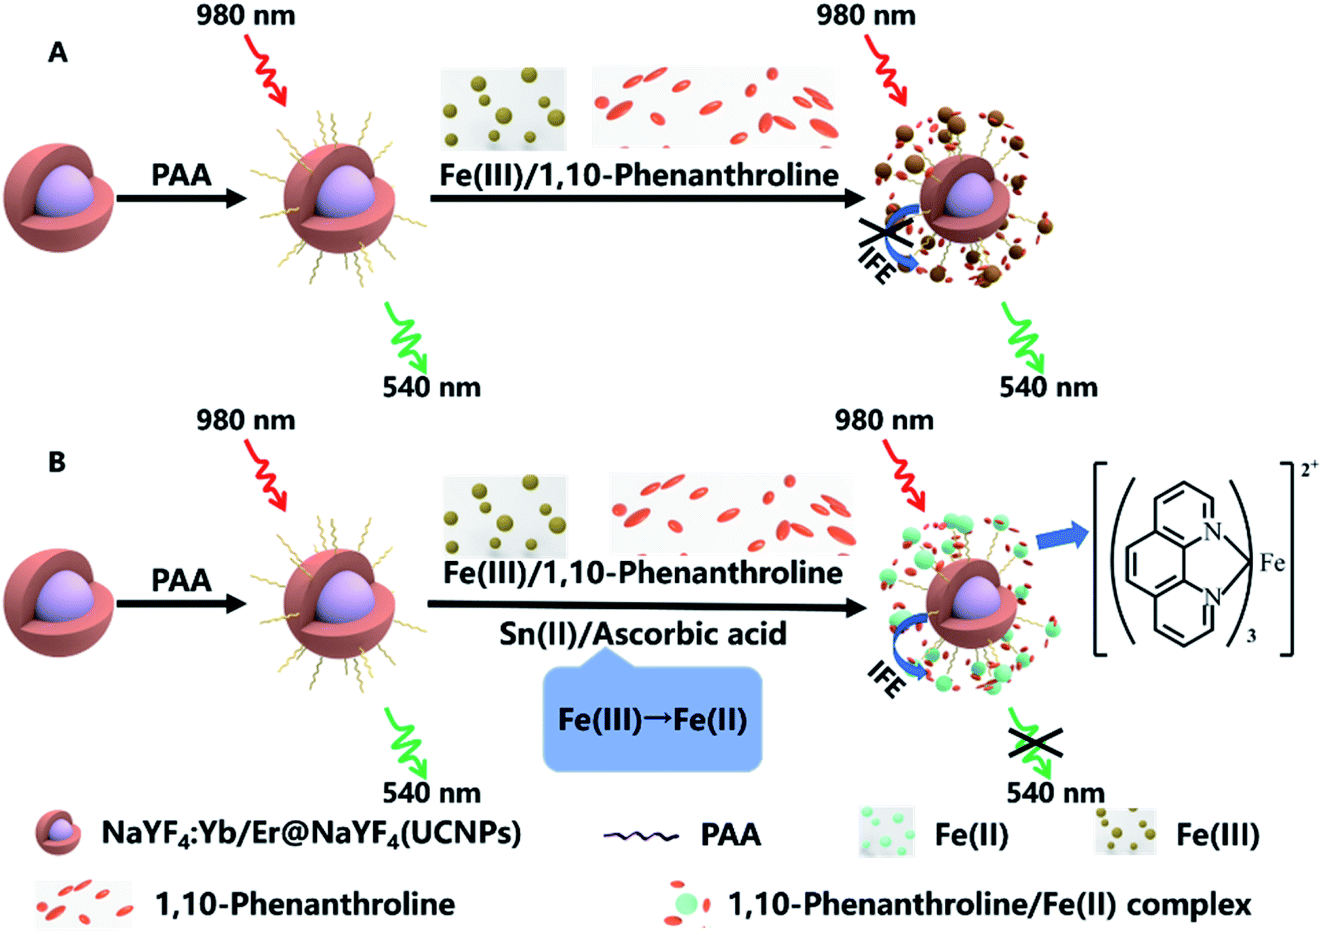 | ||
| Scheme 1 Schematic of the principle of detecting Sn(II) and ascorbic acid (AA) with UCNPs/1,10-phenanthroline/Fe(III) system. | ||
Materials and methods
Materials
Rare earth acetates Y(CH3CO2)3·4H2O, Yb(CH3CO2)3·4H2O, Er(CH3CO2)3·4H2O were purchased from Tianyi New Material Co., Ltd (Jining, China). 1-Octadecene (ODE 90%), poly (acrylic acid) (PAA), potassium chloride (KCl), L-ascorbic acid (AA), L-proline (Pro), L-phenylalanine (Phe), L-methionine (Met), L-alanine (Ala), L-lysine (Lys), L-arginine (Arg), glycine (Gly), L-glutamic (Glu), L-cystine (Cys), glucose, L-histidine (His), L-tryptophan (Trp), L-leucine (Leu), L-serine (Ser), L-threonine (Thr), L-valine (Val) were obtained from the Aladdin Reagent Company (Shanghai, China). Sodium hydroxide (NaOH), oleic acid (OA), ammonium fluoride (NH4F), cyclohexane, hexadecyl trimethyl ammonium bromide (CTAB), sodium dihydrogen phosphate (NaH2PO4), disodium hydrogen phosphate (Na2HPO4), hydrochloric acid (HCl), sodium chloride (NaCl), sodium carbonate anhydrous (Na2CO3), potassium bromide (KBr), potassium iodide (KI), 1,10-phenanthroline were purchased from Sinopharm Chemical Reagent Company. The above reagents are not directly used after treatment. Water was treated in Milli-Q purification system.Characterization
The transmission electron microscope image was collected using JEM-1400 transmission electron microscope, which characterizes the particle size and morphology of UCNPs. UV-Vis absorption spectrum was tested with UV-2600 spectrophotometer (Shimadzu). Fourier transform infrared (FT-IR) spectroscopy spectra was measured with Bruker ALPHA-T FT-IR spectrometer. The Germany Bruker Axs D8-Focus powder diffractometer with Cu Kα radiation (λ = 1.5418 Å) was used to record the X-ray diffraction (XRD) patterns of UCNPs. The fluorescence spectra were characterized on an Edinburgh FLS 980 equipped with external 980 nm diode laser. Cyclic voltammograms were obtained using a three-electrode configuration, connected to electrochemical work station equipped with an electrochemical analyser (CH 660). The auxiliary electrode and working electrode were platinum sheet. In addition, Ag/AgCl was the reference electrode in supporting electrolyte.Synthesis of NaYF4:Yb/Er@NaYF4 core–shell nanoparticles
UCNPs are synthesized by solvothermal method.32 The rare earth acetate was added to a four-necked flask at the ratio of Y/Yb/Er = 78![[thin space (1/6-em)]](https://www.rsc.org/images/entities/char_2009.gif) :20:2, and then 10 mL of oleic acid (OA) and 15 mL of 1-octadecene (ODE) were injected into the flask. The solution was heated to 150 degrees Celsius and held for 30 minutes. This process completely dissolved the rare earth acetates. The solution was naturally cooled to room temperature. A methanol solution containing 2.5 mmol of sodium hydroxide (NaOH) and 4 mmol of ammonium fluoride (NH4F) was added to the four-necked flask. The solution was heat to 50 degrees Celsius and held for 30 minutes. And then temperature was raised to 100 degrees Celsius and keep for 10 minutes to remove methanol. The temperature of the solution continued to rise to 290 degrees Celsius and solution was kept for 60 minutes. Turn off the heat and cool the solution to room temperature. The whole process is carried out under stirring. The solution was poured into a centrifuged with ethanol, and then the nanoparticles were washed three or four times with cyclohexane/ethanol (1:1 v:v). Finally, NaYF4:Yb/Er UCNPs were dispersed in cyclohexane. The synthesis process of NaYF4:Yb/Er@NaYF4 core–shell UCNPs is similar to that of core UCNPs. Finally, NaYF4:Yb/Er@NaYF4 core–shell UCNPs were dispersed in cyclohexane for use.
:20:2, and then 10 mL of oleic acid (OA) and 15 mL of 1-octadecene (ODE) were injected into the flask. The solution was heated to 150 degrees Celsius and held for 30 minutes. This process completely dissolved the rare earth acetates. The solution was naturally cooled to room temperature. A methanol solution containing 2.5 mmol of sodium hydroxide (NaOH) and 4 mmol of ammonium fluoride (NH4F) was added to the four-necked flask. The solution was heat to 50 degrees Celsius and held for 30 minutes. And then temperature was raised to 100 degrees Celsius and keep for 10 minutes to remove methanol. The temperature of the solution continued to rise to 290 degrees Celsius and solution was kept for 60 minutes. Turn off the heat and cool the solution to room temperature. The whole process is carried out under stirring. The solution was poured into a centrifuged with ethanol, and then the nanoparticles were washed three or four times with cyclohexane/ethanol (1:1 v:v). Finally, NaYF4:Yb/Er UCNPs were dispersed in cyclohexane. The synthesis process of NaYF4:Yb/Er@NaYF4 core–shell UCNPs is similar to that of core UCNPs. Finally, NaYF4:Yb/Er@NaYF4 core–shell UCNPs were dispersed in cyclohexane for use.
Synthesis of functionalized upconversion nanoparticles
The preparation process of water-soluble PAA-coated UCNPs is as follows: add CTAB to ultrapure water, sonicate for 30 minutes, adding core–shell UCNPs to the solution under stirring conditions. This process transfers UCNPs from cyclohexane to ultrapure water. The solution was injected 45 microliters of ammonia and 30 microliters of PAA, and then the solution was ultrasonically dispersed for 30 minutes. Finally, 40 mL of isopropanol was added into the mixture, and the mixture was centrifuged and freeze-dried. Thus, water-soluble NaYF4:Yb/Er@NaYF4@PAA were prepared.Experimental process for detecting Sn(II) and AA
The process of using this dual-function detection platform to detect Sn(II) or AA content. Adding a fixed concentration of Fe(III) aqueous solution into a group of test tubes respectively, and then a set of different concentrations of Sn(II) aqueous solution were injected into the test tubes. Shake to mix the solution uniformly. UCNPs@PAA (0.8 mg mL−1, 0.5 mL) was added to each test tube, and then add 1,10-phenanthroline aqueous solution (8 mmol L−1, 0.5 mL) to each test tube. Finally, ultrapure water was added to each test tube to adjust the volume of the solution to 2 mL, shake to mix the solution uniformly. Fluorescence spectra and color change of the solution were collected. The detection process of AA is the same as Sn(II).Results and discussion
Characterization of UCNPs
The UCNPs synthesized can convert near-infrared light into visible light. As Fig. 1a shown, it can be seen that the NaYF4:Yb/Er UCNPs synthesized by the solvent method are uniform in size and morphology, and their average grain diameter is ∼30 nm. The later prepared NaYF4:Yb/Er@NaYF4 UCNPs are uniform hexagonal phase with uniform size and an average particle size of ∼40 nm (Fig. 1b). After modification of the surface of UCNPs, it was converted into water-soluble UCNPs@PAA. As shown in Fig. 1c, compared with NaYF4:Yb/Er@NaYF4 UCNPs, the average grain diameter of UCNPs@PAA is larger. Water-soluble UCNPs@PAA was the same hexagonal phase. At the same time, it can be observed that the surface of UCNPs@PAA is wrapped with a uniform PAA layer. The diffraction peaks of NaYF4:Yb/Er UCNPs, NaYF4:Yb/Er@NaYF4 UCNPs and UCNPs@PAA mentioned above all correspond to the hexagonal phase NaYF4 nanocrystals (JCPDS no. 28-1192). The analysis results show that the above UCNPs have high crystallinity32 (Fig. 1d).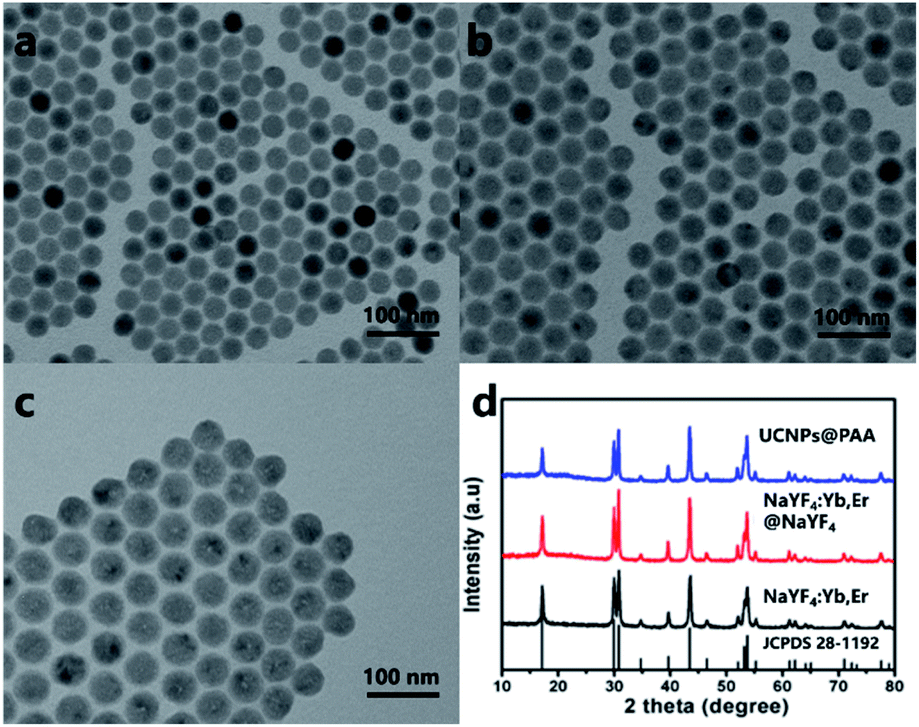 | ||
| Fig. 1 (a) TEM images of NaYF4:Yb/Er (20/2 mol%) core nanoparticles dissolved in cyclohexane, (b) TEM images of NaYF4:Yb/Er@NaYF4 core–shell nanoparticles dissolved in cyclohexane, (c) TEM images of PAA-coated UCNPs dissolved in water. (d) XRD of OA-coated NaYF4:Yb/Er core nanoparticles, NaYF4:Yb/Er@NaYF4 core–shell nanoparticles, PAA-coated UCNPs. | ||
According to the TEM image, we can preliminarily confirm that PAA is coated on the surface of UCNPs. To further verify this fact, we collected the FT-IR spectra of UCNPs before and after PAA coating (Fig. S1†).
The mechanism for Sn(II) and AA detection
As shown in Fig. 2a, the emission peaks of NaYF4:Yb/Er UCNPs are located at 522, 540 and 655 nm, which correspond to the energy level transitions of 2H11/2 → 4I15/2, 4S3/2 → 4I15/2 and 4F9/2 → 4I15/2, respectively. After the introduction of NaYF4 shell, the emission peak of UCNPs remains unchanged, but the fluorescence intensity is significantly enhanced. After surface functionalization of UCNPs, it was converted into water-soluble UCNPs@PAA. Due to the change of ligands on the surface and solvents of nanoparticles, the fluorescence intensity of UCNPs@PAA was obviously weakened and UCNPs@PAA has larger red–green emission ratio. The absorption spectra and emission spectra of the UCNPs/1,10-phenanthline/Fe(III) detection system designed by us were tested as shown in Fig. 2b. 1,10-Phenanthline/Fe(III) and pure 1,10-phenanthline have strong absorption band at 300 nm–350 nm, which do not overlap with the emission peaks of UCNPs, so the green-light emission of UCNPs is not affected. However, when Fe(II) is added to the 1,10-phenanthroline aqueous solution, the reaction generated orange complex (Fig. S2 and S3†), this complex has strong absorption in the range of 350 nm to 600 nm. The absorption band can completely overlap with the green-light emission peak of UCNPs at 540 nm, which can achieve IFE and weaken the green-light emission of UCNPs. The mechanism is shown in Fig. 2c. At the same time, we also tested the fluorescent lifetime of UCNPs/1,10-phenanthroline/Fe(III) before and after the addition of Sn(II) and AA. The fluorescent lifetime at 540 nm was almost the same before and after the addition of Sn(II) and AA (Fig. S4†), which further proved that the decrease of the fluorescence intensity of UCNPs was caused by the IFE between UCNPs and Fe(II)–1,10-phenanthroline complex.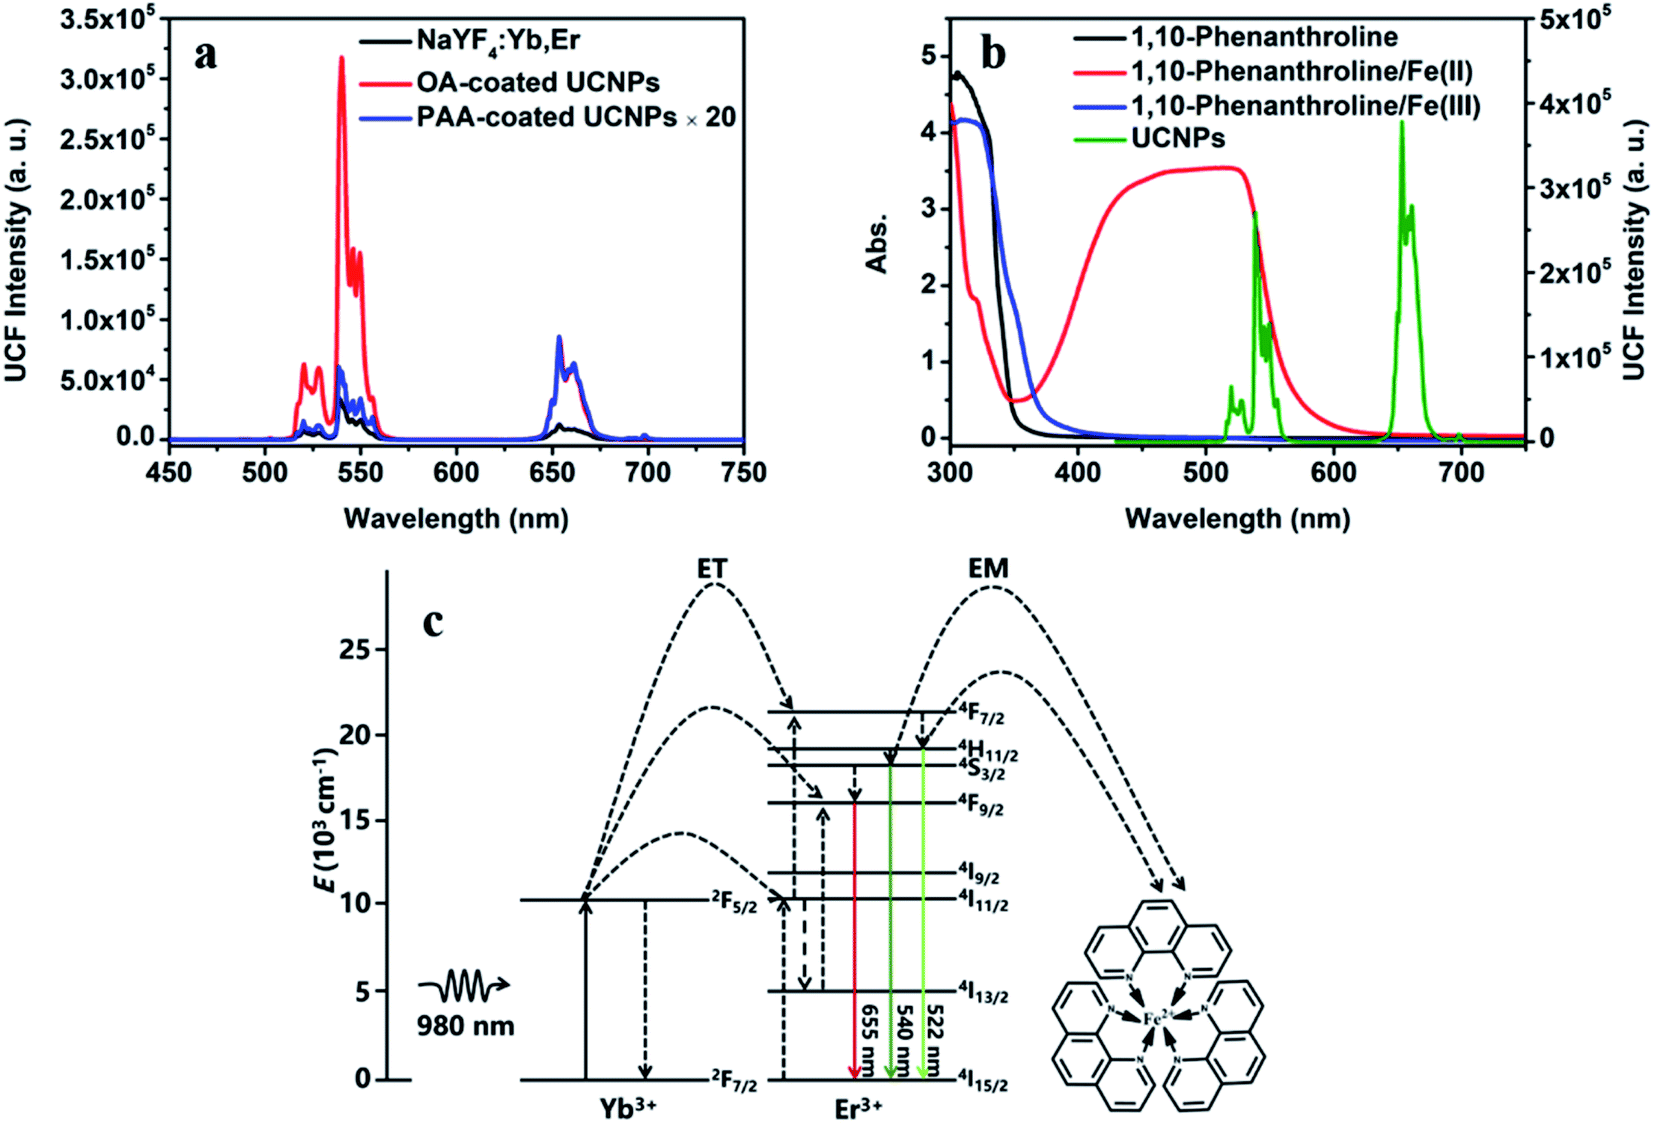 | ||
| Fig. 2 (a) The upconversion emission spectrum of OA-coated core UCNPs (black line), OA-coated core–shell UCNPs (red line) and PAA-coated UCNPs (blue line). (b) Absorption spectrum of 1,10-phenanthroline (2.0 mmol L−1) (black line),1,10-phenanthroline (2.0 mmol L−1)/Fe(II) (0.4 mmol L−1) (red line) and 1,10-phenanthroline (2.0 mmol L−1)/Fe(III) (0.4 mmol L−1) (blue line). The upconversion emission spectrum of PAA-coated UCNPs (green line). (c) Proposed excitation and IFE mechanism in UCNPs/Fe(II)–1,10-phenanthroline system. [1,10-phenanthroline] = 2.0 mmol L−1, [Fe(II)] = 0.4 mmol L−1, [Fe(III)] = 0.4 mmol L−1. | ||
In UCNPs/1,10-phenanthroline/Fe(III) bifunctional nanometer detection platform, the fluorescence intensity of UCNPs is related to the content of Sn(II) (Fig. 3a). At the same time, after adding different concentrations of Sn(II) (from 0 mM to 0.6 mM) to the detection platform, we tested the time-dependent of the fluorescence intensity at 540 nm of the detection platform. It can be seen from Fig. S5† that the emission spectrum tested immediately after adding Sn(II) and tested after 30 minutes of reaction completely overlap. Thus, the reaction time between Sn(II) and Fe(III) is extremely short. The detection platform has good long and short-term stability (Fig. 3b and S6a†). As shown in Fig. S7a and b,† the redox potential of Fe(III) is −0.045 V. The redox potential of Sn(II) is 0.610 V. The redox potential of Sn(II) is higher than the redox potential of Fe(III). So Fe(III) and Sn(II) can undergo oxidation–reduction reactions. The reaction is as follows
| Sn2+ + 2Fe3+ = Sn4+ + 2Fe2+ |
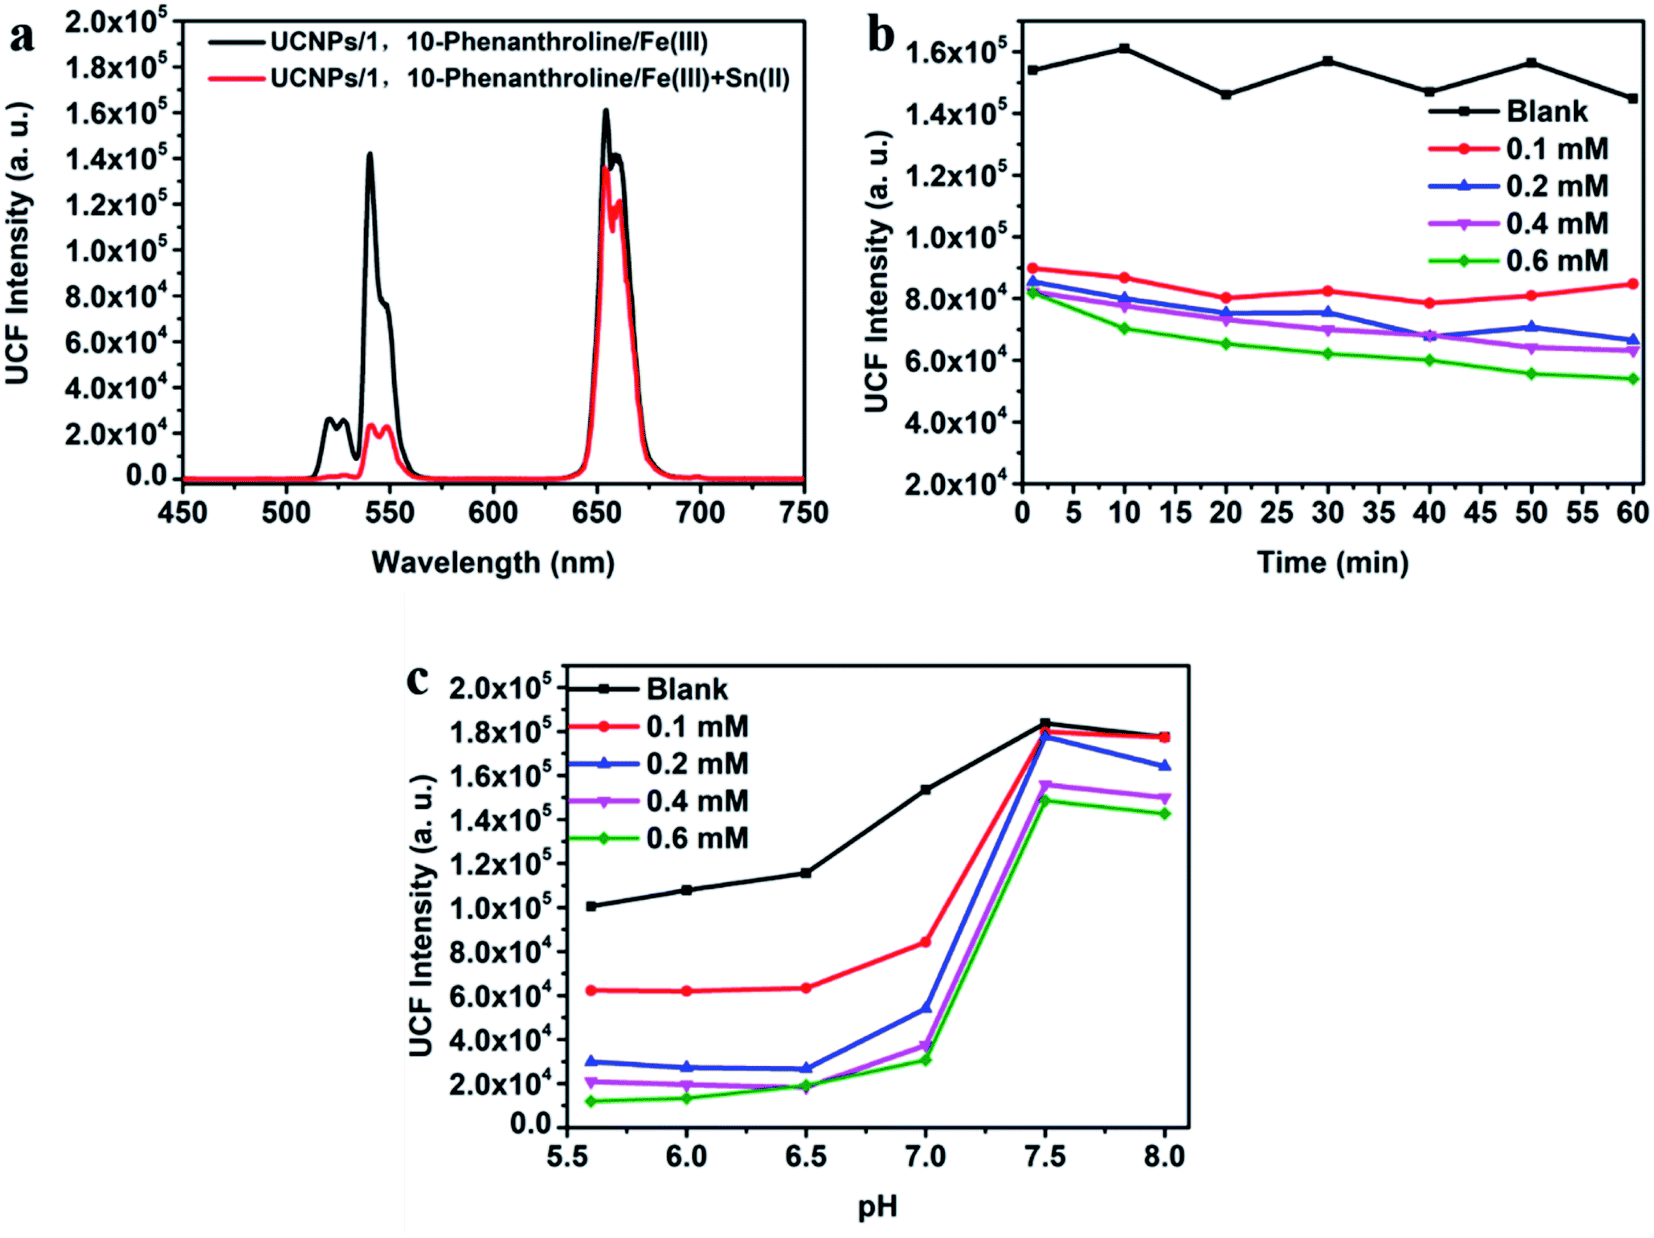 | ||
| Fig. 3 (a) The upconversion emission spectrum of UCNPs/1,10-phenanthroline/Fe(III) (black line), UCNPs/1,10-phenanthroline/Fe(III)/Sn(II) (600 μmol L−1) (red line). (b) Time-dependent fluorescence intensity at 540 nm of UCNPs/1,10-phenanthroline/Fe(III) system with different concentration of Sn(II). (c) Upconversion fluorescence intensity at 540 nm of UCNPs/1,10-phenanthroline/Fe(III) system in different concentration of Sn(II) solution with different pH. [UCNPs] = 0.2 mg mL−1, [1,10-phenanthroline] = 2.0 mmol L−1, [Fe(III)] = 0.4 mmol L−1. | ||
Sn(II) converts Fe(III) to Fe(II), and then Fe(II) reacts with 1,10-phenanthroline to form Fe(II)–1,10-phenanthroline complex, which makes the fluorescence intensity of UCNPs decrease through IFE. The fluorescence intensity of the detection platform at 540 nm fluctuates little with the extension of time, and can remain stable for a long time (Fig. 3b). We also tested the relationship between the fluorescence intensity at 540 nm of the detection system and pH after adding different concentrations of Sn(II) (from 0 mM to 0.6 mM). We used hydrochloric acid (HCl) to adjust the pH of the detection platform to acidity, and ammonia water (NH4OH) to adjust the pH to alkaline. And then pH meter (PHS-3C) tests the pH of the detection platform. As shown in Fig. 3c, when the pH of the system >7.0, Sn(II) generates Sn(OH)2 under alkaline conditions, so that the reaction between Sn(II) and Fe(III) cannot occur. Fe(II)–1,10-phenanthroline complex will not be generated in the system, and IFE will not occur. Therefore, the fluorescence intensity of UCNPs will not be weakened, and the goal of detecting the concentration of Sn(II) cannot be achieved. In order to ensure the smooth progress of the experiment, we adjusted the pH of the system to weakly acidic (pH = 6.5) for subsequent experiments.
As shown in Fig. 4a, after adding AA to the UCNPs/1,10-phenanthroline/Fe(III) detection system, the fluorescence intensity at 540 nm of the system changed significantly, and the quenching efficiency of fluorescence intensity was related to the concentration of AA. In order to evaluate the instantaneous response and acid–base tolerance of the detection system, we tested the time-dependent and pH-dependent emission spectrum after adding different concentrations of AA (from 0 mM to 0.8 mM). As shown in Fig. 4b and S6b,† the fluorescence intensity at different concentrations of AA decreased slightly with time, but the overall effect was small. Thus, the detection platform has good long and short-term stability. It can be seen from Fig. S8† that the emission spectrum tested immediately after adding AA and tested after 30 minutes of reaction almost completely overlap. Thus, the reaction time between AA and Fe(III) is extremely short. We used hydrochloric acid (HCl) or ammonia water (NH4OH) to adjust the pH. The pH value of the detection platform is tested by pH meter (PHS-3C). At the same time, the system has a high tolerance to pH, and the change of pH has almost no effect on the fluorescence intensity (Fig. 4c). As shown in Fig. S7a and c,† the redox potential of Fe(III) is −0.045 V. The redox potential of AA is 0.996 V. The redox potential of AA is higher than the redox potential of Fe(III). So Fe(III) and AA can undergo oxidation–reduction reactions. After adding AA to the detection system, AA reacts with Fe(III) as follows
| C6H8O6 + 2Fe3+ = C6H6O6 + 2Fe2+ + 2H+ |
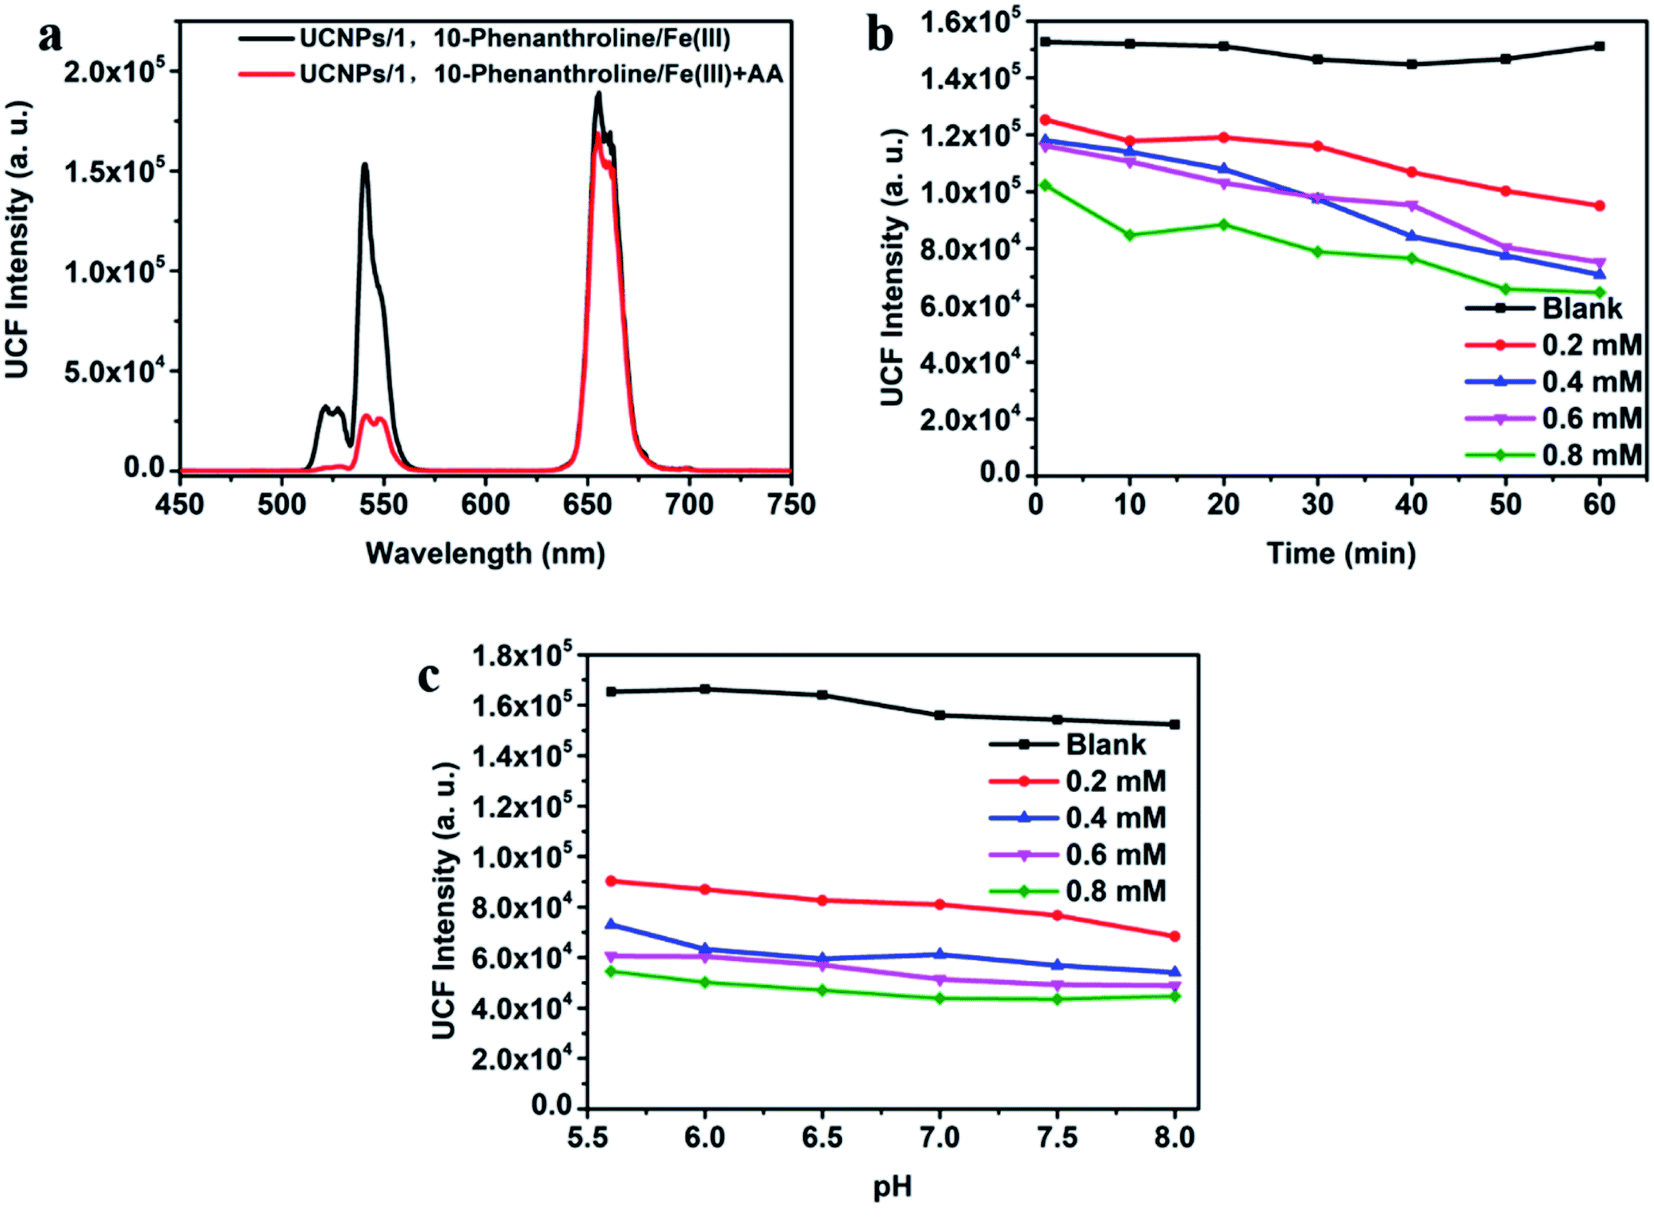 | ||
| Fig. 4 (a) The upconversion emission spectrum of UCNPs/1,10-phenanthroline/Fe(III) (black line), UCNPs/1,10-phenanthroline/Fe(III)/AA (800 μmol L−1) (red line). (b) Time-dependent fluorescence intensity at 540 nm of UCNPs/1,10-phenanthroline/Fe(III) system with different concentration of AA. (c) Upconversion fluorescence intensity at 540 nm of UCNPs/1,10-phenanthroline/Fe(III) system in different concentration of AA solution with different pH. [UCNPs] = 0.2 mg mL−1, [1,10-phenanthroline] = 2.0 mmol L−1, [Fe(III)] = 0.4 mmol L−1. | ||
AA reduces Fe(III) to Fe(II), and then Fe(II) complexes with 1,10-phenanthroline to form an orange complex. The green-light emission of the system weakens by IFE between UCNPs and the complex.
Quantitative analysis of Sn(II) and AA
The dual-function detection platform designed can realize the quantitative detection of Sn(II) and AA. Fig. 5a show the fluorescence spectrum obtained by adding Sn(II) with a certain concentration gradient into the UCNPs (0.8 mg mL−1, 0.5 mL)/1,10-phenanthroline (8.0 mmol L−1, 0.5 mL)/Fe(III) (4 mmol L−1, 0.2 mL) detection system. From the change of fluorescence intensity in the spectrum. We can observe that the fluorescence intensity of the detection system at 540 nm gradually weakened with the increase of Sn(II) concentration. When Sn(II) reached 500 μm, the quenching efficiency reached 82% and then gradually stabilized (Fig. 5b). When Sn(II) concentration is within 0–140 μM, the quenching efficiency has a strict linear relationship with the Sn(II) concentration, and the linear regression equation is| (F − F0)/F0 = 0.0036[Sn(II)] + 0.0564, (R2 = 0.989) |
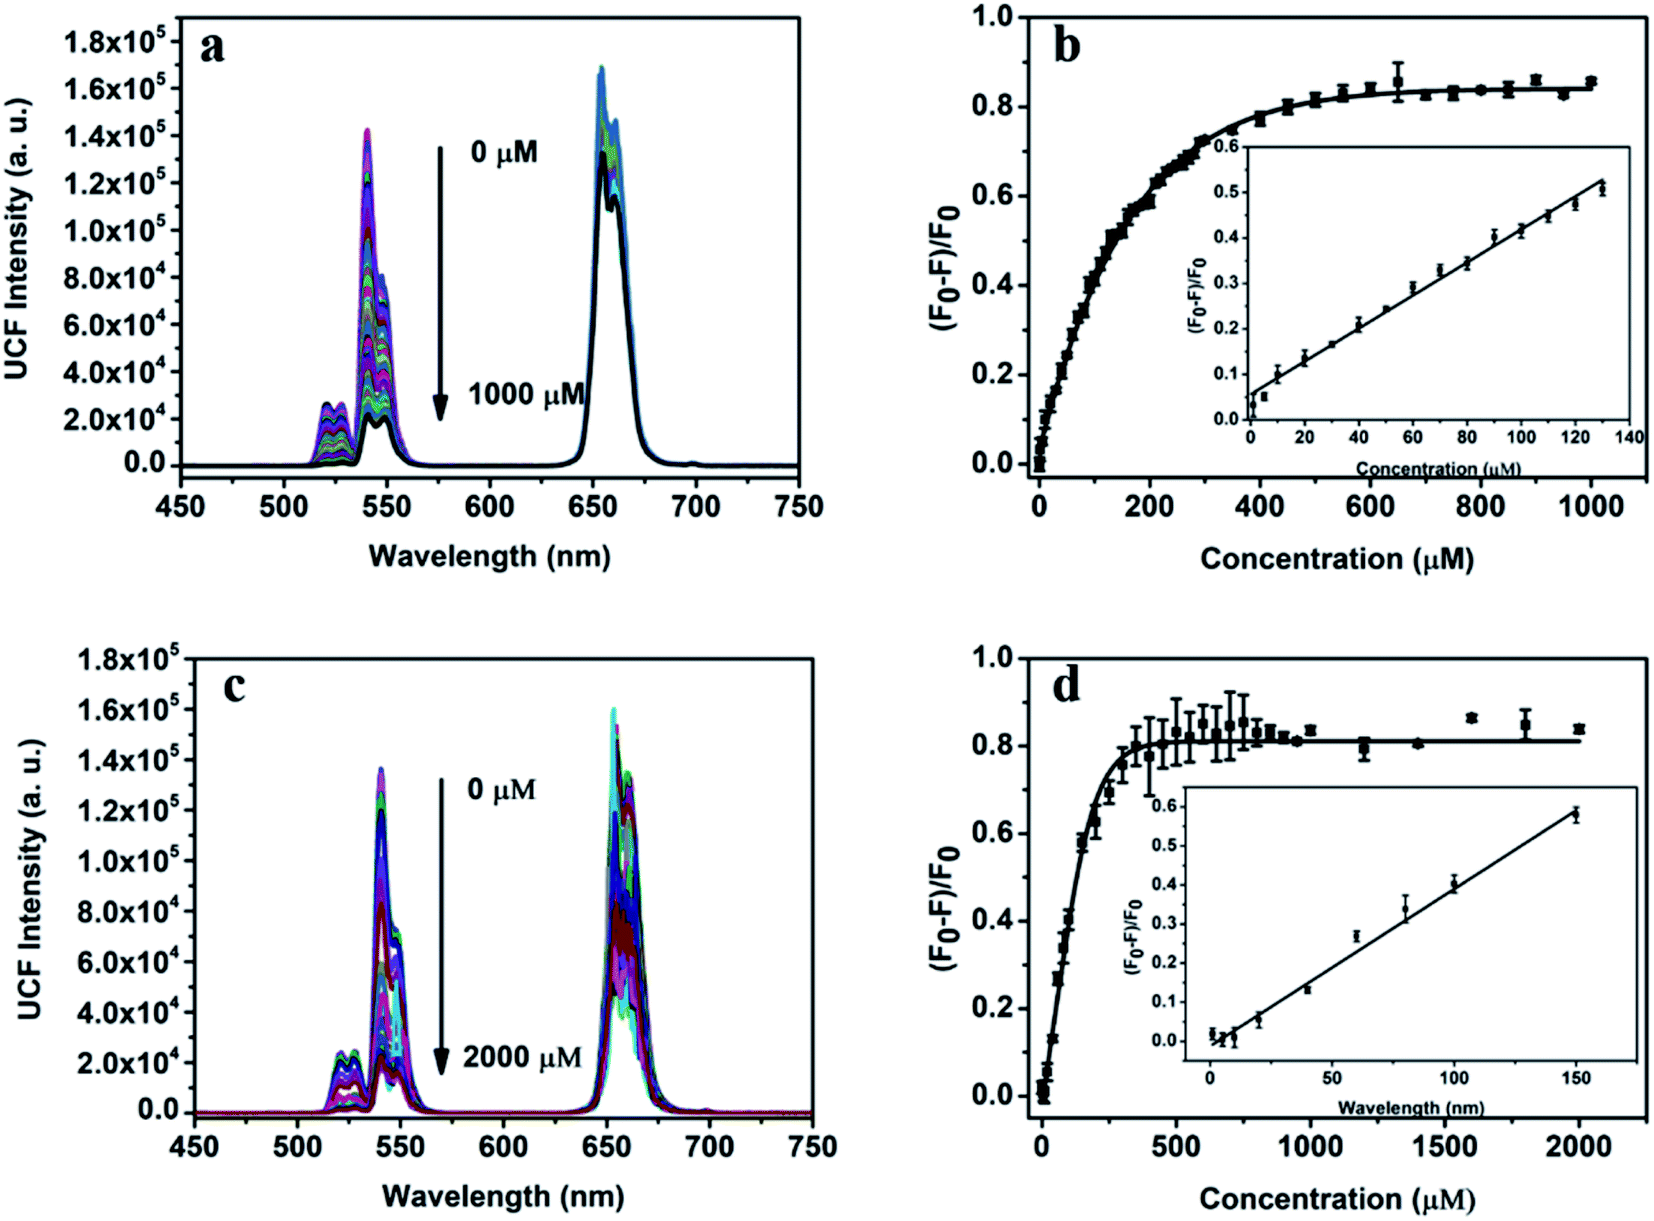 | ||
| Fig. 5 (a) Fluorescence spectrum of UCNPs/1,10-phenanthroline/Fe(III) system with different concentrations of Sn(II). (b) The plot of the quenching efficiency at 540 nm vs. concentrations of Sn(II). Inset: The linearity of the quenching efficiency at 540 nm towards concentrations of Fe(II). (c) Fluorescence spectra of UCNPs/1,10-phenanthroline/Fe(III) system with different concentrations of AA. (d) The plot of the quenching efficiency at 540 nm vs. concentrations of AA. Inset: The linearity of the quenching efficiency at 540 nm towards concentrations of AA. [UCNPs] = 0.2 mg mL−1, [1,10-phenanthroline] = 2.0 mmol L−1. | ||
F0 and F are the fluorescence intensity at 540 nm before and after adding Sn(II) to the detection system. According to the 3σ rule, the detection limit of the detection platform for Sn(II) can be calculated to be 1.08 μM.
In addition to the quantitative detection of Sn(II), this detection platform can also be used for quantitative detection of AA. Fig. 5c shows the fluorescence spectrum of UCNPs (0.8 mg mL−1, 0.5 mL)/1,10-phenanthroline (8.0 mmol L−1, 0.5 mL)/Fe(III) (4 mmol L−1, 0.2 mL) system with a concentration gradient of AA. The concentration of AA ranged from 0 to 2000 μM. In the concentration range, with the increase of AA concentration, the intensity of green-lighting emission peak at 540 nm of the detection system gradually weakened. When the concentration of AA gradually increased to 500 μM, the quenching efficiency of the system reached 83%. When the concentration of AA is greater than 500 μM, the quenching efficiency tended to be stable (Fig. 5d). When the concentration of AA is within 0–150 μM, the quenching efficiency of the system has a linear relationship with the concentration of AA, and the linear regression equation is
| (F −F0)/F0 = 0.00402[Sn(II)] − 0.012, (R2 = 0.975) |
F and F0 are the fluorescence intensity at 540 nm with and without AA in the detection system, respectively. According to the 3σ rule, the detection limit of the platform for AA can be calculated to be 0.97 μM. Table 1 listed a comparison of this work and the previous works for Sn(II) and AA sensing. In terms of detection limit and linear range, although our method was not the optimal in Table 1, it has the best overall performance. Thus, this method was more applicable for daily assay of Sn(II) and AA.
| Substance | Real sample | Linear range (μM) | Detection limit (μM) | Ref. |
|---|---|---|---|---|
| Sn(II) | River water | 0–3.37 × 10⁴ | 2.27 | 36 |
| Tap water and river water | 0.5–100 | 0.36 | 37 | |
| Cancer cell | 1–6 | 0.116 | 11 | |
| Live cell | 0–62.5 | 0.115 | 38 | |
| Tap water | 0–500 | 4.8 | 39 | |
| Tap water | 34.4–1500 | 14 | 40 | |
| Tap water and spring water | 0–140 | 1.08 | This work | |
| AA | Water and juice | 20–500 | 1.21 | 41 |
| Human serum | 10–500 | 2.5 | 42 | |
| Fruit juice | 0–70 | 3.17 | 43 | |
| Beverage | 1–80 | 0.48 | 44 | |
| Lake water | 0.1–800 | 50 | 45 | |
| Jujube fruits | 5–350 | 3.11 | 46 | |
| Fruits | 100–4000 | 80 | 47 | |
| Tap water and spring water | 0–150 | 0.97 | This work |
Selectivity for Sn(II) and AA detection
To evaluate the specificity of this bifunctional detection platform for the detection of Sn(II) and AA, we studied the effects of different metal ions, sugars and amino acids on the detection results under the same experimental conditions. Fig. 6a show the fluorescence spectrum after adding Sn(II), AA and a 10-fold excess of different ions, sugars and amino acids to the detection system. Fig. 6b shows the histogram of quenching efficiency after adding Sn(II), AA and a 10-fold excess of different ions, sugars and amino acids to the detection system. Only when Sn(II) and AA add, the fluorescence intensity of the detection system at 540 nm significantly weakens, and its fluorescence quenching efficiency can reach 82%. At the same time, other substances cannot achieve the same effect. Therefore, it can be proved that the bifunctional detection platform designed by us has fine specificity for detecting Sn(II) and AA.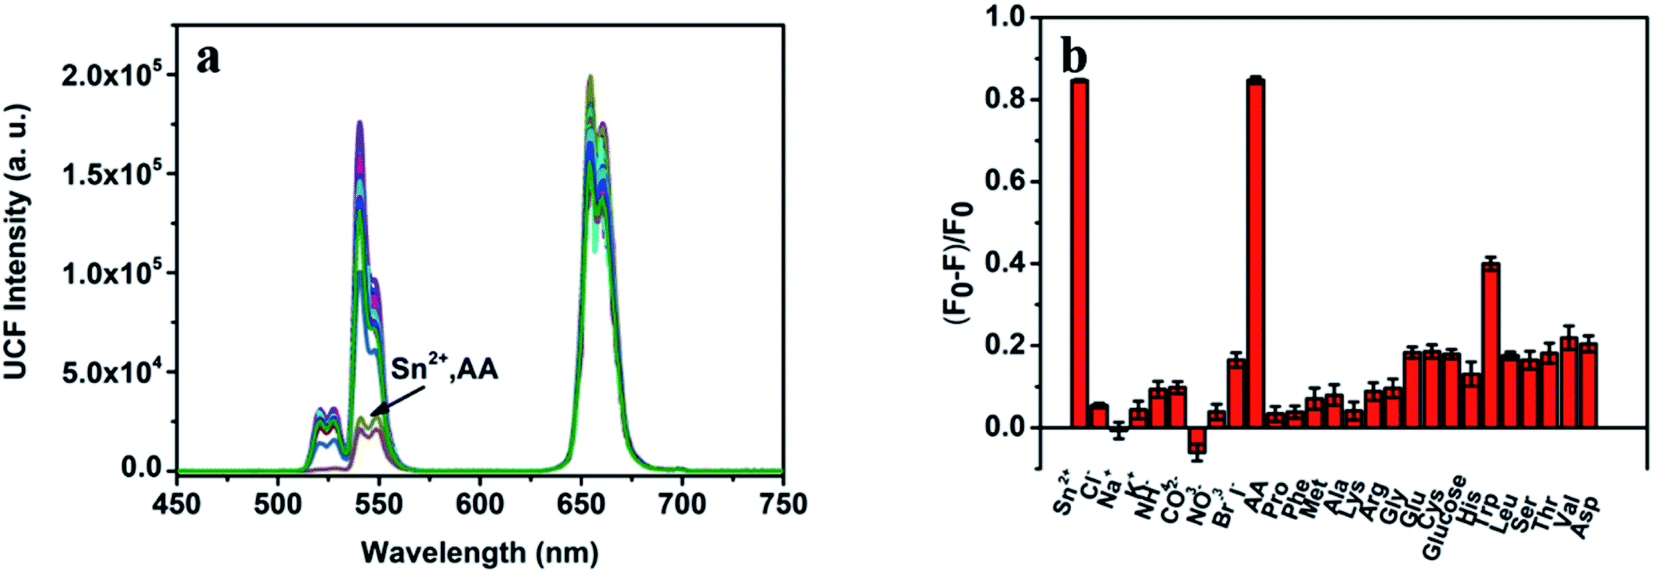 | ||
| Fig. 6 (a) Fluorescence spectra of UCNPs/1,10-phenanthroline/Fe(III) system with Sn(II), AA (200 μmol L−1) and 10-fold excess (2000 μmol L−1) of metal chlorides, saccharides, and other amino acids. (b) Histogram showing the fluorescence response at 540 nm of UCNPs/1,10-phenanthroline/Fe(III) system with Sn(II), AA (200 μmol L−1) and 10-fold excess (2000 μmol L−1) of metal chlorides, saccharides, and other amino acids. [UCNPs] = 0.2 mg mL−1, [1,10-phenanthroline] = 2.0 mmol L−1, [Fe(III)] = 0.4 mmol L−1. | ||
Real samples detection
In the previous article, we discussed the sensitivity and specificity of the bifunctional detection platform for detecting Sn(II) and AA. This detection platform has high sensitivity and specificity, so we consider applying it to detect Sn(II) and AA content in actual samples. Before the experiment, we first centrifuged the tap water and spring water samples and filtered the supernatant for use.We treated drinking water and spring water as a reagent solution. The experimental process are the same as those in the detection section above. It can be seen from Table 2 that the recovery rate of Sn(II) on this detection platform is between 99.2% and 104.4%, which proves that this detection platform can overcome the influence of complex detection environment on the experimental results and can apply to the detection of Sn(II) content in drinking water and spring water in daily life.
| Sample | Spiked concentration (μM) | Found (μM) | Recovery (%) | RSD (%) |
|---|---|---|---|---|
| Tap water | 0.0 | 0.0 | — | — |
| 25.0 | 26.1 | 104.4 | 1.2 | |
| 50.0 | 49.7 | 99.4 | 1.8 | |
| 75.0 | 74.4 | 99.2 | 2.6 | |
| 100.0 | 102.5 | 102.5 | 2.4 | |
| Spring water | 0.0 | 0.0 | — | — |
| 25.0 | 25.4 | 101.6 | 0.8 | |
| 50.0 | 49.8 | 99.6 | 1.5 | |
| 75.0 | 74.5 | 99.3 | 2.4 | |
| 100.0 | 103.2 | 103.2 | 2.1 |
For the detection of AA content in the actual samples. The treated tap water and spring water as the solvent. The following experimental steps are the same as those in the detection section above. It can be concluded from Table 3 that the recovery rate of AA of this detection platform is within the range of 99.5–100.8%, and its detection results are less affected by the complex test environment. The results indicate that this detection system has a certain feasibility for the detection of AA in actual samples.
| Sample | Spiked concentration (μM) | Found (μM) | Recovery (%) | RSD (%) |
|---|---|---|---|---|
| Tap water | 0.0 | 0.0 | — | — |
| 25.0 | 25.2 | 100.8 | 0.1 | |
| 50.0 | 50.4 | 100.8 | 0.8 | |
| 75.0 | 74.6 | 99.5 | 1.1 | |
| 100.0 | 100.8 | 100.8 | 0.8 | |
| Spring water | 0.0 | 0.0 | — | — |
| 25.0 | 25.1 | 100.4 | 0.9 | |
| 50.0 | 50.3 | 100.6 | 0.7 | |
| 75.0 | 75.4 | 100.5 | 1.9 | |
| 100.0 | 99.8 | 99.8 | 1.5 |
Conclusion
In this article, we established a bifunctional nanometer detection platform (UCNPs/1,10-phenanthroline/Fe(III)) for Sn(II) and AA detection based on the IFE mechanism. The presence of Fe(III) and 1,10-phenanthroline in the detection platform won't affect emission of UCNPs. Sn(II) has certain reducibility and can reduce Fe(III) to Fe(II). At the same time, AA has an antioxidant effect. Both can convert Fe(III) to Fe(II). And Fe(II) is complexed with 1,10-phenanthroline to form the complex. The absorption band completely overlaps with green-light emission peak of UCNPs. Green-light emission of UCNPs is quenched based on the IFE mechanism. In this paper, a bifunctional detection platform with a low detection limit and high specificity was designed based on the characteristic that Sn(II) and AA can convert Fe(III) to Fe(II). We tested the effect of the detection platform in detecting Sn(II) or AA in tap water and spring water. This dual-functional detection platform is expected to use in water quality detection.Informed consent
Informed consent was obtained from all individual participants included in the study.Conflicts of interest
There are no conflicts to declare.Acknowledgements
This work was supported by Foundation of Shandong Industrial Technology Research Institute (Z1250020007, Z1250020008) and the National Natural Science Foundations of China (51472150).References
- Q. Zhu, Y. Chai, Y. Zhuo and R. Yuan, Biosens. Bioelectron., 2015, 68, 42–48 CrossRef CAS PubMed
.
- N. Huang, S. Zhang, L. Yang, M. Liu, H. Li, Y. Zhang and S. Yao, ACS Appl. Mater. Interfaces, 2015, 7, 17935–17946 CrossRef CAS
- A. Fang, H. Chen, H. Li, M. Liu, Y. Zhang and S. Yao, Biosens. Bioelectron., 2017, 87, 545–551 CrossRef CAS PubMed
- M. M. A. Zeinhom, Y. Wang, L. Sheng, D. Du, L. Li, M.-J. Zhu and Y. Lin, Sens. Actuators, B, 2018, 261, 75–82 CrossRef CAS
- A. J. Mieszawska, W. J. Mulder, Z. A. Fayad and D. P. Cormode, Mol. Pharm., 2013, 10, 831–847 CrossRef CAS
- L. Sun, T. Wang, Y. Sun, Z. Li, H. Song, B. Zhang, G. Zhou, H. Zhou and J. Hu, Talanta, 2020, 207, 120294 CrossRef CAS
- J. Han, X. Liu, H. Xiong, J. Wang, B. Wang, X. Song and W. Wang, Anal. Chem., 2020, 92, 5134–5142 CrossRef CAS
- E. V. Almeida, M. Lugon, J. L. da Silva, N. T. Fukumori, N. P. de Pereira and M. M. Matsuda, J. Nucl. Med. Technol., 2011, 39, 307–311 CrossRef
- A. D. S. Dadda, A. D. C. Teixeira, P. K. Feltes, M. M. Campos, C. E. Leite and C. M. Moriguchi-Jeckel, J. Braz. Chem. Soc., 2014, 25, 1621–1629 CAS
- Q.-X. Guo, Y.-G. Peng, J.-W. Zhang, L. Song, Z. Feng and L.-Z. Gong, Org. Lett., 2009, 11, 4620–4623 CrossRef CAS
- X. Meng, L. You, S. Li, Q. Sun, X. Luo, H. He, J. Wang and F. Zhao, RSC Adv., 2020, 10, 37735–37742 RSC
- M. Tuzen, O. D. Uluozlu, D. Mendil, M. Soylak, L. O. R. Machado, W. N. L. Dos Santos and S. L. C. Ferreira, Food Chem., 2018, 245, 380–384 CrossRef CAS
- H. R. Kricheldorf and S. M. Weidner, J. Polym. Environ., 2021 DOI:10.1007/s10924-020-02042-w
- A. S. Kisomi, A. R. Khorrami, T. Alizadeh, M. Farsadrooh, H. Javadian, A. Asfaram, S. N. AsliPashaki and P. Rafiei, Ultrason. Sonochem., 2018, 44, 129–136 CrossRef CAS PubMed
- E. S. Morte, M. G. Korn, M. L. Saraiva, J. L. Lima and P. C. Pinto, Talanta, 2009, 79, 1100–1103 CrossRef CAS PubMed
- S. Roncevic, A. Benutic, I. Nemet and B. Gabelica, Int. J. Anal. Chem., 2012, 2012, 376381 Search PubMed
- A. A. Abdelwahab, A. M. Elseman, N. F. Alotaibi and A. M. Nassar, Microchem. J., 2020, 156, 104927 CrossRef CAS
- M. Murata, T. A. Ivandini, M. Shibata, S. Nomura, A. Fujishima and Y. Einaga, J. Electroanal. Chem., 2008, 612, 29–36 CrossRef CAS
- G. Yang, Y. Wang and F. Qi, Microchim. Acta, 2012, 177, 365–372 CrossRef CAS
- J. T. Hou, H. S. Kim, C. Duan, M. S. Ji, S. Wang, L. Zeng, W. X. Ren and J. S. Kim, Chem. Commun., 2019, 55, 2533–2536 RSC
- P. Zhao, K. He, Y. Han, Z. Zhang, M. Yu, H. Wang, Y. Huang, Z. Nie and S. Yao, Anal. Chem., 2015, 87, 9998–10005 CrossRef CAS PubMed
- H. Nam, J. E. Kwon, M.-W. Choi, J. Seo, S. Shin, S. Kim and S. Y. Park, ACS Sensors, 2016, 1, 392–398 CrossRef CAS
- S. J. Padayatty, A. Katz, Y. Wang, P. Eck, O. Kwon, J.-H. Lee, S. Chen, C. Corpe, A. Dutta, S. K. Dutta and M. Levine, J. Am. Coll. Nutr., 2003, 22, 18–35 CrossRef CAS PubMed
- R. Yin, S. Q. Mao, B. Zhao, Z. Chong, Y. Yang, C. Zhao, D. Zhang, H. Huang, J. Gao, Z. Li, Y. Jiao, C. Li, S. Liu, D. Wu, W. Gu, Y. G. Yang, G. L. Xu and H. Wang, J. Am. Chem. Soc., 2013, 135, 10396–10403 CrossRef CAS PubMed
- J. Liu, Y. Chen, W. Wang, J. Feng, M. Liang, S. Ma and X. Chen, J. Agric. Food Chem., 2016, 64, 371–380 CrossRef CAS PubMed
- Y. Lili, Y. Yong and C. Qin, J. Inorg. Mater., 2020, 35, 1169–1176 CrossRef
- D. R. S. Lima, M. Cossenza, C. G. Garcia, C. C. Portugal, F. F. d. C. Marques, R. Paes-de-Carvalho and A. D. Pereira Netto, Anal. Methods, 2016, 8, 5441–5447 RSC
- Y. L. Chang, M. Rossetti, H. Vlamakis, D. Casero, G. Sunga, N. Harre, S. Miller, R. Humphries, T. Stappenbeck, K. W. Simpson, R. B. Sartor, G. Wu, J. Lewis, F. Bushman, D. P. B. McGovern, N. Salzman, J. Borneman, R. Xavier, C. Huttenhower and J. Braun, Mucosal Immunol., 2019, 12, 457–467 CrossRef CAS
- J. Eiff, Y. B. Monakhova and B. W. Diehl, J. Agric. Food Chem., 2015, 63, 3135–3143 CrossRef CAS
- P. S. Hung, G. R. Wang, W. A. Chung, T. T. Chiang and P. W. Wu, Nanomaterials, 2020, 10, 1722 CrossRef CAS
- S. D. Wang, L. X. Xie, Y. F. Zhao and Y. N. Wang, Spectrochim. Acta, Part A, 2020, 242, 118750 CrossRef CAS PubMed
- L. Sun, H. Zhou, D. Huang, T. Wang, P. Gao, Y. Sun, G. Zhou and J. Hu, Mikrochim. Acta, 2019, 186, 502 CrossRef PubMed
- H. T. Phuong, T. T. Huong, L. T. Vinh, H. T. Khuyen, D. T. Thao, N. T. Huong, P. T. Lien and L. Q. Minh, J. Rare Earths, 2019, 37, 1183–1187 CrossRef CAS
- W.-J. Niu, D. Shan, R.-H. Zhu, S.-Y. Deng, S. Cosnier and X.-J. Zhang, Carbon, 2016, 96, 1034–1042 CrossRef CAS
- H. Q. Wen, H. Y. Peng, K. Liu, M. H. Bian, Y. J. Xu, L. Dong, X. Yan, W. P. Xu, W. Tao, J. L. Shen, Y. Lu and H. S. Qian, ACS Appl. Mater. Interfaces, 2017, 9, 9226–9232 CrossRef CAS PubMed
- K. S. Patil, P. G. Mahajan and S. R. Patil, Spectrochim. Acta, Part A, 2017, 170, 131–137 CrossRef CAS PubMed
- Z. Yang, Y. Liu, Y. Liu, Y. Wang, H. Rao, Y. Liu, J. Yin, G. Yue, C. Wu, H. Li, X. Liu and X. Wang, Mikrochim. Acta, 2019, 186, 501 CrossRef
- P. Ravichandiran, V. K. Kaliannagounder, A. P. Bella, A. Boguszewska-Czubara, M. Maslyk, C. S. Kim, C. H. Park, P. M. Johnson, B. H. Park, M. K. Han, A. R. Kim and D. J. Yoo, Anal. Chem., 2021, 93, 801–811 CrossRef CAS PubMed
- J. H. Baek, M. G. Choi, N. Y. Kim and S.-K. Chang, Sens. Actuators, B, 2019, 284, 562–567 CrossRef CAS
- M. Trigo-López, A. Muñoz, S. Ibeas, F. Serna, F. C. García and J. M. García, Sens. Actuators, B, 2016, 226, 118–126 CrossRef
- Q. Tan, X. An, S. Pan, H. Liu and X. Hu, Spectrochim. Acta, Part A, 2021, 247, 119122 CrossRef CAS
- Q. Bai, C. Zhang, L. Li, Z. Zhu, L. Wang, F. Jiang, M. Liu, Z. Wang, W. W. Yu, F. Du, Z. Yang and N. Sui, Mikrochim. Acta, 2020, 187, 657 CrossRef CAS
- T. Zhao, C. Zhu, S. Xu, X. Wu, X. Zhang, Y. Zheng, M. Wu, Z. Tong, W. Fang and K. Zhang, Dyes Pigm., 2021, 186, 108995 CrossRef CAS
- F. Ma, J. Luo, X. Li, S. Liu, M. Yang and X. Chen, Spectrochim. Acta, Part A, 2021, 249, 119343 CrossRef CAS PubMed
- L. Gan, Q. Su, Z. Chen and X. Yang, Appl. Surf. Sci., 2020, 530, 147269 CrossRef CAS
- T. Wang, H. Luo, X. Jing, J. Yang, M. Huo and Y. Wang, Molecules, 2021, 26, 1246 CrossRef CAS PubMed
- D. Wang, L. Zhang, P. Li, J. Li and C. Dong, New J. Chem., 2020, 44, 20806–20811 RSC
Footnote |
| † Electronic supplementary information (ESI) available. See DOI: 10.1039/d1ra01925b |
| This journal is © The Royal Society of Chemistry 2021 |