
 Open Access Article
 This Open Access Article is licensed under a Creative Commons Attribution-Non Commercial 3.0 Unported Licence
Molecular design of anticancer drugs from marine fungi derivatives†
Duc Tuan Caoa,
Thi Mai Huong Doanbc,
Van Cuong Phambc,
Thi Hong Minh Leb,
Jung-Woo Chaed,
Hwi-yeol Yund,
Min-Kyun Nad,
Young-Ho Kimd,
Minh Quan Pham *ce and
Van Hung Nguyen*a
*ce and
Van Hung Nguyen*a
aHai Phong University of Medicine and Pharmacy, Haiphong, Vietnam. E-mail: nvhung@hpmu.edu.vn
bInstitute of Marine Biochemistry, Vietnam Academy of Science and Technology, Hanoi, Vietnam
cGraduate University of Science and Technology, Vietnam Academy of Science and Technology, Hanoi, Vietnam. E-mail: minhquanaries@gmail.com
dCollege of Pharmacy, Chungnam National University, Daejeon, Republic of Korea
eInstitute of Natural Products Chemistry, Vietnam Academy of Science and Technology, Hanoi, Vietnam
First published on 4th June 2021
Abstract
Heat shock protein 90 (Hsp90) is one of the most potential targets in cancer therapy. We have demonstrated using a combination of molecular docking and fast pulling of ligand (FPL) simulations that marine fungi derivatives can be possible inhibitors, preventing the biological activity of Hsp90. The computational approaches were validated and compared with previous experiments. Based on the benchmark of available inhibitors of Hsp90, the GOLD docking package using the ChemPLP scoring function was found to be superior over both Autodock Vina and Autodock4 in the preliminary estimation of the ligand-binding affinity and binding pose with the Pearson correlation, R = −0.62. Moreover, FPL calculations were also indicated as a suitable approach to refine docking simulations with a correlation coefficient with the experimental data of R = −0.81. Therefore, the binding affinity of marine fungi derivatives to Hsp90 was evaluated. Docking and FPL calculations suggest that five compounds including 23, 40, 46, 48, and 52 are highly potent inhibitors for Hsp90. The obtained results enhance cancer therapy research.
Introduction
The heat shock protein family, including Hsp27, Hsp70, Hsp90, etc., are crucial elements in cell homeostasis.1–3 In particular, Hsp90 is a dedicated chaperone, and makes up approximately (ca.) 2% of the total protein content and reacts with ca. 200 various proteins. These proteins are a vital part of cell signalling and responses to stress. Hsp90 is thus associated with six stages of cancer,3,4 and consequently the enzyme is associated with cancer cell survival.4 Therefore, Hsp90 is distinguished as a target for cancer therapy.5 Thus, several studies have been executed to discover highly potential inhibitors to prevent biological activity of Hsp90.6–14Nature has always been considered as the main source of therapies; providing folk remedies and therapeutics agents for the treatment of a wide spectrum of diseases. It is estimated that among all the medicines provided on the international market, more than 60% of them are derived from or inspired by natural products, mainly originating from terrestrial plants.15 On the other hand, in the last 50 years, with the advances in new technologies and engineering in marine science, scientists are increasingly shifting their focus toward marine organisms. Numerous publications in this field have proven that marine organisms provide many natural compounds with biological activities ranging from antiviral to anticancer for the pharmaceutical industries.16,17 In addition, the rare and unique marine chemical structures could be a scaffold for developing new drugs with greater efficacy and specificity for therapeutics.18 During the last decades, a reduced number of novel compounds isolated from macro-organisms were observed, but microorganisms such as marine fungi and bacteria are a promising source with several useful drug discoveries already.19,20 In this light, marine fungi are important not only from the perspective of new drugs but also having the advantage of sustainable production of large quantities of compounds with reasonable costs and large-scale cultivation. Based on the information above, in this study, a database of compounds originating from marine fungi will be investigated to look for Hsp90 potential inhibition activity.
Recently, computer-aided drug design (CADD) has been widely used to decrease both cost and time for developing a novel therapy.21,22 In CADD, the thermodynamics metric ΔG, corresponds to the binding free energy between protein and ligand, and is able to compute over atomistic simulations. This metric is associated with the experimental data via formula ΔGbind = RT![[thin space (1/6-em)]](https://www.rsc.org/images/entities/char_2009.gif) ln(ki), where R is the gas constant, T is the absolute temperature, and ki is the inhibition constant. Normally, the experimental data IC50 is assumed to be equivalent to ki in order to characterize the experimental binding free energy ΔGEXP.23–25 Because the metric discloses the inhibitor efficiency,21 accurate and speedy determination of ΔG is very important in the discovery of potential inhibitors for a protein target.26–29 In this work, we have first benchmarked the performance of the free energy approaches including molecular docking and FPL calculations. The obtained results in the estimation the ΔG of marine fungi derivatives is thus more reliable. Compounds 23, 40, 46, 48, and 52 were suggested as highly possible inhibitors for preventing the biological activity of Hsp90. Our observations can enhance cancer treatment research.
ln(ki), where R is the gas constant, T is the absolute temperature, and ki is the inhibition constant. Normally, the experimental data IC50 is assumed to be equivalent to ki in order to characterize the experimental binding free energy ΔGEXP.23–25 Because the metric discloses the inhibitor efficiency,21 accurate and speedy determination of ΔG is very important in the discovery of potential inhibitors for a protein target.26–29 In this work, we have first benchmarked the performance of the free energy approaches including molecular docking and FPL calculations. The obtained results in the estimation the ΔG of marine fungi derivatives is thus more reliable. Compounds 23, 40, 46, 48, and 52 were suggested as highly possible inhibitors for preventing the biological activity of Hsp90. Our observations can enhance cancer treatment research.
Materials and methods
Structure of ligands and Hsp90
The three-dimensional structure of Hsp90 was downloaded from the Protein Data Bank (PDB) with the identity (ID) of 3K99.10 The resolution of Hsp90 is high at 1.79 Å. The available inhibitors for Hsp90 were also obtained from the PDB database with IDs: 2QF6,9 2QG0,9 2QG2,9 3K97,10 3K99,10 3 R4M,11 3R4N,11 3R4O,11 3RLR,12 4NH7,13 4NH8,13 4O05,14 4O07,14 4O09,14 and 4O0B.14 The 3D structures of 63 ligands (E1–E63) were obtained via experimental investigations on marine fungi samples (Aspergillus sp. and Penicillium sp.).Molecular docking simulations
The molecular docking simulations were employed to evaluate both binding affinity and position of ligands to Hsp90. Here we employed Autodock Vina (Vina) 1.1,30 Autodock4.2 (AD4),31 and GOLD packages32 to finish the task force. The parameters of the docking simulations via AD4 and Vina were referred to in previous studies.24,33 Whereas the GOLD parameters were selected as default options. The best docking structure is selected as the docking configuration forming the largest binding affinity.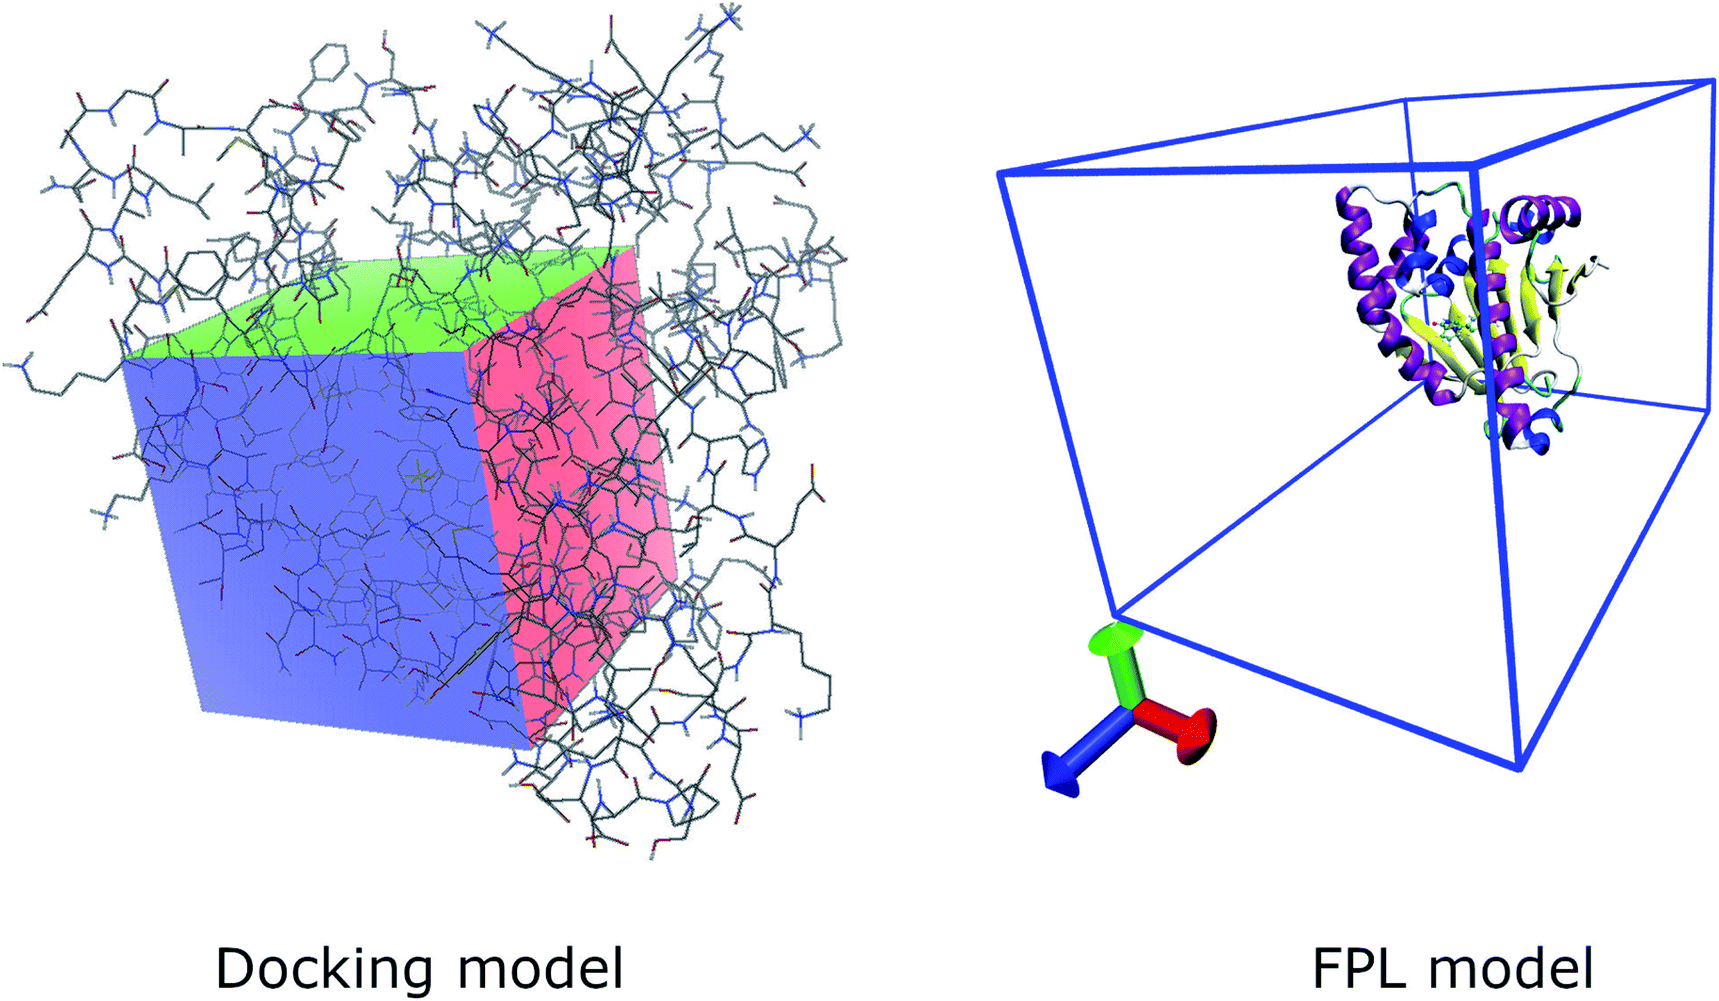 | ||
| Fig. 1 Computational modelling of molecular docking and FPL simulations. | ||
Fast pulling of ligand (FPL) simulations
GROMACS version 5.1.5 (ref. 37) was employed to mimic the unbinding process of a ligand, which was pulled via an external force out of the binding cavity of Hsp90. The Hsp90 and counteracted ions were presented using the Amber99SB-ILDN force field (FF).38 The TIP3P was engaged in treating water molecules.39 The general Amber force field (GAFF)40 was utilized to parameterize the ligand via AmberTools18 with the charged and geometric parameters obtained via QM calculations using the B3LYP functional and 6-31G(d,p) basis set.41 In particular, the atomic charge was evaluated using the restrained electrostatic potential (RESP) method.42 The ACPYPE43 protocol was then utilized to convert the ligand topology to GROMACS formats. The combined FF was selected since they are high coincidence for a free energy assessment.44,45The Hsp90 + ligand complex was initially inserted into a rectangular periodic boundary condition box with a size of 5.8 × 5.8 × 8.5 nm, which is large enough for unbound ligands out of the enzymic binding cavity (cf. Fig. 1). The soluble complex thus comprises of ca. 27500 atoms involving the Hsp90, ligands, water molecules, and ca. 7 Na+ ions. The steepest descent approach was initially utilized to minimize the energy of the system. Then, NVT and NPT imitations were followed to relax the system with a length of 0.1 ns for each simulation. It should be noted that the Cα atoms of Hsp90 were positionally restrained using a weak harmonic potential. Finally, the inhibitor was stressed to mobilize out of the HSP binding cavity by utilizing an external harmonic force with a pulling speed of k = 0.005 nm ps−1 and a spring constant of ν = 600 kJ mol−1 nm−2. The metrics k and ν were chosen as referred to in previous work.27 During FPL calculations, the displacement of the ligand and the value of pulling force, F, were recorded every 0.1 ps and were used to estimate the ligand-binding affinity.27 The FPL calculations were carried out 8 times for each system.
Analyzed tools
The ligand protonation state was predicted using the Chemicalize tools (http://www.chemicalize.com), a website application of ChemAxon. The binding position of the ligand to Hsp90 was analyzed using the free version of Maestro 2020.46Results and discussion
Molecular docking simulation
In CADD, the binding pose and binding affinity of ligands to enzymic targets are generally obtained via molecular docking simulations, a fast and low computing resources technique. In this work, we have tried Vina,30 an open-source docking protocol, widely used for this purpose to complete this task force. Unfortunately, Vina calculations adopted uncorrelated results in comparison with the respective experimental data with correlation coefficient Rvina = 0.40 (Table 1). AD4 was thus employed to perform the docking simulation since they have a different scoring function to Vina:.30,31 Vina uses a full empirical scoring function, while AD4 uses a semi-physical/empirical based scoring function.30,31 We thus expected that AD4 probably is suitable for completing the task force and the obtained docking result would be appropriate. Unfortunately, the obtained correlation coefficient is poor with a value of RGAAD4 = 0.33 (Table 1). It is consistent with previous work.33 Although we have changed search algorithms from GA to Lamarckian GA (LA) and Monte Carlo Simulated Annealing (SA), the poorly correlated results were observed with a value of RLAAD4 = 0.35 and RSAAD4 = 0.25 (Table 1).| No. | PDB ID | ΔGvina | ΔGGAAD4 | ΔGLAAD4 | ΔGSAAD4 | ΔGChemScoreGOLD | ChemPLP | ΔGEXPa |
|---|---|---|---|---|---|---|---|---|
| a The experimental binding free energy was obtained through the inhibition constant. The unit of energy and force are in kcal mol−1 and pN, respectively. | ||||||||
| 1 | 2QF6 | −10.2 | −8.8 | −8.8 | −8.8 | −8.8 | 74.7 | −8.91 |
| 2 | 2QG0 | −9.6 | −8.7 | −9.2 | −10.4 | −7.0 | 66.4 | −7.85 |
| 3 | 2QG2 | −10.2 | −9.9 | −9.4 | −10.0 | −7.9 | 75.2 | −7.41 |
| 4 | 3K97 | −8.3 | −7.7 | −7.9 | −8.1 | −7.3 | 68.3 | −10.98 |
| 5 | 3K99 | −9.2 | −8.2 | −8.2 | −8.2 | −7.9 | 61.4 | −9.91 |
| 6 | 3 R4M | −7.8 | −6.6 | −6.6 | −7.5 | −5.1 | 49.7 | −8.13 |
| 7 | 3R4N | −8.3 | −7.1 | −7.4 | −7.6 | −5.4 | 61.2 | −9.45 |
| 8 | 3R4O | −10.1 | −8.8 | −8.7 | −9.2 | −6.0 | 73.2 | −11.19 |
| 9 | 3RLR | −9.6 | −8.2 | −8.2 | −8.2 | −6.4 | 70.5 | −10.33 |
| 10 | 4NH7 | −11.3 | −10.0 | −9.9 | −10.6 | −11.8 | 98.9 | −11.53 |
| 11 | 4NH8 | −10.7 | −9.7 | −9.8 | −10.0 | −11.8 | 98.3 | −11.70 |
| 12 | 4O05 | −12.5 | −11.5 | −11.4 | −11.5 | −11.4 | 96.4 | −10.20 |
| 13 | 4O07 | −12.5 | −11.9 | −11.9 | −12.0 | −11.5 | 95.5 | −10.13 |
| 14 | 4O09 | −11.6 | −10.7 | −10.7 | −10.8 | −11.0 | 93.8 | −10.57 |
| 15 | 4O0B | −12.3 | −11.5 | −11.7 | −11.7 | −11.1 | 94.2 | −11.39 |
The GOLD docking package,32 a commercial docking program, was then utilized to evaluate the binding affinity and position of ligands to the Hsp90 enzyme. Fortunately, the docking energy provided by the GOLD docking package forms appropriate correlations with the respective experiment with a value of RChemScoreGOLD = 0.51 and RChemPLPGOLD = −0.60 (cf. Table 1 and Fig. 2). The ChemPLP scoring function is much better than ChemScore, and the ligand having a larger ChemPLP score will form a larger binding affinity to Hsp90. Therefore, the GOLD docking package with the ChemPLP scoring function was executed to predict the binding affinity of marine derivatives to Hsp90.
 | ||
| Fig. 2 Association between the ChemPLP score and the experimental binding free energy ΔGEXP. | ||
FPL simulations
Although the docking simulation adopted appropriate results compared with experimental data,47–49 the docking results are required to refine a more accurate approach.35,50,51 Because the molecular docking approach normally uses many constraints to enhance the computing speed. The popular constraints of molecular docking simulations are known as lacking receptor dynamics, limiting the number of trial position of ligands, using an implicit water model, etc. Normally, molecular dynamics and/or steered-molecular dynamics simulations are thus utilized to refine the docking outcomes.28,52,53 FPL simulations were employed to validate the docking results as they form corresponding results with the respective experimental results, and are a low cost computing resource.54Furthermore, it should be noted that FPL simulations are a very efficient free energy approach, which normally forms appropriate results compared to the respective experiments with low computing resources. FPL has thus been successfully applied to various targets before.27,35,54 In this context, we first benchmarked the performance of the FPL scheme over 15 Hsp90 systems. The obtained results are shown in Table 2 and Table S2† of the ESI file. In particular, the mean of pulling work (W) diffuses in the range 58.3 to 208.5 kcal mol−1, whereas the mean of rupture force (FMax) is in the range 580.7 to 1566.1 pN. The graph of W and FMax in the time revolution is described in the ESI file.† The computed metrics are in good agreement with the respective experimental data,9–14 because the Pearson correlation coefficient is of RW = −0.78 and RF = −0.81 (Table 2 and Fig. 3). Although the difference between RW and RF is quite small, the rupture force was selected to rank the ligand-binding affinity to Hsp90. Therefore, using linear regression, the predicted binding free energy ΔGPreFPL can be calculated via the rupture force as follows
 | (1) |
 | ||
| Fig. 3 Association between the average of the FMax and the experimental binding free energy ΔGEXP. | ||
| No. | Name | FMaxa | Wb | ΔGEXPc |
|---|---|---|---|---|
| a The obtained value of the mean rupture force FMax.b The recorded metric of the pulling work W.c The experimental binding free energy ΔGEXP was estimated via the reported ki. The calculated error was the standard error of the average. The unit of force and energy is in pN and kcal mol−1, respectively. | ||||
| 1 | 2QF6 | 580.7 ± 90.9 | 67.7 ± 12.3 | −8.91 |
| 2 | 2QG0 | 764.3 ± 119.3 | 76.5 ± 12.9 | −7.85 |
| 3 | 2QG2 | 676.2 ± 78.5 | 71.1 ± 8.7 | −7.41 |
| 4 | 3K97 | 1065.5 ± 66.3 | 113.9 ± 10 | −10.98 |
| 5 | 3K99 | 831.4 ± 52.5 | 82.7 ± 4.5 | −9.91 |
| 6 | 3 R4M | 605.7 ± 81.7 | 58.3 ± 9.4 | −8.13 |
| 7 | 3R4N | 651.0 ± 37.6 | 69.8 ± 4.4 | −9.45 |
| 8 | 3R4O | 1140.8 ± 128.1 | 126.3 ± 17.2 | −11.19 |
| 9 | 3RLR | 910.8 ± 88.1 | 98.8 ± 8.6 | −10.33 |
| 10 | 4NH7 | 1357.1 ± 146.7 | 167.6 ± 28 | −11.53 |
| 11 | 4NH8 | 1566.1 ± 124.2 | 208.5 ± 26.1 | −11.70 |
| 12 | 4O05 | 1313.2 ± 88.2 | 164.4 ± 20.3 | −10.20 |
| 13 | 4O07 | 1363.3 ± 131.0 | 175.7 ± 25.9 | −10.13 |
| 14 | 4O09 | 1348.6 ± 102.6 | 163.9 ± 18.6 | −10.57 |
| 15 | 4O0B | 1318.9 ± 112.6 | 157.5 ± 20.8 | −11.39 |
The metric ΔGPreFPL was investigated by the RMSE with linear regression, forming RMSEF = 0.77 kcal mol−1, which implies that FPL calculations can categorize ligands having similar binding affinity to Hsp90. Overall, FPL simulations are an efficient approach to predict the ligand-binding free energy of Hsp90.
Marine fungi derivatives inhibit Hsp90
As mentioned above, marine fungi derivatives are vital compounds that are promising candidates for preventing the biological activity of Hsp90. The GOLD docking package using the ChemPLP scoring function was utilized to estimate the binding affinity and binding pose of marine fungi derivatives preliminarily calculated using this application. It should be noted that trial compounds were extracted from marine fungi using experiments. The obtained results are reported in Table 3 and S1† in the ESI file. In particular, the ChemPLP scores of these compounds vary in the range from 31.99 to 77.8. The compounds having ChemPLP scores larger than 70.0 are proposed as potential inhibitors for preventing Hsp90 (cf. Table 3).| No. | Name | ChemPLP | FMaxa | Wb | ΔGPreFPL c | kPrei |
|---|---|---|---|---|---|---|
| a The obtained value of the mean rupture force FMax.b The recorded metric of the pulling work W.c The predicted binding free energy ΔGPreFPL was estimated using formula (1). The calculated error was the standard error of the average. The unit of force, energy, and inhibition constant are pN, kcal mol−1 and μM, respectively. | ||||||
| 1 | 48 | 86.3 | 627 ± 127.1 | 70.6 ± 9.2 | −8.62 | 0.29 |
| 2 | 25 | 77.8 | 555.3 ± 60.5 | 61.7 ± 8.2 | −8.38 | 1.25 |
| 3 | 40 | 76.9 | 711.7 ± 77.9 | 75.7 ± 13 | −8.90 | 0.54 |
| 4 | 23 | 72.6 | 827.6 ± 195 | 95.9 ± 22.3 | −9.29 | 0.67 |
| 5 | 46 | 71.7 | 669.9 ± 97.2 | 78.1 ± 9.8 | −8.76 | 0.85 |
| 6 | 52 | 70.6 | 753.3 ± 110 | 77.5 ± 10.5 | −9.04 | 0.43 |
The binding positions of the six best compounds docking to the Hsp90 enzyme were analyzed using the PyMOL package.55 Interestingly, only ligand 23 forms a hydrogen bond to Hsp90, whereas the other compounds just adopt hydrophobic contacts. This observation implies that the hydrophobic interaction dominates over electrostatic interactions in the binding process of ligands to Hsp90. This is consistent with the correlation between experimental binding free energy with the metric ClogP, R = −0.64, which means that more hydrophobic inhibitors form stronger binding ligands (Fig. 4).
 | ||
| Fig. 4 The 6 binding positions of the marine fungi compounds docking the best to Hsp90, which were estimated using the GOLD docking program with ChemPLP scoring function. | ||
FPL calculations were then applied to refine the docking results of 63 marine fungi derivatives to Hsp90. The obtained results are shown in Table 3 and S3† of the ESI file. The average of FMax falls in the range 555.3 to 827.6 pN, whereas the mean W falls in the range 57 to 94 kcal mol−1. Using linear regression via formula (1), the predicted binding free energy of 6 marine compounds was obtained as listed in Table 3. The predicted metrics ΔGPreFPL, are in the range −8.38 to −9.29 kcal mol−1, which is equivalent to the predicted inhibition constant kPrei ranging from 0.29 to 1.25 μM. Interestingly, five ligands adopt a sub-micromolar inhibition constant implying that they probably are promising inhibitors for blocking the biological activity of Hsp90. In addition, it should be noted that the docking conformation differs from the native-binding conformation, resulting in a decrease of FPL accuracy.56 The MD simulations with a length of 20 ns for each trajectory, were carried out to let ligands to reach a stable-binding conformation. The complex reached equilibrium states after 5 ns of MD simulations (cf. Table S4† of the ESI). The last snapshot of MD simulations was then used as the initial conformation for FPL calculations. The obtained results were reported in Table S5 and S6† of the ESI file. Interestingly, the FPL results reported in Table 3 and S5† are in good agreement with each other. Additional evaluation using in vitro and/or in vivo studies should be executed to validate the obtained results.
CPU time consumption
Each Hsp90 + inhibitor system was mimicked over 8 independent FPL calculations as well as the performed calculations of the different targets.35,51 In particular, different FPL calculations have the same starting structure and one FPL simulation involves 0.1 ns of NVT, 0.1 ns of NPT, and 0.5 ns of SMD simulations. 5.6 ns of MD simulations were thus carried out to predict the binding free energy of a ligand to the Hsp90 target. It should be noted that a Dual Xeon E5-2683 V3 server is able to perform ca. 90 ns of MD simulation each day for the Hsp90 + inhibitor complex. Therefore, the FPL approach can be used to estimate the binding free energy of a ligand to Hsp90 within 1.5 hours. It is quite a low computing resource requirement, allowing us to be able to accurately and rapidly evaluate the binding free energy of several ligands to Hsp90.Conclusions
We have established that an amalgamation of GOLD docking and FPL simulations can accurately and rapidly calculate the binding free energy of a ligand to Hsp90. The ChemPLP scoring function is better than ChemScore one in docking a molecule to Hsp90, since RChemScoreGOLD = 0.51 is significantly smaller than RChemPLPGOLD = −0.60. Besides that, we also tried AD4 and Vina docking to complete the task force, but a poor correlation to the respective experiments was observed. Moreover, FPL calculations are an efficient protocol to refine the docking result as they form a good correlation coefficient RF = −0.81 and RMSEF = 0.77 kcal mol−1 with a low computing resource requirement. Furthermore, based on the efficiency of the approaches, a shortlist comprising 5 compounds from marine fungi derivatives, including 23, 40, 46, 48, and 52 were indicated as promising inhibitors for preventing the biological activity of Hsp90 because they adopt a sub-micromolar inhibition constant. Further evaluation using in vitro and/or in vivo studies should be executed to validate the obtained results.Conflicts of interest
The authors declare no potential conflicts of interest with respect to the research, authorship, and/or publication of this article.Acknowledgements
This research was funded by the Vietnam Ministry of Science and Technology (grant number: HNQT/SPĐP/11.19) and College of Pharmacy, Chungnam National University, Republic of Korea under the Vietnam bilateral-multilateral international joint research program in Science and Technology to 2020.References
- C. Jolly and R. I. Morimoto, J. Natl. Cancer Inst., 2000, 92, 1564–1572 CrossRef CAS PubMed.
- F. Vallée, C. Carrez, F. Pilorge, A. Dupuy, A. Parent, L. Bertin, F. Thompson, P. Ferrari, F. Fassy, A. Lamberton, A. Thomas, R. Arrebola, S. Guerif, A. Rohaut, V. Certal, J.-M. Ruxer, C. Delorme, A. Jouanen, J. Dumas, C. Grépin, C. Combeau, H. Goulaouic, N. Dereu, V. Mikol, P. Mailliet and H. Minoux, J. Med. Chem., 2011, 54, 7206–7219 CrossRef PubMed.
- A. J. L. Macario and E. C. de Macario, N. Engl. J. Med., 2005, 353, 1489–1501 CrossRef CAS PubMed.
- D. Hanahan and R. A. Weinberg, Cell, 2000, 100, 57–70 CrossRef CAS PubMed.
- D. Mahalingam, R. Swords, J. S. Carew, S. T. Nawrocki, K. Bhalla and F. J. Giles, Br. J. Cancer, 2009, 100, 1523–1529 CrossRef CAS PubMed.
- X. Y. Huang, Z. J. Shan, H. L. Zhai, L. N. Li and X. Y. Zhang, J. Chem. Inf. Model., 2011, 51, 1999–2006 CrossRef CAS PubMed.
- M. K. Haider, H.-O. Bertrand and R. E. Hubbard, J. Chem. Inf. Model., 2011, 51, 1092–1105 CrossRef CAS PubMed.
- S. Wolf, M. Amaral, M. Lowinski, F. Vallee, D. Musil, J. Guldenhaupt, M. K. Dreyer, J. Bomke, M. Frech, J. Schlitter and K. Geiwert, J. Chem. Inf. Model., 2019, 59, 5135–5147 CrossRef CAS PubMed.
- J. R. Huth, C. Park, A. M. Petros, A. R. Kunzer, M. D. Wendt, X. Wang, C. L. Lynch, J. C. Mack, K. M. Swift, R. A. Judge, J. Chen, P. L. Richardson, S. Jin, S. K. Tahir, E. D. Matayoshi, S. A. Dorwin, U. S. Ladror, J. M. Severin, K. A. Walter, D. M. Bartley, S. W. Fesik, S. W. Elmore and P. J. Hajduk, Chem. Biol. Drug Des., 2007, 70, 1–12 CrossRef CAS PubMed.
- P.-P. Kung, B. Huang, G. Zhang, J. Z. Zhou, J. Wang, J. A. Digits, J. Skaptason, S. Yamazaki, D. Neul, M. Zientek, J. Elleraas, P. Mehta, M.-J. Yin, M. J. Hickey, K. S. Gajiwala, C. Rodgers, J. F. Davies and M. R. Gehring, J. Med. Chem., 2010, 53, 499–503 CrossRef CAS PubMed.
- L. Zehnder, M. Bennett, J. Meng, B. Huang, S. Ninkovic, F. Wang, J. Braganza, J. Tatlock, T. Jewell, J. Z. Zhou, B. Burke, J. Wang, K. Maegley, P. P. Mehta, M.-J. Yin, K. S. Gajiwala, M. J. Hickey, S. Yamazaki, E. Smith, P. Kang, A. Sistla, E. Dovalsantos, M. R. Gehring, R. Kania, M. Wythes and P.-P. Kung, J. Med. Chem., 2011, 54, 3368–3385 CrossRef CAS PubMed.
- P.-P. Kung, P.-J. Sinnema, P. Richardson, M. J. Hickey, K. S. Gajiwala, F. Wang, B. Huang, G. McClellan, J. Wang, K. Maegley, S. Bergqvist, P. P. Mehta and R. Kania, Bioorg. Med. Chem. Lett., 2011, 21, 3557–3562 CrossRef CAS PubMed.
- J. T. Ernst, M. Liu, H. Zuccola, T. Neubert, K. Beaumont, A. Turnbull, A. Kallel, B. Vought and D. Stamos, Bioorg. Med. Chem. Lett., 2014, 24, 204–208 CrossRef CAS PubMed.
- J. T. Ernst, T. Neubert, M. Liu, S. Sperry, H. Zuccola, A. Turnbull, B. Fleck, W. Kargo, L. Woody, P. Chiang, D. Tran, W. Chen, P. Snyder, T. Alcacio, A. Nezami, J. Reynolds, K. Alvi, L. Goulet and D. Stamos, J. Med. Chem., 2014, 57, 3382–3400 CrossRef CAS PubMed.
- D. J. Newman and G. M. Cragg, J. Nat. Prod., 2016, 79, 629–661 CrossRef CAS PubMed.
- B. Haefner, Drug discovery today, 2003, 8, 536–544 CrossRef CAS PubMed.
- D. J. Faulkner, Antonie van Leeuwenhoek, 2000, 77, 135–145 CrossRef CAS PubMed.
- C. Alves, J. Silva, S. Pinteus, H. Gaspar, M. C. Alpoim, L. M. Botana and R. Pedrosa, Front. Pharmacol., 2018, 9, 777 CrossRef PubMed.
- T. F. Molinski, D. S. Dalisay, S. L. Lievens and J. P. Saludes, Nat. Rev. Drug Discovery, 2008, 8, 69–85 CrossRef PubMed.
- M. S. Butler, A. A. B. Robertson and M. A. Cooper, Nat. Prod. Rep., 2014, 31, 1612–1661 RSC.
- G. R. Marshall, Annu. Rev. Pharmacol. Toxicol., 1987, 27, 193–213 CrossRef CAS PubMed.
- N. Homeyer, F. Stoll, A. Hillisch and H. Gohlke, J. Chem. Theory Comput., 2014, 10, 3331–3344 CrossRef CAS PubMed.
- N. T. Mai, N. T. Lan, T. Y. Vu, P. T. Mai Duong, N. T. Tung and H. T. Thu Phung, J. Mol. Graph. Model., 2020, 100, 107648 CrossRef CAS PubMed.
- S. T. Ngo, N. Quynh Anh Pham, L. Thi Le, D.-H. Pham and V. V. Vu, J. Chem. Inf. Model., 2020, 60, 5771–5780 CrossRef CAS PubMed.
- P.-T. Tran, V.-H. Hoang, J. Lee, T. T. T. Hien, N. T. Tung and S. T. Ngo, RSC Adv., 2019, 9, 29619–29627 RSC.
- W. Yu and A. D. MacKerell, in Antibiotics: Methods and Protocols, ed. P. Sass, Springer New York, New York, NY, 2017, pp. 85–106, DOI:10.1007/978-1-4939-6634-9_5.
- S. T. Ngo, H. M. Hung and M. T. Nguyen, J. Comput. Chem., 2016, 37, 2734–2742 CrossRef CAS PubMed.
- S. T. Ngo, T. H. Nguyen, N. T. Tung, P. C. Nam, K. B. Vu and V. V. Vu, J. Comput. Chem., 2020, 41, 611–618 CrossRef CAS PubMed.
- S. T. Ngo, J. Comput. Chem., 2021, 42, 117–123 CrossRef CAS PubMed.
- O. Trott and A. J. Olson, J. Comput. Chem., 2010, 31, 455–461 CAS.
- G. M. Morris, R. Huey, W. Lindstrom, M. F. Sanner, R. K. Belew, D. S. Goodsell and A. J. Olson, J. Comput. Chem., 2009, 30, 2785–2791 CrossRef CAS PubMed.
- G. Jones, P. Willett, R. C. Glen, A. R. Leach and R. Taylor, J. Mol. Biol., 1997, 267, 727–748 CrossRef CAS PubMed.
- N. T. Nguyen, T. H. Nguyen, T. N. H. Pham, N. T. Huy, M. V. Bay, M. Q. Pham, P. C. Nam, V. V. Vu and S. T. Ngo, J. Chem. Inf. Model., 2020, 60, 204–211 CrossRef CAS PubMed.
- S. T. Ngo, N. Hung Minh, H. Le Thi Thuy, Q. Pham Minh, T. Vi Khanh, T. Nguyen Thanh and V. Van, RSC Adv., 2020, 10, 40284–40290 RSC.
- M. Q. Pham, K. B. Vu, T. N. Han Pham, L. T. Thuy Huong, L. H. Tran, N. T. Tung, V. V. Vu, T. H. Nguyen and S. T. Ngo, RSC Adv., 2020, 10, 31991–31996 RSC.
- A. Nurisso, J. Bravo, P.-A. Carrupt and A. Daina, J. Chem. Inf. Model., 2012, 52, 1319–1327 CrossRef CAS PubMed.
- M. J. Abraham, T. Murtola, R. Schulz, S. Páll, J. C. Smith, B. Hess and E. Lindahl, SoftwareX, 2015, 1–2, 19–25 CrossRef.
- A. E. Aliev, M. Kulke, H. S. Khaneja, V. Chudasama, T. D. Sheppard and R. M. Lanigan, Proteins: Struct., Funct., Bioinf., 2014, 82, 195–215 CrossRef CAS PubMed.
- W. L. Jorgensen, J. Chandrasekhar, J. D. Madura, R. W. Impey and M. L. Klein, J. Chem. Phys., 1983, 79, 926–935 CrossRef CAS.
- J. Wang, W. Wang, P. A. Kollman and D. A. Case, J. Mol. Graph. Model., 2006, 25, 247–260 CrossRef CAS PubMed.
- D. A. Case, I. Y. Ben-Shalom, S. R. Brozell, D. S. Cerutti, T. E. C. Cheatham III, V. W. D., T. A. Darden, R. E. Duke, D. Ghoreishi, M. K. Gilson, H. Gohlke, A. W. Goetz, D. Greene, R. Harris, N. Homeyer, Y. Huang, S. Izadi, A. Kovalenko, T. Kurtzman, T. S. Lee, S. LeGrand, P. Li, C. Lin, J. Liu, T. Luchko, R. Luo, D. J. Mermelstein, K. M. Merz, Y. Miao, G. Monard, C. Nguyen, H. Nguyen, I. Omelyan, A. Onufriev, F. Pan, R. Qi, D. R. Roe, A. Roitberg, C. Sagui, S. Schott-Verdugo, J. Shen, C. L. Simmerling, J. Smith, R. SalomonFerrer, J. Swails, R. C. Walker, J. Wang, H. Wei, R. M. Wolf, X. Wu, L. Xiao, D. M. York and P. A. Kollman, Amber 2018 Reference Manual, University of California, San Francisco, 2018 Search PubMed.
- J. Wang, R. M. Wolf, J. W. Caldwell, P. A. Kollman and D. A. Case, J. Comput. Chem., 2004, 25, 1157–1174 CrossRef CAS PubMed.
- A. W. Sousa da Silva and W. F. Vranken, BMC Res. Notes, 2012, 5, 1–8 CrossRef PubMed.
- H. Zhang, C. Yin, Y. Jiang and D. van der Spoel, J. Chem. Inf. Model., 2018, 58, 1037–1052 CrossRef CAS PubMed.
- H. Zhang, Y. Jiang, Z. Cui and C. Yin, J. Chem. Inf. Model., 2018, 58, 1669–1681 CrossRef CAS PubMed.
- P. Schrödinger LLC, Schrödinger Release 2020-4: Maestro, 2020 Search PubMed.
- L. Zhang, D. Lin, X. Sun, U. Curth, C. Drosten, L. Sauerhering, S. Becker, K. Rox and R. Hilgenfeld, Science, 2020, 368, 409–412 CrossRef CAS PubMed.
- Z. Jin, Y. Zhao, Y. Sun, B. Zhang, H. Wang, Y. Wu, Y. Zhu, C. Zhu, T. Hu, X. Du, Y. Duan, J. Yu, X. Yang, X. Yang, K. Yang, X. Liu, L. W. Guddat, G. Xiao, L. Zhang, H. Yang and Z. Rao, Nat. Struct. Mol. Biol., 2020, 27, 529–532 CrossRef CAS PubMed.
- W. Dai, B. Zhang, H. Su, J. Li, Y. Zhao, X. Xie, Z. Jin, F. Liu, C. Li, Y. Li, F. Bai, H. Wang, X. Cheng, X. Cen, S. Hu, X. Yang, J. Wang, X. Liu, G. Xiao, H. Jiang, Z. Rao, L.-K. Zhang, Y. Xu, H. Yang and H. Liu, Science, 2020, 368, 1331–1335 CrossRef CAS PubMed.
- N. T. Dan, H. D. Quang, V. Van Truong, D. Huu Nghi, N. M. Cuong, T. D. Cuong, T. Q. Toan, L. G. Bach, N. H. T. Anh, N. T. Mai, N. T. Lan, L. Van Chinh and P. M. Quan, Sci. Rep., 2020, 10, 11429 CrossRef CAS PubMed.
- N. M. Tam, P. C. Nam, D. T. Quang, N. T. Tung, V. V. Vu and S. T. Ngo, RSC Adv., 2021, 11, 2926–2934 RSC.
- S. T. Ngo, B. K. Mai, P. Derreumaux and V. V. Vu, RSC Adv., 2019, 9, 12455–12461 RSC.
- S. T. Ngo, K. B. Vu, L. M. Bui and V. V. Vu, ACS Omega, 2019, 4, 3887–3893 CrossRef CAS PubMed.
- N. M. Tam, M. T. Nguyen and S. T. Ngo, J. Mol. Graph. Model., 2017, 77, 137–142 CrossRef CAS PubMed.
- P. Schrödinger LLC, The PyMOL Molecular Graphics System, Version 1.3r1, 2010 Search PubMed.
- S. T. Ngo, N. M. Tam, M. Q. Pham and T. H. Nguyen, J. Chem. Inf. Model., 2021, 61(5), 2302–2312 CrossRef CAS PubMed.
Footnote |
| † Electronic supplementary information (ESI) available: Includes the results of docking and FPL simulations, and the pulling forces over 8 independent trajectories. See DOI: 10.1039/d1ra01855h |
| This journal is © The Royal Society of Chemistry 2021 |