 Open Access Article
Size-controlled synthesis of porous ZnSnO3 nanocubes for improving formaldehyde gas sensitivity
Jiaoling
Zheng†
a,
Huanhuan
Hou†
ab,
Hao
Fu
cd,
Liping
Gao
 *a and
Hongjie
Liu
*c
aSchool of Materials and Chemical Engineering, Chuzhou University, Chuzhou, 239000, China. E-mail: gaozhangping@163.com
bSchool of Chemistry and Chemical Engineering, Anhui University of Technology, Ma’anshan, 243000, China
cDepartment of Science and Technology, Shiyuan College of Nanning Normal University, Nanning, 530226, China. E-mail: hongjieliu2008@163.com
dSchool of Chemistry & Chemical Engineering, Guangxi University, Nanning, 530004, China
First published on 7th June 2021
Abstract
During the detection of formaldehyde, sensitivity and selectivity is still a challenging issue for most reported gas sensors. Herein, an alternative formaldehyde chemosensor that is based on porous ZnSnO3 nanocubes was synthesized. The products are characterized by XRD, SEM, TEM (HRTEM), XPS, PL measurements and N2 adsorption–desorption. The size of the ZnSnO3 nanocubes is about 100 nm and the corresponding specific surface area is 70.001 m2 g−1. A gas sensor based on these porous ZnSnO3 nanocubes shows high sensitivity and selectivity to formaldehyde. The porous ZnSnO3 nanocube sensor could detect 50 ppm formaldehyde at about 210 °C with a response value of 21.2, which is twice as much as ethanol, and 3 times that of the other five gases. Moreover, the response of the sensor had an acceptable change after a pulse test for 90 days. The sensor can detect formaldehyde with a minimum concentration of 1 ppm, and it has a good linear relationship between 1–50 ppm formaldehyde. The gas sensor based on porous ZnSnO3 nanocubes can be utilized as a promising candidate for a practical detector of formaldehyde due to its high gas response and excellent selectivity.
1. Introduction
VOC pollutants, such as ethanol, ammonia, acetone, formaldehyde and benzene etc., have attracted extensive attention due to their toxicity to humans and atmospheric pollution.1,2 The most concerning among VOCs is formaldehyde due to its carcinogenicity, according to the World Health Organization (WHO), and it is the main pollutant resulting from home decoration.3 The Standardization Administration of the People’s Republic of China has regulated the indoor permissible release with a limit of 0.1 ppm,4 and the American Conference of Governmental Industrial Hygienists (ACGIH) has recommended a threshold limit value of 0.1 ppm for formaldehyde.5 Long term exposure to formaldehyde can cause serious damage to human sensory organs, and can even lead to cancer.4 Therefore, real-time and effective formaldehyde monitoring methods are needed to prevent it from exceeding the threshold for danger and thereby affecting human health and causing environmental pollution. There are many common formaldehyde detection methods, including spectroscopy,6 fluorescence,7 polarography,8 chromatography,9 semiconductor gas sensors10 etc. Among these tested methods, semiconductor gas sensors have attracted great attention due to their convenient portability, low power consumption, high sensitivity and good selectivity.Sensitive materials are the core components of semiconductor gas sensors. Traditional semiconductor sensing materials include ZnO,11 SnO2,12 In2O3,13 WO3,14 etc. However, a single component usually cannot fulfill all of the requirements such as high response and selectivity, low operation temperature and good stability.15 Therefore, more and more researchers have committed to developing multi-component materials. As a famous multifunctional material, zinc stannate (ZnSnO3) has attracted considerable attention due to its potential applications in the fields of photocatalysis,16 gas sensing,17–20 Li-ion batteries,21etc. In recent years, the gas-sensing properties of ZnSnO3 with different morphologies have been studied, such as cubic ZnSnO3,22,23ZnSnO3 nanospheres,24,25 ZnSnO3 nanorods,26 etc. Among these structural materials, porous materials have attracted great attention due to the improvement of the gas sensitivity of the materials. The inherent reason is that porous structures have large specific surface areas and more reaction sites,27,28 which are beneficial for gas diffusion and mass transport,29,30 promoting oxygen adsorption, and thereby enhancing the gas response of the materials. For example, the porous NiO nanotetrahedra prepared by Fu et al. showed excellent gas-sensing performance toward formaldehyde.31 A hierarchical porous LaFeO3 material was prepared via a low-cost and simple method, which could detect 50 ppb formaldehyde.32 3D ordered porous SnO2 with a controllable pore diameter was used with enhanced formaldehyde sensing performance.33 Therefore, it is a feasible and good approach to synthesize a porous ZnSnO3 material to detect formaldehyde gas.
In this work, porous ZnSnO3 nanocubes were synthesized by a facile, template-free hydrothermal method combined with subsequent calcination. The size of the porous ZnSnO3 nanocubes is 100 nm and the material has a large specific surface area of 70.001 m2 g−1. The as-prepared porous ZnSnO3 nanocube sensor shows excellent gas-sensing properties toward formaldehyde gas. The sensor exhibits a high response (21.2) to 50 ppm of formaldehyde at 210 °C and good selectivity, making it a promising candidate for a practical detector of formaldehyde gas.
2. Experimental section
All of the reagents (analytical-grade purity) were purchased from the Shanghai Chemical Reagent Co. Ltd. (Shanghai, China) and were used without further purification. Deionized water was used throughout the experiments.2.1. Material synthesis
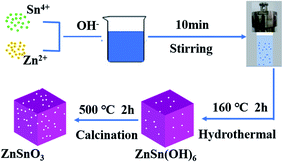
A typical synthesis procedure of the porous ZnSnO3 cubes was as follows: 1.0518 g of tin tetrachloride pentahydrate (SnCl4·5H2O) and 0.6659 g of zinc acetate (Zn(AC)2·2H2O) were dissolved in 20 mL of deionized water under vigorous stirring at room temperature, followed by the addition of 3 M NaOH aqueous solution. Then, the solution was transferred into a Teflon-lined stainless-steel autoclave with a capacity of 80 mL and maintained at 160 °C for 2 h. After cooling down to room temperature, the white precipitate was filtered, washed with distilled water and alcohol 4 times to remove the ions possibly remaining in the final product, and then dried in air at 60 °C for 12 h. Finally, the as-obtained precipitate was calcined at 500 °C with heating rate of 2 °C min−1 in a muffle furnace for 2 h. The synthesis process of the nanocubes is shown in Fig. 1.2.2. Material characterization
Powder X-ray diffraction measurements were performed with a Bruker D8 ADVANCE X-ray diffractometer in a scanning range of 10–70° (2θ) at a rate of 0.03° (2θ) per s with Cu Kα radiation. Field-emission scanning electron microscopy (FESEM) (Hitachi SU5000, Japan) and transmission electron microscopy (TEM) (FEI Tecnai G2 f20 twin, 200 kV) were used to characterize the morphologies of the materials. The decomposition process of the precursors was investigated using a SDT-Q600 thermal analyzer with a heating rate of 10 °C min−1 under N2 atmosphere. The nitrogen (N2) adsorption–desorption study was conducted using a Gemini V2380. Brunauer–Emmett–Teller (BET) measurements were used to determine the specific surface area and pore volume. Room temperature PL measurements were performed on a steady state and transient state fluorescence spectrometer (HORIBA TCSPC FluoroLog-3, USA). Elemental and solid surface analyses of the material were performed using X-ray photoelectron spectroscopy (XPS) (Thermo Scientific ESCALAB 250Xi, Al Kα X-ray monochromator).2.3. Gas response test
The experimental equipment used for the various VOC gas tests in the manuscript is consistent with that of our previous report.34 First of all, the sample and adhesive were fully ground in an agate mortar to form a gas sensing paste. The paste was then coated on the alumina ceramic tube, on which was loaded two Au electrodes and four Pt wires. After drying for 15 min under IR radiation, the alumina ceramic tube was sintered at 500 °C for 2 h, and then welded to the pedestal. Finally, the sensor was aged at 250 °C for 7 days to increase its stability. The gas sensing properties were measured using a WS-30A system (Wei Sheng Instruments Co., Zhengzhou, China) under laboratory conditions. The relative humidity of the test was about 50%. The circuit voltage (Vc) was set at 5 V, and the output voltage (Vout) was set as the terminal voltage of the load resistor (RL). The gas response of the sensor in this paper was defined as S = Ra/Rg (reducing gases) or S = Rg/Ra (oxidizing gases). The response or recovery time was expressed as the time taken for the sensor output to reach 90% of its saturation after applying or switching off the gas in a step function.3. Results and discussion
3.1. Material characterization
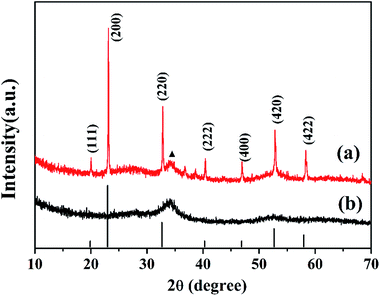
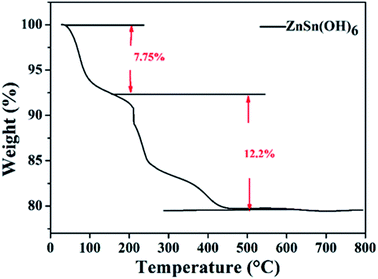
Fig. 2 shows the XRD patterns of the ZnSn(OH)6 precursor (Fig. 2a) and porous ZnSnO3 nanocubes calcined at 500 °C (Fig. 2b). From Fig. 2a, the peaks in the XRD pattern can be indexed to the cubic phase of ZnSn(OH)6 (JCPDS no. 74-1825),which is consistent with the literature reports.35 The strong intensity of the crystallization peaks indicates the good crystallinity of the material. As shown in Fig. 2b, only one broad peak can be observed, which is related to amorphous ZnSnO3. Through careful observation of the ZnSn(OH)6 precursor (Fig. 2a), an impurity peak can be seen near the (220) crystal plane, which may due to the decomposition of the precursor under hydrothermal conditions (high temperature and high pressure), which will be further confirmed by TG analysis.TG analysis was carried out to examine the conversion process of the precursors during calcination. Fig. 3 shows the TG analysis of the precursor. The weight loss of 7.75% from 40 to 160 °C is attributed to the removal of the existing adsorbed water in the precursor. It can be seen from the TG curve that there is a weight loss of 12.2% at high temperatures (160–500 °C), which is attributed to the removal of hydroxyl to generate zinc stannate and water. When the temperature reaches 500 °C, the thermogravimetric curve levels off, showing that the zinc stannate product has been completely achieved. The rate of weight loss is 12.2%, which is less than theoretical value (18.88%). The reason is that part of the ZnSn(OH) 6 has decomposed into ZnSnO3 under the hydrothermal process, which is consistent with the XRD analysis.
The morphology and micro-structure are observed using scanning electronic microscopy (SEM) and transmission electron microscopy (TEM), respectively. From Fig. 4a, it can be seen that the products are uniform nanocubes. Meanwhile, the corresponding element mapping images of ZnSnO3 are shown in Fig. 4b, demonstrating that the Zn, Sn and O elements are well distributed homogenously throughout the whole area. The TEM image (Fig. 4c) shows that the products have porous structures, which are assembled from tiny nanocrystals. Thermal decomposition of the precursor in air at a high temperature yields porous ZnSnO3 cubes, which is due to the alkaline (NaOH) etching and the release of H2O.36 It can be seen from Fig. 4d that the diffraction ring is a dispersion ring, which proves that the material is an amorphous structure, corresponding with the XRD analysis. Due to the ultrafine size and disordered distribution of the ZnSnO3 nanocrystals, from a macro perspective, the assembled ZnSnO3 cores behave similarly to an amorphous material and are therefore considered amorphous structures, which are more effective than large crystals in overcoming electrochemical and mechanical degradation.37–39
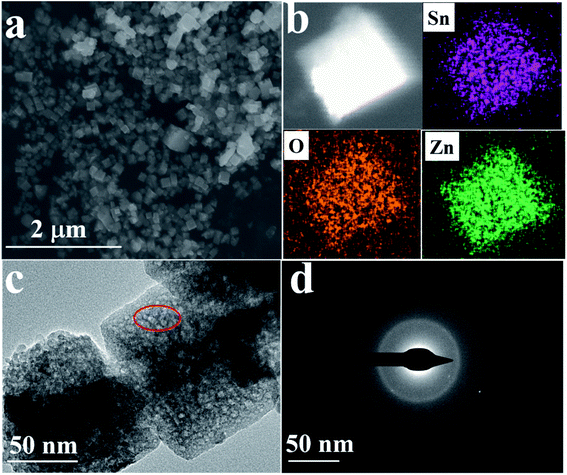 | ||
| Fig. 4 (a) SEM images and (b) SEM-EDS mapping of the porous ZnSnO3 nanocubes; (c) TEM and (d) SAED images of the porous ZnSnO3 nanocubes. | ||
Surface sensitive X-ray photoelectron spectroscopy (XPS) was conducted to elucidate the chemical composition of the porous ZnSnO3 nanocubes and the chemical states of Sn, Zn and O in ZnSnO3. The binding energies obtained from the XPS spectra were calibrated with reference to the signal from C 1s at 284.8 eV. Fig. 5a shows the survey XPS spectrum of the porous ZnSnO3 nanocubes. This clearly reveals that the obtained product contains Zn, Sn and O elements, as well as C contamination. The two peaks (Fig. 5b) at 1022.03 eV and 1044.83 eV are attributed to Zn 2p3/2 and Zn 2p1/2 for the Zn2+ state, respectively. As shown in Fig. 5c, the peaks located at 486.58 eV and 495.03 eV correspond to Sn 3d5/2 and Sn 3d3/2 for the Sn4+ state, respectively. The peak centered at ∼530.1 eV belongs to O 1s. From the XPS-peak-differentiating analysis, we could clearly see that there are two separate peaks; one peak at 530.34 eV is determined to be from the lattice oxygen (OL), while the other one located at ∼531.45 eV is attributed to the oxygen vacancies (Ov) (Fig. 5d).
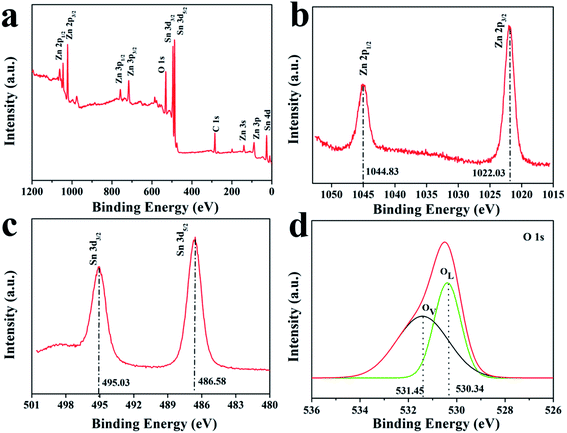 | ||
| Fig. 5 XPS spectra of the ZnSnO3 hollow microspheres: (a) survey spectrum, (b) Zn region, (c) Sn region and (d) O region. | ||
The ZnSnO3 nanocubes exhibit a porous structure and it is therefore interesting to study the surface area and the pore size of these nanocubes. Fig. 6a shows a typical N2 adsorption and desorption isotherm for the porous ZnSnO3 nanocubes. The N2 sorption isotherm of the porous ZnSnO3 nanocubes can be categorized as type IV based on IUPAC classification. The BET surface area of the product was calculated to be 70.001 m2 g−1. The corresponding BJH pore size distribution plot (Fig. 6b) of the porous ZnSnO3 nanocubes shows that the average pore size of this sample is around 3.4 nm, which corresponds with the TEM in Fig. 4c. The results show that the ZnSnO3 nanocubes have a large specific surface area and abundant interface/microporous structures. A porous structure is conducive to the rapid diffusion of the gas, thereby, improving the gas-sensing properties of porous materials.34
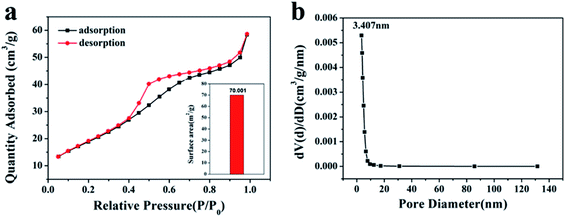 | ||
| Fig. 6 N2 adsorption–desorption curves (a) and corresponding pore size distribution curve (b) of the porous ZnSnO3 nanocubes. | ||
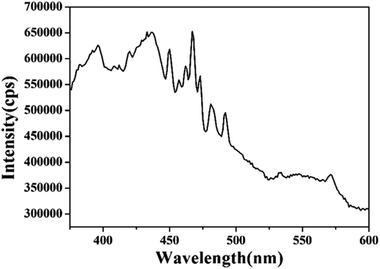
Fig. 7 shows the PL spectrum of the prepared porous ZnSnO3 nanocubes. The PL spectrum of the porous ZnSnO3 nanocubes displays a near-band-edge excitonic emission ranging between 360 and 480 nm which is similar to that reported in the literature.40 The blue–green light luminescence from the as synthesized porous ZnSnO3 nanocubes can be attributed to the oxygen-related defects that have been introduced during growth. The emission peak at 394 nm is believed to be due to the oxygen vacancies which can combine with the holes of the valence band to form VO++.41 The emission peak at 437 nm is attributed to the Sn interstitials.42,43 The emission at 446 nm is attributed to the transition from shallow donors (oxygen vacancies) to the valence band.43,44 The existence of oxygen vacancies promotes the formation of adsorbed oxygen,45 which in turn promotes the reaction of the gas and the adsorbed oxygen, and ultimately improves the sensitivity of the sensor.
3.2. Gas-sensing performance
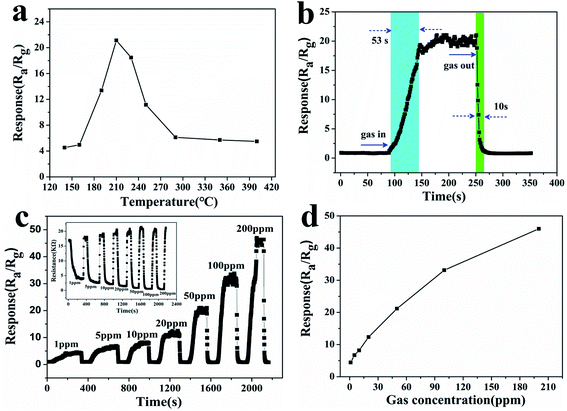
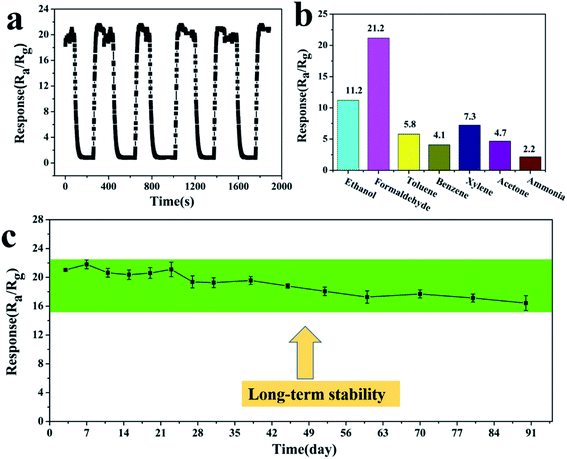
During gas testing, the operation temperature is a very important factor. Changes in the operating temperature could influence the reaction kinetics of the gas molecules and oxygen adsorbed on the material’s surface.46 The relationship between the response and the operating temperature of the sintered sensor was investigated, and is shown in Fig. 8a. The results showed that the response of the sensor increases at first and then decreases with the change of working temperature in the temperature range from 130 to 400 °C. At a lower temperature, the oxygen adsorption rate is greater than the desorption rate. With the increase of temperature, the molecular weight of oxygen adsorbed on the surface of the gas-sensing material increases, and the sensitivity of the gas-sensing material increases. At a higher temperature, the oxygen adsorption rate is weaker than the desorption rate, and the adsorbed oxygen molecules are desorbed, so the sensitivity decreases with the increase of temperature.47 The porous ZnSnO3 nanocube sensor had a high response (21.2) to 50 ppm formaldehyde at 210 °C, and the adsorption–desorption rate reaches equilibrium. Thus, the operating temperature of 210 °C was selected as the optimum operating temperature for subsequent testing. Fig. 8b shows the response–recovery curve of the porous ZnSnO3 nanocube sensor to 50 ppm formaldehyde at 210 °C. Under the test temperature of 210 °C, the response and recovery times of the porous ZnSnO3 nanocube sensors to 50 ppm formaldehyde are 53 s and 10 s, respectively. Due to the porous structure having more active sites, more gas can diffuse into the material during the adsorption process and more oxygen is needed to deplete the electrons in the material during desorption, which eventually increases the response recovery time. The relationship between the response and the formaldehyde concentration for the porous ZnSnO3 nanocube sensor can be observed in Fig. 8c and d. From the dynamic response curves in Fig. 8c, we can see that the response amplitude increases with the increase of formaldehyde concentration in the range of 1–200 ppm. The inset of Fig. 8c shows the curve of the sensor resistance to 1–200 ppm formaldehyde. With the increase of the gas concentration, the resistance of the material decreases. At lower concentrations (1–50 ppm), the sensor exhibits a linear relationship between the sensor response and the formaldehyde concentration, while at higher concentrations (>50 ppm) the surface coverage tends to saturate and hence leads to a saturation of the response. Under the operating temperature of 210 °C, the sensor could detect 1 ppm formaldehyde with a sensitivity of 4.4 (Fig. 8d).Gas-sensing repeatability is an important parameter to evaluate the gas-sensing ability of semiconductor materials. The porous ZnSnO3 nanocube sensor was investigated with 50 ppm formaldehyde for 5 cycles at 210 °C (Fig. 9a). The response time and the recovery time, as well as the response values, are almost reproducible between 50 ppm formaldehyde and ambient air, which indicate that the sensor has good reversibility and repeatability for the detection of formaldehyde. Fig. 9c shows the gas sensing stability of the sensor. It can be seen that the responses of the sensor had an acceptable change after a pulse test for 90 days, indicating the good stability of the sensor. Gas selectivity is also an important index to evaluate the gas sensitivity. To detect the selectivity of the sensor, the sensitivities of the porous ZnSnO3 nanocube sensor to different 50 ppm gases were tested at 210 °C. It can be seen from Fig. 9b that the response of the sensor to formaldehyde is significantly higher than that of other gases. The sensitivity (21.2) of the sensor to formaldehyde is twice as much as ethanol (11.2) and 3 times that of the other five gases, indicating that the prepared porous ZnSnO3 nanocube sensor has good selectivity.
Table 1 shows the formaldehyde sensing performances of various ZnSnO3 based gas sensors. Obviously, the response of the porous ZnSnO3 nanocubes is much higher than those of mesoporous ZnSnO3 hollow microspheres,48 ZnSnO3 nanosheets,49 ZnSnO3/wt 10% SnO2 concave microcubes,50 porous ZnSnO3 cubes,35 ZnSnO3 hollow microspheres,51 ZnSnO3 hollow nanocubes,52 hierarchical ZnSnO3 nanocages53 and hollow ZnSnO3 cubic nanocages.54 The gas sensing response enhancement may be attributed to the porous structure and the more numerous active centers obtained from the enhanced oxygen vacancy defects on the porous nanostructure, as shown in the PL spectra.
| Materials | Operating tem. (°C) | Concentration (ppm) | Response (Ra/Rg) | Ref. |
|---|---|---|---|---|
| ZnSnO3 hollow microspheres | 270 | 50 | ∼5 | 48 |
| ZnSnO3 nanosheets | 300 | 20 | ∼3 | 49 |
| ZnSnO3/wt 10% SnO2 concave microcubes | 260 | 50 | ∼5 | 50 |
| Porous ZnSnO3 cubes | 240 | 100 | 15 | 35 |
| ZnSnO3 hollow microspheres | 280 | 100 | ∼5 | 51 |
| ZnSnO3 hollow nanocubes | 280 | 100 | ∼6 | 52 |
| Hierarchical ZnSnO3 nanocages | 270 | 50 | 2 | 53 |
| Hollow ZnSnO3 cubic nanocages | 210 | 50 | 5.4 | 54 |
| Porous ZnSnO3 nanocubes | 210 | 50 | 21.2 | Present work |
3.3. Gas-sensing mechanism
ZnSnO3 is a typical surface-controlled gas-sensitive material. Fig. 10 shows the schematic diagrams of the gas sensing mechanism of the porous ZnSnO3 nanocube sensor. In the air, oxygen atoms permeate through the surface of the material through physical adsorption and chemical adsorption, and capture electrons in the material to form negative O2−, O2−, and O− species,55 resulting in an increase in the resistance of the ZnSnO3 sensor, which can be described as follow:| O2(g) → O2(ads) | (1) |
| O2(ads) + e− → O2−(ads) | (2) |
| O2−(ads) + e− → 2O−(ads) | (3) |
| O2−(ads) + e− → 2O2−(ads) | (4) |
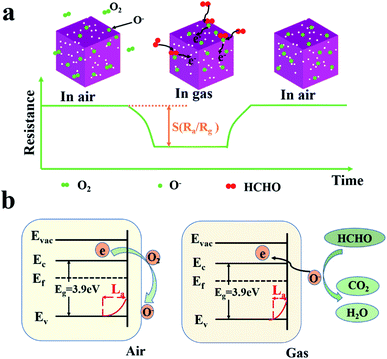 | ||
| Fig. 10 Schematic diagrams of the gas sensing mechanism of the porous ZnSnO3 nanocube sensors. (a) Schematic diagram of the resistance change; (b) schematic diagram of the energy band theory. | ||
Upon exposure to a reducing gas, the gas could react with the chemisorbed oxygen and then return the electron to the conduction band of the sensing material, decreasing the resistance of the sensor (Fig. 10a). This process leads to a shrinking electron transport barrier and a reduced electron depletion barrier, which greatly reduces the thickness of the depletion layer, resulting in a low resistance state (Rg) (Fig. 10b). The occurring reaction can be explained as followed:
| HCHO(gas) → HCHO(ads) | (5) |
| HCHO(ads) + 2O−(ads) → CO2 + H2O(g) + 2e− | (6) |
When the gas is desorbed from the surface of the material, the electrons in the material will continue to react with oxygen to produce the corresponding adsorbed oxygen. In addition to the grain size effect, the excellent formaldehyde sensing properties of the porous ZnSnO3 nanocubes can be attributed to the porous structure and large specific surface area (70.001 m2 g−1), which means that more formaldehyde and oxygen molecules can be adsorbed on the ZnSnO3 surface.
4. Conclusions
In summary, porous ZnSnO3 nanocubes are successfully synthesized by a facile hydrothermal method combined with subsequent calcination. The size of the ZnSnO3 nanocubes is about 100 nm and the corresponding specific surface area is 70.001 m2 g−1. The porous structure could increase the concentration of the oxygen vacancies, thereby increasing the number of active sites, which is verified by the TEM and PL results. The gas sensing performance showed that the porous ZnSnO3 nanocubes sensor could detect 50 ppm formaldehyde at about 210 °C with a response value of 21.2, which is 3 times that of the other gases. The sensor has a higher sensitivity which may possibly result from the porous structure and more numerous exposed active sites. After 90 days of testing, the sensor still has high sensitivity to formaldehyde. Therefore, the prepared porous ZnSnO3 nanocubes can be regarded as one of the promising sensing materials for the efficient detection of formaldehyde.Author contributions
Jiaoling Zheng: experimental operation, writing – review & editing. Huanhuan Hou: experimental operation. Hao Fu: data curation, formal analysis. Liping Gao: conception, supervision, data curation. Hongjie Liu: data curation, formal analysis.Conflicts of interest
There are no conflicts to declare.Acknowledgements
The authors acknowledge the Science and Technology Plan Project of Chuzhou (2019ZN005) and the College Students Innovation and Entrepreneurship Training Project (202010377023).References
- M. Mori, Y. Itagaki and Y. Sadaoka, Effect of VOC on ozone detection using semiconducting sensor with SmFe1−xCoxO3 perovskite-type oxides, Sens. Actuators, B, 2012, 163, 44–50 CrossRef CAS.
- Y. Zeng, T. Zhang, L. Wang, M. Kang, H. Fan, R. Wang and Y. He, Enhanced toluene sensing characteristics of TiO2-doped flowerlike ZnO nanostructures, Sens. Actuators, B, 2009, 140, 73–78 CrossRef CAS.
- A. Allouch, M. Guglielmino, P. Bernhardt, C. A. Serra and S. L. Calvé, Transportable, fast and high sensitive near real-time analyzers: formaldehyde detection, Sens. Actuators, B, 2013, 181, 551–558 CrossRef CAS.
- T. S. Wang, B. Jiang, Q. Yu, X. Y. Kou, P. Sun, F. M. Liu, H. Y. Lu, X. Yan and G. Y. Lu, Realizing the Control of Electronic Energy Level Structure and Gas-Sensing Selectivity over Heteroatom Doped In2O3 Spheres with an Inverse Opal Microstructure, ACS Appl. Mater. Interfaces, 2019, 11, 9600–9611 CrossRef CAS PubMed.
- J. A. Dirksen, K. Duval and T. A. Ring, NiO thin-film formaldehyde gas sensor, Sens. Actuators, B, 2001, 80, 106–115 CrossRef CAS.
- L. P. Liu, X. G. Li, P. K. Dutta and J. Wan, Room temperature impedance spectroscopy-based sensing of formaldehyde with porous TiO2 under UV illumination, Sens. Actuators, B, 2013, 185, 1–9 CrossRef CAS.
- G. R. Mohimann, Formaldehyde detection in air by laser induced fluorescence, Appl. Spectrosc., 1985, 39, 98–101 CrossRef.
- E. Norkus, A. Vaskelis and R. Pauliukaite, Polarographic Determination of Formaldehyde According to the Anodic Oxidation Wave in Alkaline Solutions, Electroanalysis, 1999, 11, 447–449 CrossRef CAS.
- X. L. Wang and L. Zhang, Headspace-Gas Chromatography Method for Determination of Formaldehyde Content in Wastewater, IOP Conf. Ser.: Mater. Sci. Eng., 2021, 647, 012155 CrossRef.
- Z. J. Wang, J. Liu, F. J. Wang, S. Y. Chen, H. Luo and X. B. Yu, Size-Controlled Synthesis of ZnSnO3 Cubic Crystallites at Low Temperatures and Their HCHO-Sensing Properties, J. Phys. Chem. C, 2010, 114, 13577–13582 CrossRef CAS.
- L. Q. Shi, J. B. Cui, F. Zhao, D. J. Wang, T. F. Xie and Y. H. Lin, High-performance formaldehyde gas-sensors based on three-dimensional center-hollow ZnO, Phys. Chem. Chem. Phys., 2015, 173, 1316–31323 Search PubMed.
- Y. X. Li, N. Chen, D. Y. Deng, X. X. Xing, X. C. Xiao and Y. D. Wang, Formaldehyde detection: SnO2 microspheres for formaldehyde gas sensor with high sensitivity, fast response/recovery and good selectivity, Sens. Actuators, B, 2017, 238, 264–273 CrossRef CAS.
- Z. H. Tao, Y. W. Li, B. Zhang, G. Sun, M. Xiao, H. Bala, J. L. Cao, Z. Y. Zhang and Y. Wang, Synthesis of urchin-like In2O3 hollow spheres for selective and quantitative detection of formaldehyde, Sens. Actuators, B, 2019, 298, 126889 CrossRef CAS.
- B. Bouchikhi, T. Chludziński, T. Saidi, J. Smulko, N. E. Bari, H. Wen and R. Ionescu, Formaldehyde detection with chemical gas sensors based on WO3 nanowires decorated with metal nanoparticles under dark conditions and UV light irradiation, Sens. Actuators, B, 2020, 320, 128331 CrossRef CAS.
- C. L. Zhao, Y. F. Ren, S. S. Chen, L. Yang and Y. Guo, The enhanced ethanol sensing properties obtained by the introduction of NiO into ZnO/SnO2 mixed metal oxides, J. Solid State Chem., 2018, 265, 345–352 CrossRef CAS.
- C. H. Liu, R. Röder, L. C. Zhang, Z. Ren, H. Y. Chen, Z. H. Zhang, C. Ronning and P. X. Gao, Highly efficient visible-light driven photocatalysts: a case of zinc stannate based nanocrystalassemblies, J. Mater. Chem. A, 2014, 2, 4157–4167 RSC.
- L. Y. Du, D. X. Wang, K. K. Gu and M. Z. Zhang, Construction of PdO-decorated double-shell ZnSnO3 hollow microspheres for n-propanol detection at low temperature, Inorg. Chem. Front., 2021, 8, 787–795 RSC.
- H. Men, P. Gao, B. B. Zhou, Y. J. Chen, C. L. Zhu, G. Xiao, L. Q. Wang and M. L. Zhang, Fast synthesis of ultra-thin ZnSnO3 nanorods with high ethanol sensing properties, Chem. Commun., 2010, 46, 7581–7583 RSC.
- B. S. Wang, J. B. Yu, X. H. Li, J. Yin and M. Chen, Synthesis and high formaldehyde sensing properties of quasi two-dimensional mesoporous ZnSnO3 nanomaterials, RSC Adv., 2019, 9, 14809–14816 RSC.
- X. Y. Wang, H. Li, X. T. Zhu, M. Z. Xia, T. Tao, B. X. Leng and W. Xu, Improving ethanol sensitivity of ZnSnO3 sensor at low temperature with multi-measures: Mg doping, nano-TiO2 decoration and UV radiation, Sens. Actuators, B, 2019, 297, 126745 CrossRef CAS.
- Y. L. Qin, F. F. Zhang, X. C. Du, G. Huang, Y. C. Liu and L. M. Wang, Controllable synthesis of cube-like ZnSnO3@TiO2 nanostructures as lithium-ion battery anodes, J. Mater. Chem. A, 2015, 3, 2985–2990 RSC.
- Z. Y. Wang, J. Y. Miao, H. X. Zhang, D. Wang and J. B. Sun, Hollow cubic ZnSnO3 with abundant oxygen vacancies for H2S gas sensing, J. Hazard. Mater., 2020, 391, 122226 CrossRef CAS PubMed.
- F. Guo, X. L. Huang, Z. H. Chen, H. J. Ren, M. Y. Li and L. Z. Chen, MoS2 nanosheets anchored on porous ZnSnO3 cubes as an efficient visible-light-driven composite photocatalyst for the degradation of tetracycline and mechanism insight, J. Hazard. Mater., 2020, 390, 122158 CrossRef CAS PubMed.
- Y. Y. Yin, Y. B. Shen, P. F. Zhou, R. Lu, A. Li, S. K. Zhao, W. G. Liu, D. Z. Wei and K. F. Wei, Fabrication, characterization and n-propanol sensing properties of perovskite-type ZnSnO3 nanospheres based gas sensor, Appl. Surf. Sci., 2020, 509, 145335 CrossRef CAS.
- G. Q. Feng, Y. H. Che, C. W. Song, J. K. Xiao, X. F. Fan, S. Sun, G. H. Huang and Y. C. Ma, Morphology-controlled synthesis of ZnSnO3 hollow spheres and their n-butanol gas-sensing performance, Ceram. Int., 2021, 47, 2471–2482 CrossRef CAS.
- H. Men, P. Gao, B. B. Zhou, Y. J. Chen, C. L. Zhu, G. Xiao, L. Q. Wang and M. L. Zhang, Fast synthesis of ultra-thin ZnSnO3 nanorods with high ethanol sensing properties, Chem. Commun., 2010, 46, 7581–7583 RSC.
- G. Wang, Y. Xi, H. Xuan, R. Liu, X. Chen and L. Cheng, Hybrid nanogenerators based on triboelectrification of a dielectric composite made of lead-free ZnSnO3 nanocubes, Nano Energy, 2015, 18, 28–36 CrossRef CAS.
- Y. Yin, F. Li, N. Zhang, S. Ruan, H. Zhang and Y. Chen, Improved gas sensing properties of silver functionalized ZnSnO3 hollow nanocubes, Inorg. Chem. Front., 2018, 5, 2123–2131 RSC.
- L. L. Wang, T. Fei, Z. Lou and T. Zhang, Three-dimensional hierarchical flowerlike-Fe2O3 nanostructures: synthesis and ethanol-sensing properties, ACS Appl. Mater. Interfaces, 2011, 3, 4689–4694 CrossRef CAS PubMed.
- Y. H. Li, W. Luo, N. Qin, J. P. Dong, J. Wei, W. Li, S. S. Feng, J. C. Chen, J. Q. Xu, A. A. Elzatahry, M. H. Es-Saheb, Y. H. Deng and D. Y. Zhao, Highly ordered mesoporous tungsten oxides with a large pore size and crystalline framework for H2S sensing, Angew. Chem., Int. Ed., 2014, 53, 9035–9040 CrossRef CAS PubMed.
- Q. J. Fu, M. M. Ai, Y. Duan, L. M. Lu, X. Tian, D. D. Sun, Y. Y. Xu and Y. Q. Sun, Synthesis of uniform porous NiO nanotetrahedra and their excellent gas-sensing performance toward formaldehyde, RSC Adv., 2017, 7, 52312–52320 RSC.
- K. Yang, J. Z. Ma, X. K. Qiao, Y. W. Cui, L. C. Jia and H. Q. Wang, Hierarchical porous LaFeO3 nanostructure for efficient trace detection of formaldehyde, Sens. Actuators, B, 2020, 313, 128022 CrossRef CAS.
- D. Sun, H. X. Guo, Y. Li, H. Y. Li, X. S. Li, C. X. Tian, J. X. Zhang and L. Liu, 3D ordered porous SnO2 with a controllable pore diameter for enhanced formaldehyde sensing performance, Funct. Mater. Lett., 2020, 13, 2051044 CrossRef CAS.
- L. P. Gao, Z. X. Cheng, Q. Xiang, Y. Zhang and J. Q. Xu, Porous Corundum-type In2O3 nanosheets: Synthesis and NO2 sensing properties, Sens. Actuators, B, 2015, 208, 436–443 CrossRef CAS.
- J. R. Huang, X. J. Xu, C. P. Gu, W. Z. Wang, B. Y. Geng, Y. F. Sun and J. H. Liu, Size-controlled synthesis of porous ZnSnO3 cubes and their gas-sensing and photocatalysis properties, Sens. Actuators, B, 2012, 171–172, 572–579 CrossRef CAS.
- Y. K. Wang and J. M. Zhang, Synthesis and Electrochemical Performance of Amorphous ZnSnO3 Hollow Cubes, J. Chin. Ceram. Soc., 2016, 44, 1434–1440 Search PubMed.
- F. Han, W. C. Li, C. Lei, B. He, K. Oshida and A. H. Lu, Selective Formation of Carbon-Coated, Metastable Amorphous ZnSnO3 Nanocubes Containing Mesopores for Use as High-Capacity Lithium-Ion Battery, Small, 2014, 10, 2637–2644 CrossRef CAS PubMed.
- X. F. Li, X. B. Meng, J. Liu, D. S. Geng, Y. Zhang, M. N. Banis, Y. L. Li, J. L. Yang, R. Y. Li, X. L. Sun, M. Cai and M. W. Verbrugge, Tin Oxide with Controlled Morphology and Crystallinity by Atomic Layer Deposition onto Graphene Nanosheets for Enhanced Lithium Storage, Adv. Funct. Mater., 2012, 22, 1647–1654 CrossRef CAS.
- Z. Y. Wang, Z. C. Wang, W. T. Liu, W. Xiao and X. W. Lou, Amorphous CoSnO3@C nanoboxes with superior lithium storage capability, Energy Environ. Sci., 2013, 6, 87–91 RSC.
- S. Y. Dong, J. Y. Sun, Y. K. Li, C. F. Yu, Y. H. Li and J. H. Sun, ZnSnO3 hollow nanospheres/reduced graphene oxide nanocomposites as high-performance photocatalysts for degradation of metronidazole, Appl. Catal., B, 2014, 144, 386–393 CrossRef CAS.
- F. Gu, S. F. Wang, M. K. Lü, X. F. Cheng, S. W. Liu, G. J. Zhou, D. Xu and D. R. Yuan, Luminescence of SnO2 thin films prepared by spin-coating method, J. Cryst. Growth, 2004, 262, 182–185 CrossRef CAS.
- H. Sefardjella, B. Boudjema, A. Kabir and G. Schmerber, Structural and photoluminescence properties of SnO2 obtained by thermal oxidation of evaporated Sn thin films, Curr. Appl. Phys., 2013, 13, 1971–1974 CrossRef.
- I. Saafi, R. Dridi, R. Mimouni, A. Amlouk, A. Yumak, K. Boubaker, P. Petkova and M. Amlouk, Microstructural and optical properties of SnO2–ZnSnO3 ceramics, Ceram. Int., 2016, 42, 6273–6281 CrossRef CAS.
- A. B. Djurišić, W. C. H. Choy, V. A. L. Roy, Y. H. Leung, C. Y. Kwong, K. W. Cheah, T. K. GunduRao, W. K. Chan, H. Fei Lui and C. Surya, Photoluminescence and Electron Paramagnetic Resonance of ZnO Tetrapod Structures, Adv. Funct. Mater., 2004, 14, 856–864 CrossRef.
- Q. Zhang, S. P. Wang, L. W. Wang, Y. L. Huang, Y. H. Wang, K. F. Yu and L. P. Gao, Vapor-phase Modulated Sphere-like In2O3@N–C Complexes for Improving Gas Sensitivity, J. Alloys Compd., 2021, 865, 158702 CrossRef CAS.
- H. Li, W. Y. Xie, B. Liu, Y. R. Wang, S. H. Xiao, X. C. Duan, Q. H. Li and T. H. Wang, Ultra-fast and highly-sensitive gas sensing arising from thin SnO2 inner wall supported hierarchical bilayer oxide hollow spheres, Sens. Actuators, B, 2017, 240, 349–357 CrossRef CAS.
- L. P. Gao, H. Fu, J. j. Zhu, J. H. Wang, Y. P. Chen and H. J. Liu, Synthesis of SnO2 nanoparticles for formaldehyde detection with high sensitivity and good selectivity, J. Mater. Res., 2020, 35, 2208–2217 CrossRef CAS PubMed.
- Y. F. Bing, Y. Zeng, C. Liu, L. Qiao, Y. M. Sui a, B. Zou, W. T. Zheng and G. T. Zou, Assembly of hierarchical ZnSnO3 hollow microspheres from ultra-thin nanorods and the enhanced ethanol-sensing performances, Sens. Actuators, B, 2014, 190, 370–377 CrossRef CAS.
- L. Y. Du, H. P. Zhang, M. M. Zhu and M. Z. Zhang, Construction of flower-like ZnSnO3/Zn2SnO4 hybrids for enhanced phenylamine sensing performance, Inorg. Chem. Front., 2019, 6, 2311–2317 RSC.
- J. T. Zhang, X. H. Jia, D. D. Lian, J. Yang, S. Z. Wang, Y. Li and H. J. Song, Enhanced selective acetone gas sensing performance by fabricating ZnSnO3/SnO2 concave microcube, Appl. Surf. Sci., 2021, 542, 148555 CrossRef CAS.
- X. H. Jia, M. G. Tian, R. R. Dai, D. D. Lian, S. Han, X. Y. Wu and H. J. Song, One-pot template-free synthesis and highly ethanol sensing properties of ZnSnO3 hollow microspheres, Sens. Actuators, B, 2017, 240, 376–385 CrossRef CAS.
- Y. Y. Yin, F. Li, N. Zhang, S. P. Ruan, H. F. Zhang and Y. Chen, Improved gas sensing properties of silver-functionalized ZnSnO3 hollow nanocubes, Inorg. Chem. Front., 2018, 5, 2123–2131 RSC.
- Y. Zeng, K. Zhang, X. L. Wang, Y. M. Sui, B. Zou, W. T. Zheng and G. T. Zou, Rapid and selective H2S detection of hierarchical ZnSnO3 nanocages, Sens. Actuators, B, 2011, 159, 245–250 CrossRef CAS.
- Y. Zeng, X. L. Wang and W. T. Zheng, Synthesis of Novel Hollow ZnSnO3 Cubic Nanocages and Their HCHO Sensing Properties, J. Nanosci. Nanotechnol., 2013, 13, 1286–1290 CrossRef CAS PubMed.
- X. An, J. C. Yu, Y. Wang, Y. Hu, X. Yu and G. Zhang, WO3 nanorods/graphene nanocomposites for high-efficiency visible-light-driven photocatalysis and NO2 gas sensing, J. Mater. Chem., 2012, 22, 8525–8531 RSC.
Footnote |
| † These authors contributed equally to this work. |
| This journal is © The Royal Society of Chemistry 2021 |

