 Open Access Article
Au–Ag core–shell composite nanoparticles as a selective and sensitive plasmonic chemical probe for L-cysteine detection in Lens culinaris (lentils)
Anushree Saha,
Beeta Rani Khalkho and
Manas Kanti Deb *
*
School of Studies in Chemistry, Pt. Ravishankar Shukla University, Raipur-492 010, Chhattisgarh, India. E-mail: debmanas@yahoo.com; Tel: +91-9425503750
First published on 7th June 2021
Abstract
The present work reported is a simple and selective method for the colorimetrical detection of L-cysteine in Lens culinaris (or lentils) using Au–Ag core–shell (Au core Ag shell) composite nanoparticles as a chemical probe. The phenomenon is based on the color change of composite nanoparticles from yellowish brown to light blue, followed by a shift of the localized surface plasmon resonance (LSPR) absorption band in the UV-visible region (i.e., 200–800 nm) with the addition of L-cysteine into the solution of bimetallic nanoparticles. The mechanism for the detection of L-cysteine is based on the electrostatic interaction of the metal ion with the thiol group of the amino acid, which causes the red shift of the LSPR band at 685 nm. The size distribution, morphology, composition and optical properties of the Au–Ag core–shell composite nanoparticles were characterized by transmission electron microscopy (TEM), dynamic light scattering (DLS), energy dispersive X-ray diffraction (EDX), UV-visible spectrophotometer and Fourier transform infrared spectroscopy (FTIR) techniques. An excellent linearity range for the present method was observed in the range of 20–140 μg mL−1 with a limit of detection at 1.95 μg mL−1 and correlation coefficient (R2) of 0.986. A good% recovery of 4.0% showed the selectivity of the method for L-cysteine determination from sample matrices. The advantageous features of the present method are being simple, rapid, low cost and selectivity towards the determination of L-cysteine in lentils.
Introduction
Biomolecules are organic and inorganic moieties found inside all living organisms, which perform physiological functions in the human body. They comprise macromolecules such as carbohydrates, proteins, lipids and nucleic acids, along with micromolecules, which include primary metabolites, secondary metabolites and natural products. On this basis, they are classified into carbohydrates (e.g., glucose, fructose, sucrose) and amino acids (e.g., cysteine, histidine), which generally consist of carbon, hydrogen, nitrogen, oxygen, sulphur and phosphorus atoms, that are present as an active binding site in the biomolecules and play an essential role in metabolic processes in the human body.1–3 L-Cysteine (2 amino-3-mercaptopropanoic acid, HSCH2CH(NH2)COOH) is supplemented majorly through protein-rich foods and comprises one of the proteinogenic amino acids. It is found in protein-rich foods in large amounts. L-Cysteine (classified as a flavoring agent by the Joint FAO expert committee (JECFA)) is a permitted food additive and is included in the diet in the form of processed cereal-based food, food for infants and young children, infant formula and nutritional supplements, and is believed to be of high nutritional benefit. This semi essential amino acid turns out to be a significant bio-thiol by stabilizing protein structures via donation of a disulfide bond in the folded proteins to increase their rigidity, and also to convene their appropriate functions.3–5 It is a sulphur-containing amino acid, which also participates in several enzymatic and redox reactions. The biological significance of L-cysteine may have forced to be chosen as an important area of study. In our body, it is found as a backbone component of many proteins. Many cellular functions, including, metabolism, bio-catalysis, detoxification, post translation modification, metal binding and the most essential protein synthesis process, i.e., protein folding, is mainly caused by cysteine.5,6 The chemical composition of lentils reflects a wide genetic and environmental variability. It is noteworthy that peas and lentils generally contain from 15 to 40% protein.7 Since most cellular functions mentioned above, are dependent upon cysteine, its abnormal levels may cause various body problems and diseases, including liver damage, skin lesions, hair de-pigmentation, muscle contraction, cancer, HIV, slow growth, cardiovascular disease and Alzheimer's disease.5,8 Thus, the methods for cysteine identification in a real sample are considered as a much fascinating area of research.Conventionally, various techniques, such as spectrofluorimetry,9 chromatography techniques (i.e., gas chromatography-mass spectrometry, high-performance liquid chromatography),10 chemiluminescence,11 mass spectrometry,12 optical spectroscopy13 and capillary electrophoresis,14 have been considered to be of great importance for the determination of cysteine concentrations. However, some of these methods exhibit numerous inherent drawbacks, such as specific instrumentation, limited sensitivity, time consuming, use of high temperature condition, requirement of a huge amount of organic solvent for sample preparation, difficulty in handling, and unsuitability towards routine analysis. Therefore, developing a quick and effortless detection method for cysteine is of great interest. The colorimetric detection method is considered to be the simplest, ultra-sensitive and trouble-free optical measurement technique, in which the change in the colour of the nano-sized solution can be easily detected by naked eyes without making use of any of instrument.
Recent studies show that the unique properties of noble metal nanoparticles, such as, Au (gold), Ag (silver), Cu (copper) and their bimetallic nanoparticles (i.e., Au@Ag; Ag@Au; Au@Cu) have attracted much attention and in modern science; they are used as an ultrasensitive detection and imaging probes for the colorimetric determination of biomolecules, metal ions and different toxic chemical substances from different types of biological, environmental and food samples.15–18 The sensing is based on a color change, followed by a red shift in the localized surface plasmon resonance (LSPR) of metal nanoparticles in the visible region, which makes it an ideal candidate for wavelength-dependent studies. LSPR is an optical property of noble metal and metal–metal nanoparticles that occurs because of the interaction of an external electromagnetic radiation with metal nanoparticles, resulting in consistent oscillations of a conduction electron within the surface (called surface plasmon resonance).19,20 The color change of metal/bimetallic nanoparticles is observed when a target analyte is introduced into the respective nanoparticle solution. The reason for the distinct change in color is due to the aggregation of nanoparticles triggered by the morphology transition and surface chemical reactions. The aggregation of metal/bimetallic nanoparticles causes a red shift of the LSPR absorption band in the visible region, as compared to the monodispersed nanoparticles before the addition of an analyte.21–23 In particular, bimetallic nanoparticles with a core–shell structure often exhibit improved physical and chemical properties, like high selectivity, high sensitivity, high surface area, high progression capability, and high reactivity. It is useful to think of a strategy to use the advantages of noble metal–metal core–shell composite nanoparticles to benefit the studies. Based on this abovementioned mechanistic pathway, a variety of methods have been developed to exploit the noble metal/bi-metallic nanoparticles as colorimetric probes/sensors for the detection of amino acids,23,24 cysteine,25 drugs,26 metal ions,27 surfactants28 and other compounds.
Therefore, the present work includes thorough investigations on the citrate-capped Au–Ag core–shell composite nanoparticles as a possible candidate for wavelength-dependent studies for a bio-sensing chemical probe by initially synthesizing the Au–Ag core shell metal–metal nanocomposite, followed by employing the prepared core shell nanocomposite in the colorimetric detection of an amino acid, i.e., L-cysteine. The analytical parameters, such as the pH, reaction time and concentration of the analyte, were optimized for the effective detection of L-cysteine. This method is based on the color change and red shift of the LSPR band at λmax 685 nm, and is due to the replacement of citrate capping groups from the surface of core–shell nanoparticles by L-cysteine perturbing the stability of the Au@Ag composite nanoparticles, which further directed the aggregation of particles. The size, elemental composition, optical properties and interaction between L-cysteine and the Au@Ag composite nanoparticles are investigated by transmission electron microscopy (TEM), dynamic light scattering (DLS), energy dispersive X-ray diffraction (EDX), Fourier transform infrared spectroscopy (FTIR) and UV-visible spectrophotometer. The advantages of using the Au@Ag based colorimetric probe are its rapidity, ease of synthesis, simple operation, and selectiveness towards the determination of L-cysteine from environmental samples at very trace level. The plasmonic property of the Au–Ag core–shell composite nanoparticles was demonstrated as a chemical probe for the quantitative detection of L-cysteine in lentils (Lens culinaris) food samples.
Experimental section
Chemicals and solution preparation
All of the chemicals used in this work were analytical grade. Chloroauric acid (HAuCl4), silver nitrate (AgNO3) and spectroscopic grade potassium bromide (KBr) were purchased from Sigma-Aldrich (ACS reagent, ≥99.99%, St. Louis, MA, USA). Sodium citrate (Na3C6H5O7) was used as received from Merck (KGaA Darmstadt, Germany). Urea, histidine, tryptophan, glutamic acid, creatinine, L-cysteine, methionine, glutathione, threonine, phenylalanine, arginine and proline were obtained from Hi-Media (AR reagent, 99.0% Mumbai, India). Ultrapure water (18.2 MΩ cm) was used for preparing all of the solutions. The stock solutions (1000 μg mL−1) of all the biomolecules (i.e., amino acids) were prepared by dissolving a proper quantity of substance in ultrapure water. The working solutions were prepared by the appropriate dilution of the standard stock solution.Instrumentation and characterization
All measurements of absorption via LSPR band were done using a UV-visible spectrophotometer (Carry 60 UV-vis, Agilent Technologies) by taking the solution in a 1 cm quartz cuvette. The absorbance bands were collected in the range of 200–800 nm for the determination of L-cysteine. The size and shape of the Au–Ag core–shell composite nanoparticles and aggregated Au–Ag core–shell composite nanoparticles with L-cysteine were analysed and measured by transmission electron microscopy (TEM) and dynamic light scattering (DLS) techniques. A diffused reflectance-Fourier transform infrared (DRS-FTIR) spectrometer (Nicolet iS10, Thermo Fisher Scientific Instrument, Madison, USA) equipment was employed for spectral measurements. The spectral scans were recorded in the region of 4000–400 cm−1, where a minimum resolution of 4 cm−1 with an average of 32 scans was acquired for each spectral measurement and a potassium bromide (KBr) beam splitter was used. For acquisition and processing of the spectra, Omnic 9 and TQ analysis software packages (Nicolet iS10) were used. An energy dispersive X-ray diffraction (EDX) (ZEISS EVO 18) apparatus was used for the determination of the Au–Ag composition. A Smart2Pure Thermo Fisher Scientific Barnstead water system (conductivity 18.2 Ω) was used to obtain ultrapure water. For the measurement of pH, a Systronic digital pH meter was employed.Synthesis of Au–Ag core shell metal–metal nanocomposites
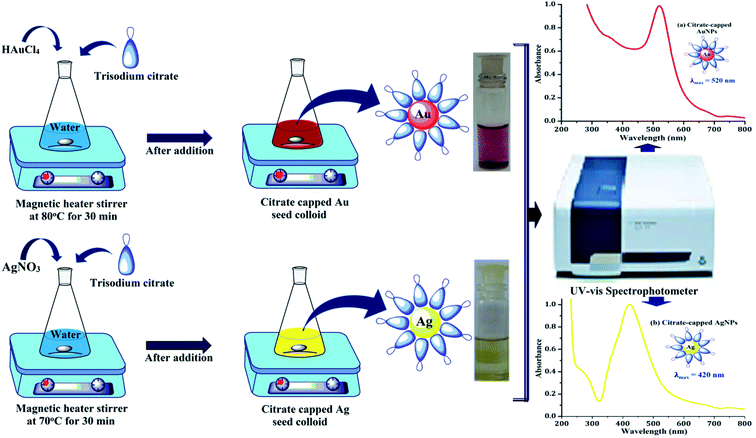
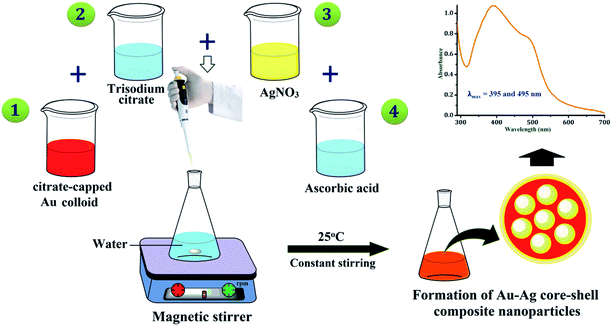
First of all, the Au and Ag seed colloids were prepared separately by using the thermal reduction method.29,30 The colloid of gold was prepared by taking a 150 mL conical flask having 100 mL of ultrapure water, and it was placed onto the magnetic stirrer with heating at 80 °C for boiling. The 1 mL of 1% aqueous solution of HAuCl4 and 2 mL of 38.8 × 10⁻³ M trisodium citrate solution were added to the boiling water. After 10–20 s of the addition process, the solution became blackish-blue. Within 40 s, it turned purple-red, indicating the formation of citrate-capped gold nanoparticles (AuNPs). It was cooled quickly using a cold water bath. Similarly, for the preparation of silver colloids, 100 mL ultrapure water was heated at 70 °C, 0.018 g of AgNO3 was added to it and the aqueous solution of 2 mL of 38.8 × 10⁻³ M trisodium citrate was added dropwise with continuous stirring. After the color of the solution mixture turned light yellow, it was cooled quickly using a cold water bath. The yellow colour of the solution indicated the formation of citrate-capped silver nanoparticles (AgNPs). For the conformation of nanoparticles formed, both were analysed using a UV-vis spectrophotometer at the maxima of approximately 520 nm and 420 nm, respectively (Fig. 1).The nanocomposite particles of the Au-core/Ag-shell were prepared by seed colloid method. In a 30 mL of water, the as-prepared colloid of citrate-capped AuNPs (0.4, 1, 2, 5, 10, 20 and 40 mL) and 38.8 mM of sodium citrate solution (1 mL) were added, while stirring on a magnetic stirrer. Then, 10 mM aqueous solution of AgNO3 (1.2 mL) and 100 mM aqueous solution of ascorbic acid (0.4 mL) were added into the above mixture while stirring.30 After 15–20 min, the absorbance of the composite particles was measured. Finally, the bimetallic core–shell nanoparticles were prepared, which was confirmed by obtaining two LSPR bands in the UV-vis region, as shown in Fig. 2.
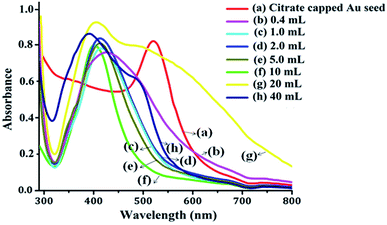
The UV-vis absorbance spectra of the pure Au colloid and formation of the Au-core/Ag-shell composite nanoparticles with varying Au colloid concentrations are shown in Fig. 3. The absorbance spectra of the pure citrate-capped AuNPs were obtained at 520 nm. When the concentration ratio of Ag and Au were approximately same, the two LSPR bands at 395 nm and 495 nm were observed, which indicated that the gold ions were partially covered by AgNPs or there was a formation of independent nanoparticles.30,31 Owing to the continuous decrease of the concentration, i.e., the volume of Au seed, only one band appeared between 400 nm to 450 nm. This absorbance band can be ascribed to the Ag particles, which indicates the formation of homogeneously mixed composite nanoparticles of two metals without any considerable development of independent nanoparticles. As the volume of the Au seed colloid decreases, the plasmon band slowly red shifted. This suggested the formation of composite nanoparticles with a larger diameter.31 It may be inferred from the UV-vis spectra that the reduction of the Ag precursor alone occurs on the surface of the preformed AuNPs (Au core), and the Au-core/Ag-shell structured composite nanoparticles are formed. Thus, the optical properties of bimetallic nanoparticles are referred to the Ag shell, and the thickness of the Ag shell is gradually increased with decreasing volume of Au colloid.
Sample collection and preparation
The samples of lentils were purchased and collected from local markets of Raipur, Durg and Jashpur, Chhattisgarh, India. The samples were used for the analysis of L-cysteine. The sample preparation for the determination of the amino acid, i.e., L-cysteine, was pursued from the literature of Shrivas et al., 2018.21 First, the lentils were washed with water. Then, the washed lentil samples were dried in an oven at 50 °C to remove the moisture content. In the next step, the lentils were ground using a pestle and mortar into a fine powder and dissolved into 25 mL of warm water with stirring for 30 min. At last, the sample solutions were filtered using Whatman filter paper no. 42. The obtained filtrates were used for the determination of L-cysteine using Au–Ag core–shell composite nanoparticles as a plasmonic chemical probe.Procedure for L-cysteine detection using Au–Ag core–shell composite nanoparticles as a selective chemical probe/UV-vis spectroscopy
An aliquot of 1.5 mL from 1000 μg mL−1 of standard solution of L-cysteine or lentils samples were taken into a 5 mL glass vial. Then, 1.5 mL of Au-core/Ag-shell composite nanoparticles was added to the sample solution, and the pH of the solution was maintained at 6.0 with the help of 0.1 M HCl and 0.1 M NaOH solutions. Then, the mixture of solution was kept for 4 min reaction time at room temperature. The color changes and signal intensity of the LSPR band of the Au-core/Ag-shell composite nanoparticles with L-cysteine solution mixture were monitored using a UV-vis spectrophotometer in the range of 200–800 nm. The schematic procedure for the preparation of the Au–Ag core–shell composite nanoprobe and the detection of L-cysteine are shown in Fig. 4.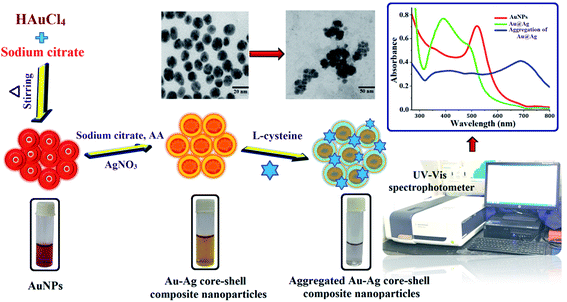 | ||
| Fig. 4 Schematic procedure for L-cysteine determination by Au–Ag core–shell composite nanoparticles as a selective chemical probe through UV-vis spectrophotometer. | ||
Results and discussion
Characterization of the Au–Ag core–shell composite nanoparticles
The UV-vis spectrophotometric technique was principally used for the characterization and quantification of Au–Ag core–shell composite nanoparticles by monitoring the LSPR absorption band through the color change. The dispersed and aggregated composite nanoparticles were also characterized by DLS and FTIR techniques. Fig. 5(a) shows the plasmonic resonance band of the Au–Ag core–shell composite nanoparticles in the UV-vis region. Herein, bands obtained at 395 nm and 495 nm correspond to Ag and Au, respectively, which confirms the formation of the metal–metal composite nanoparticles. The addition of L-cysteine into the Au–Ag core–shell composite nanoparticles caused the aggregation of particles, which resulted in a change in the solution color from yellowish brown to light blue, as shown in Fig. 5(b). When the citrate-functionalized core–shell composite nanoparticles are in contact with L-cysteine, the citrate molecules could be replaced by L-cysteine molecules and the aggregation event takes place. The LSPR absorption band of the composite nanoparticles was shifted to higher wavelength and formed a new plasmonic band. Appearance of this new plasmonic band in the UV-vis spectra could be attributed to the formation of the Au–Ag–cysteine complex as a result of the aggregation of particles (Fig. 5(b)).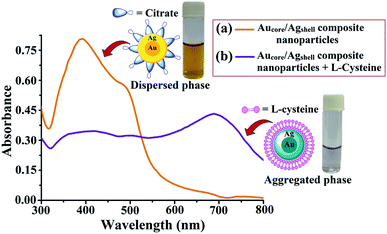 | ||
| Fig. 5 UV-vis spectra of (a) Au-core/Ag-shell composite nanoparticles and (b) Au-core/Ag-shell composite nanoparticles with L-cysteine. | ||
The elemental and structural compositions were investigated by EDX analysis. The results show that the composite nanoparticles were formed by Au and Ag metal ions. So, the result from the EDX spectrum, as illustrated in Fig. 6(a), indicates that gold particles were covered by a silver shell. Fig. 6(b) shows the TEM image of the prepared core–shell composite nanoparticles. The average particle size of the Au-core/Ag-shell composite nanoparticles is found to be spherical-shaped with an average size distribution of 20 nm. The presence of functional groups in the core–shell composite nanoparticles was determined by DRS-FTIR, and the result is given in Fig. 6(c). For this, the solution of the Au–Ag core–shell composite nanoparticles was mixed with IR substrate (i.e., KBr matrix) and the spectrum was recorded. The size of the prepared dispersed composite nanoparticles was also established by DLS technique. The average hydrodynamic diameter of the citrate-capped Au–Ag core–shell composite nanoparticles was 86 nm, confirming the excellent dispersion property of the composite nanoparticles in aqueous solution, as shown in Fig. 6(d). Herein, the results obtained strappingly suggested the formation of the Au–Ag core–shell composite nanoparticles as a chemical probe.
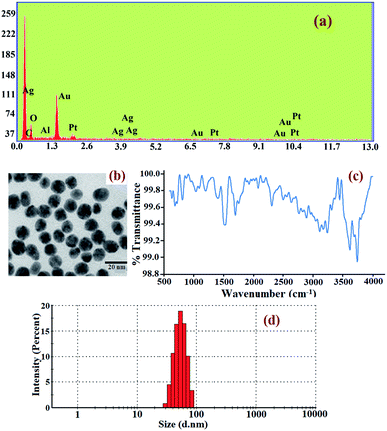 | ||
| Fig. 6 Characterization report of the Au–Ag core–shell composite nanoparticles: (a) EDX spectra, (b) TEM image, (c) FTIR spectra, (d) DLS spectra. | ||
DRS-FTIR spectral assignment of L-cysteine and the Au–Ag core–shell composite nanoparticles as a selective and sensitive plasmonic chemical probe
FTIR is a simple analytical technique used for the characterization and quality assurance of materials based on the functional group, chemical bonding and molecular structures of chemical substances. In previous years, co-workers have exploited the use of FTIR for qualitative and quantitative analyses of biological and food samples, and various ionic species in the environment, based on the measurement of the selected characteristic absorption peaks of the analyte in the IR spectra.32–35 In the present work, the preliminary investigations were performed with DRS-FTIR to determine the presence of the spectral bands of citrate-capped AuNPs and L-cysteine. Second, the freshly prepared standard solutions of dispersed and aggregated Au–Ag core–shell composite nanoparticles were analyzed to observe the characteristic IR absorption peaks of individual components, which were used to form bimetallic composite nanoparticles. Fig. 7 shows the IR spectra of citrate-capped AuNPs (a), AgNPs (b), L-cysteine (c), Au-core/Ag-shell composite nanoparticles (d), and aggregated Au–Ag core–shell composite nanoparticles with L-cysteine (e).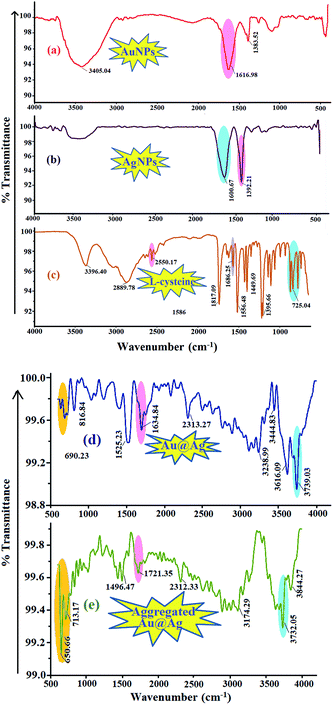 | ||
| Fig. 7 IR spectra of (a) AuNPs; (b) AgNPs; (c) L-cysteine; (d) Au-core/Ag-shell metal-composite nanoparticles, and (e) Au-core/Ag-shell metal-composite nanoparticles with L-cysteine. | ||
The citrate-capped AuNPs showed an absorption peak at 1616.98 cm−1 that corresponds to the C![[double bond, length as m-dash]](https://www.rsc.org/images/entities/char_e001.gif) O symmetric stretching mode, and a band at 1383.52 cm−1 that is assigned to the C–H stretching vibration (Fig. 7a). In the FTIR spectra, a wide band at 3405.04 cm−1 assigned to the O–H stretching proved the surface capping of tri-sodium citrate on AuNPs. Pure L-cysteine exhibited several infrared absorption peaks, attributed to different functional groups. A characteristic peak was obtained at 2550.17 cm−1 for the S–H group and 725 cm−1 for C–S. The peaks at 1686.25 cm−1 and 1395.66 cm−1 corresponded to the asymmetric and symmetric stretching vibrations of COO−, respectively. Exhibited peaks at 3396.40 cm−1 signified NH3+ stretching and its bending vibration at around 1556.48 cm−1. The IR spectra for the Au–Ag core–shell composite nanoparticles reveal peaks similar to those of the precursors that were used to make the composite nanoparticles. The spectra of the formation of the Au–Ag core–shell composite nanoparticles were confirmed using the literature.32,33,36 As shown in Fig. 7(e), after the addition of L-cysteine into the bimetallic composite nanoparticle solution, the slight changes were observed in the spectra. The decrease in the signal intensity and the shift of the IR peaks were observed for the solution mixture of the Au–Ag core–shell with L-cysteine compared to pure L-cysteine molecules, representing the interaction of L-cysteine with the composite nanoparticles. Significantly, the disappearance of a peak belonging to the S–H stretching vibration (2550.17 cm−1) and increased intensity in the C–S & NH3+ stretching vibration bands (650–713.17 cm−1 & 3732.05 cm−1) were induced by the addition of L-cysteine with the Au–Ag core–shell composite nanoparticles, indicating the Au–Ag–S interaction.
O symmetric stretching mode, and a band at 1383.52 cm−1 that is assigned to the C–H stretching vibration (Fig. 7a). In the FTIR spectra, a wide band at 3405.04 cm−1 assigned to the O–H stretching proved the surface capping of tri-sodium citrate on AuNPs. Pure L-cysteine exhibited several infrared absorption peaks, attributed to different functional groups. A characteristic peak was obtained at 2550.17 cm−1 for the S–H group and 725 cm−1 for C–S. The peaks at 1686.25 cm−1 and 1395.66 cm−1 corresponded to the asymmetric and symmetric stretching vibrations of COO−, respectively. Exhibited peaks at 3396.40 cm−1 signified NH3+ stretching and its bending vibration at around 1556.48 cm−1. The IR spectra for the Au–Ag core–shell composite nanoparticles reveal peaks similar to those of the precursors that were used to make the composite nanoparticles. The spectra of the formation of the Au–Ag core–shell composite nanoparticles were confirmed using the literature.32,33,36 As shown in Fig. 7(e), after the addition of L-cysteine into the bimetallic composite nanoparticle solution, the slight changes were observed in the spectra. The decrease in the signal intensity and the shift of the IR peaks were observed for the solution mixture of the Au–Ag core–shell with L-cysteine compared to pure L-cysteine molecules, representing the interaction of L-cysteine with the composite nanoparticles. Significantly, the disappearance of a peak belonging to the S–H stretching vibration (2550.17 cm−1) and increased intensity in the C–S & NH3+ stretching vibration bands (650–713.17 cm−1 & 3732.05 cm−1) were induced by the addition of L-cysteine with the Au–Ag core–shell composite nanoparticles, indicating the Au–Ag–S interaction.
Feasibility and screening of the proposed strategy for the selective determination of L-cysteine
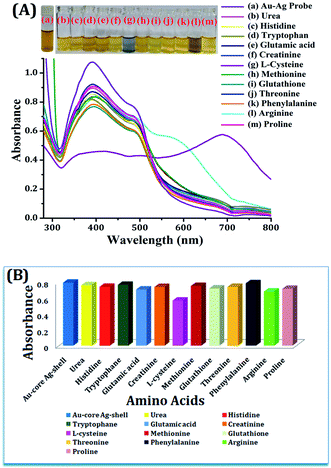
For the selective determination of L-cysteine, a series of experiments were performed towards the feasibility of the proposed method. Different amino acids (urea, histidine, tryptophan, glutamic acid, creatinine, L-cysteine, methionine, glutathione, threonine, phenylalanine, arginine and proline) were chosen for screening for the selective detection of a particular amino acid, i.e., L-cysteine, from a standard sample solution using Au–Ag core–shell composite nanoparticles as a plasmonic chemical probe in the UV-vis region. For this, equal volumes of different amino acid standard solutions and Au–Ag core–shell composite nanoparticles were taken in separate glass vials, and kept for 4 min reaction time at room temperature. The Au–Ag core–shell composite nanoparticles with L-cysteine shows the color alteration from yellowish brown to light blue, as shown in Fig. 8. The color change of the Au–Ag core–shell composite nanoparticles with L-cysteine was verified by recording the UV-vis spectra. Broad LSPR bands were obtained with lower absorption at a wavelength of approximately 400 nm and a higher red-shifted band at 685 nm, as shown in Fig. 8. However, there were no changes in color via absorption spectrum of other amino acids (urea, histidine, tryptophan, glutamic acid, creatinine, methionine, glutathione, threonine, phenylalanine, arginine and proline) with Au–Ag core–shell composite nanoparticles at the optimized conditions. They exhibited a similar LSPR absorption peak at 395 nm and 495 nm as the Au–Ag core–shell composite nanoparticles, shown in Fig. 8. The color changed from yellowish brown to light blue, and the appearance of a new LSPR absorption band was due to the aggregation of dispersed core–shell composite nanoparticles caused by the addition of the analyte, i.e., L-cysteine. This involves the interaction of our prepared core–shell composite nanoparticles with the analyte, followed by the complexation reaction. Thus, the prepared Au–Ag core–shell composite nanoparticles were used as a colorimetric sensing probe for the determination of L-cysteine in food samples.On the other hand, in the presence of L-cysteine, the average hydrodynamic diameter of the Au–Ag core–shell composite nanoparticles resulted in enhancement in the size of the composite nanoparticles from 20 to 50 nm (Fig. 9a). Furthermore, from the DLS study, the average hydrodynamic diameter of the Au–Ag core–shell composite nanoparticles resulted in a five-fold enhancement in the size of the composite nanoparticles (i.e., 436 nm) in the presence of L-cysteine caused by aggregation, as shown in Fig. 9(b).
Sensing mechanism of the Au–Ag core–shell composite nanoparticles as a plasmonic chemical probe
The core–shell composite nanoparticles were prepared by seed colloid method (reduction of Ag salt on the preformed Au core surface), for which LSPR absorption bands were obtained at 395 nm and a shoulder peak appeared at 495 nm, corresponding to the Ag shell and Au core. The preformed citrate-capped gold nanoparticles showed a deep red color because of the monodispersity of the nanoparticles in aqueous solution, and gave a plasmonic absorption band at 520 nm. The monodispersed metallic composite nanoparticles (Au/Ag) exhibited a yellowish brown color because of the reduction of the Ag salt on the surface of the Au seed. Hence, the heavy thickness of the Ag shell on the surface of Au furnished the optical property of the composite nanoparticles. The citrate molecules over the surface of the bimetallic nanoparticles protect them from self-aggregation in aqueous solution due to steric hindrance and also support the binding of its carboxyl groups, resulting in repulsion between the bimetallic nanoparticles.21,23,36 However, the addition of L-cysteine to the Au–Ag core–shell composite nanoparticles caused the color change from yellowish brown to light blue, and causes the broadening of SPR in the UV-vis region, as shown in Fig. 5(b). This is due to the replacement of the citrate capping groups from the surface of the bimetallic nanoparticles by L-cysteine, which possesses a sulphur atom having the affinity towards the metal composite (Au–Ag). On the other hand, no evidential color alteration or intense shift of LSPR of the Au–Ag core–shell composite nanoparticles with other amino acids (i.e., urea, histidine, tryptophan, glutamic acid, creatinine, methionine, glutathione, threonine, phenylalanine, arginine and proline) was observed. This interaction is based on the affinity of the metal (Au and Ag; soft lewis acid) having greater polarizability with different donor atoms in the order of S > N > O,23,37,38 which follows the theory of hard and soft acids and bases via donor–acceptor phenomena. These types of hypotheses had also been demonstrated by several researchers.16,37,39 The complete replacement of the citrate molecules by cysteine groups from the surface of the bimetallic nanoparticles resulted in the solution color changes from yellowish brown to light blue and later colorless, following the increasing degree of nanoparticle aggregation. This premise confirmed the reaction and complexation between the Au–Ag core–shell composite nanoparticles and L-cysteine. The schematic mechanism for the selective detection of L-cysteine using Au–Ag core–shell composite nanoparticles as a plasmonic chemical probe is represented in Fig. 10.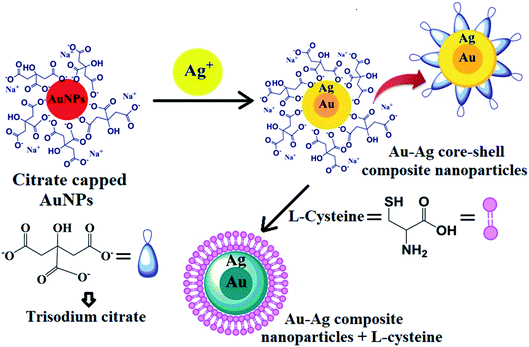 | ||
| Fig. 10 Schematic diagram to show the detection mechanism of L-cysteine with the Au–Ag core–shell composite nanoparticles. | ||
Optimization of the proposed method for L-cysteine detection employing Au–Ag core–shell composite nanoparticles as a plasmonic chemical probe
For the optimum detection of L-cysteine from a sample solution using the Au–Ag core–shell composite nanoparticles as a plasmonic chemical probe, important analytical parameters such as the pH, concentration of analyte and the reaction time were studied. For this, different concentrations of L-cysteine (20, 40, 60, 80, 100, 120 and 140 μg mL−1) were added to the Au–Ag core–shell composite nanoparticles and kept at room temperature for 4 min reaction time. As shown in Fig. 11, the curve is plotted between the signal intensity and different concentrations of L-cysteine. Herein, a red shift of the LSPR absorption band is observed at 685 nm as the concentration of L-cysteine is increased. Similarly, with changes in the reaction time, the red shift of LSPR band was observed. The effect of the reaction time upon our colorimetric probe is shown in Fig. 11(a). This confirms the strong interaction between the molecules of the prepared probe (citrate-capped Au–Ag core–shell composite nanoparticles) and L-cysteine.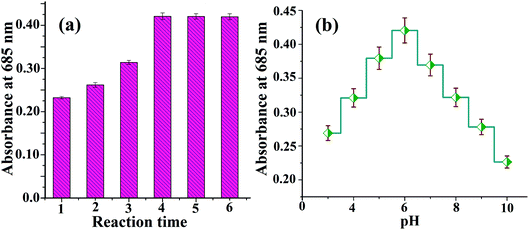 | ||
| Fig. 11 (a) Effect of the reaction time and (b) effect of pH upon the interaction of the Au–Ag core–shell composite nanoparticles with L-cysteine. | ||
Determination of the pH value of the sample solution is an important optimization parameter for a sensing system. The different pH values of the sample solution, ranging from 3 to 10, have been studied for optimization of the proposed method. Fig. 11(b) demonstrates the signal intensity of L-cysteine with Au–Ag core–shell composite nanoparticles at different pH values. The appearance of an absorption peak at pH 6 corroborates that the probe interacts highly with the targeted analyte at this pH for the experimental condition. Hence, the proposed probe is highly selective for the determination of L-cysteine in the lentils samples.
Statistical evaluation for the determination of L-cysteine
Under the optimal conditions, a series of quantitative parameters, including the limit of detection (LOD), limit of quantification (LOQ), linearity range, recovery, recovery%, relative standard deviation (RSD)% and correlation coefficient (R2), for the determination of L-cysteine were studied to validate the newly developed method. The linearity range for estimating the L-cysteine was carried out by spiking different concentrations of L-cysteine (20, 40, 60, 80, 100, 120 and 140 μg mL−1) in different glass vials containing Au–Ag core–shell composite nanoparticles, and the mixture of solutions was maintained at pH 6.0 and kept for 4 min reaction time at room temperature. The intensity of color of the solutions was measured using a UV-vis spectrophotometer. It was observed that the signal intensities of the LSPR bands were decreased at wavelengths of 395 nm and 495 nm and increased at 685 nm, while increasing the concentration of L-cysteine in the sample solution. With the help of absorbance values (appearing at 685 nm) against different concentrations of L-cysteine ranging from 20 to 140 μg mL−1, the calibration curve was constructed. The straight line was observed in the range from 20 to 140 μg mL−1 with a correlation coefficient (R2) of 0.986, as shown in Fig. 12. The LOD and LOQ were determined by spiking the minimum quantity of L-cysteine into the bimetallic composite nanoparticle solution. The LOD was calculated by using three times of the standard deviation with the slope of the curve (i.e., 3σ/slope), and LOQ was determined at 10 times of the standard deviation with the slope obtained from the calibration curve (i.e., 10σ/slope). The values of LOD and LOQ for the present method were calculated to be 1.95–2.0 and 6.5 μg mL−1, respectively. Furthermore, the precision of the method was justified by calculating the RSD percentage for four successive analyses of the sample under the optimized conditions. The RSD% for L-cysteine determination was found to be 3.9–4.0% (Table 1), showing a good precision of our proposed method. As biomolecules are soluble in water, no extracting solvent or buffer solution has been used since negative and positive experiments have not been included. An advanced method for the extraction of biomolecules based on the physico-chemical adsorption of biomolecules on the surface of the bimetallic nanoparticles has been developed that does not involve any toxic solvents.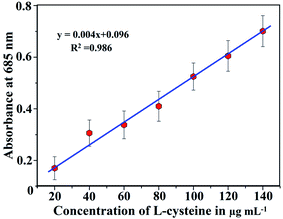 | ||
| Fig. 12 Standard calibration curve for the determination of L-cysteine (20–140 μg mL−1) using Au–Ag core–shell composite nanoparticles. | ||
| S. no. | Statistical parameters | Values obtained |
|---|---|---|
| 1. | Linear range (μg mL−1) | 20 to 140 |
| 2. | Limit of detection (LOD), μg mL−1 | 2.0 |
| 3. | Limit of quantification (LOQ), μg mL−1 | 6.5 |
| 4. | RSD (%) | 4.0 |
| 5. | Correlation coefficient (R2) | 0.986 |
| 6. | Recovery (%) | 98.8 |
Application of the Au–Ag core–shell composite nanoparticles as a plasmonic chemical probe for L-cysteine detection in lentils
Lentils naturally contain essential vitamins, proteins (amino acids) and other nutrients. Several detection works have been already done earlier for the abovementioned nutrients. The newly developed Au–Ag core–shell composite nanoparticles were applied as one of the easiest and low-cost detection probes for the determination of L-cysteine in 3 different lentil samples obtained from different places of Chhattisgarh, India. For this, aliquots of prepared food samples (1.5 mL) were taken into a 5 mL glass vial with the addition of 1.5 mL of Au–Ag core–shell composite nanoparticles at pH 6. The solution mixture was kept at room temperature for 4 min reaction time. After that, the solution mixture was directly used for colorimetric analyses. The LSPR absorption band obtained at a wavelength of 685 nm in colorimetric analysis was used for the determination of L-cysteine from the lentils samples. The colour of the metal–metal composite nanoparticles solution clearly changed upon the mixing of the pre-treated lentils sample solution with different dilution ratios. The red shift of the LSPR absorption peak occurred at 685 nm with a decrease of the absorption band of Au–Ag due to aggregation of the Au–Ag core–shell composite nanoparticles, and the same changes were observed in the intensities for different L-cysteine spiked lentils samples. Hence, the red-shifted absorption was used to calculate the concentration of L-cysteine using the linear least square equation. The recovery percentage for the determination of L-cysteine was calculated using the amount of analyte added (spiked) in the actual food samples. A good recovery percentage from 95.8–98.8% was found for different lentils samples using Au–Ag core–shell composite nanoparticles (Table 2), which showed the remarkable selectivity of this proposed colorimetric probe for target analyte detection.| S. no. | Lentils sample | Added L-cysteine (μg mL−1) | Recovered (μg mL−1) | RSD (%) (n = 4) | Recovery (%) |
|---|---|---|---|---|---|
| 1. | Raipur | — | 19.3 ± 0.3 | 1.4 | — |
| 50 | 67.6 | — | 96.6 | ||
| 100 | 118.1 | — | 98.8 | ||
| 2. | Durg | — | 17.8 ± 0.4 | 2.23 | — |
| 50 | 65.7 | — | 95.8 | ||
| 100 | 116.48 | — | 98.6 | ||
| 3. | Jashpur | — | 21.2 ± 0.8 | 3.9 | — |
| 50 | 69.3 | — | 96.2 | ||
| 100 | 118.8 | — | 97.8 |
Comparison of the proposed method with other reported methods
The potentiality of newly developed noble Au–Ag core–shell composite nanoparticles as a plasmonic chemical sensor is compared with other reported methods in terms of the linearity range and LOD for the determination of L-cysteine in different food and real samples, as shown in Table 3. The linearity range and LOD obtained by the present proposed method is found to be good compared to the other reported methods. The earlier reported methods have disadvantages, including an extensive extraction process, as well as the use of expensive chemicals/solvents, trained personnel and sophisticated instrumentation techniques. Thus, as shown in the table, the proposed method is simple, highly selective and sensitive, a single-step process and mainly cost-effective as compared to other methods for L-cysteine determination in food and other real samples.| Analytical technique | Assisted probe | Recognition sample | Linearity range (μg ml−1) | LOD (μg ml−1) | Recovery (%) | References |
|---|---|---|---|---|---|---|
| a Not detected.b Copper-oxide/boron nitride/glassy carbon electrode.c Cadmium tellurium quantum dots. | ||||||
| Spectrophotometry | AgNPs | Blood plasma | 0.388–0.997 | 0.339 | 94–104 | 4 |
| Cyclic voltammetry | AuNPs/Mn-porphyrin | Human serum | 50–1000 | 0.27 | 99–100 | 40 |
| Fluorescence spectrometry | Au–Ag nano-spheres and metal organic framework | Hela cell; human serum | 0–3.877; 0–12.12 | 0.242; 0.121 | aND | 41 |
| Cyclic voltammetry | bCuO/BN/GCE | Human blood serum | 0.121–1.212 | 0.071 | 97–101 | 42 |
| Electrochemiluminescence | Water-soluble cCdTe QDs | Milk and water | 1.575–42.406 | 0.105 | 92–101 | 43 |
| Colorimetry | Au–Ag core–shell composite nanoparticles | Lentils samples | 20–140 | 1.95 | 96–99 | Present method |
Conclusion
In this present experimental work, we have demonstrated the Au–Ag core–shell composite nanoparticles as a plasmonic chemical probe that can be applied for the selective and sensitive detection of L-cysteine in lentils samples. The applied chemical probe is based on the self-induced aggregation of nanoparticles due to the strong affinity of Au–Ag composite nanoparticles along with L-cysteine. This shows a remarkable improvement of the signal intensity at 685 nm via shifting of the absorption band towards higher wavelength. The μg mL−1 concentration of L-cysteine can be easily detected by naked eyes using Au–Ag core–shell composite nanoparticles. This is due to the prominent alteration of color of the solution before and after the addition of the analyte. The proposed sensing probe also demonstrated its selectiveness for L-cysteine in the presence of other amino acids. This Au–Ag based chemical sensor is found to be cost-effective, rapid, easy synthesis, easy to operate, relatively simple and selective, as compared to other metallic nanoparticles and conventional instrumental methods. As a future work, this Au–Ag based probe would be highly useful for the detection of L-cysteine in biological samples, such as blood plasma and urine. Since the proposed method does not demand any toxic reagents and solvents during the study, it can thus be mentioned as a “green analytical approach”.Conflicts of interest
The authors have no known competing financial interests.Acknowledgements
The authors would like to acknowledge UGC-SAP [No. F-540/7/DRS-II/2016 (SAP-I)] and SERB-DST [SR/S1/IC-05/2012] for the financial support for purchasing chemicals and providing instrumental facilities. One of the authors (Anushree Saha) is also thankful to Pt. Ravishankar Shukla University, Raipur, C. G., India for providing a university scholarship under the VR. No. 49/Fin./Sch./2020.References
- A. Zivkovic, J. J. Bandolik, A. J. Skerhut, C. Coesfeld, N. Zivkovic and M. Raos, J. Chem. Educ., 2017, 94(1), 115–120 CrossRef CAS.
- J. Wang, H. Wang, Y. Hao, S. Yang, H. Tian, B. Sun and Y. Liu, Food Chem., 2018, 262, 67–71 CrossRef CAS PubMed.
- N. Cebi, C. E. Dogan, A. Develioglu, M. E. A. Yayla and O. Sagdic, Food Chem., 2017, 228, 116–124 CrossRef CAS PubMed.
- F. Bamdad, F. Khorram, M. Samet, K. Bamdad, M. R. Sangi and F. Allahbakhshi, Spectrochim. Acta, Part A, 2016, 161, 52–57 CrossRef CAS PubMed.
- P. Rezanka, J. Koktan, H. Rezankova, P. Matejka and V. Kral, Colloids Surf., A, 2013, 436, 961–966 CrossRef CAS.
- A. Ravindran, V. Mani, N. Chandrasekaran and A. Mukherjee, Talanta, 2011, 85(1), 533–540 CrossRef CAS PubMed.
- B. G. Swanson, J. Am. Oil Chem. Soc., 1990, 67(5), 276–280 CrossRef CAS.
- L. N. Zhang, Y. J. Sun, S. Pan, J. X. Li, Y. E. Qu, Y. Li, Y. L. Wang and Z. B. Gao, Fundam. Clin. Pharmacol., 2013, 27(1), 96–103 CrossRef CAS PubMed.
- A. A. Ensafi, B. Rezaei and S. Nouroozi, J. Braz. Chem. Soc., 2009, 20(2), 288–293 CrossRef CAS.
- G. Chwatko and E. Bald, Talanta, 2000, 52(3), 509–515 CrossRef CAS PubMed.
- L. Nie, H. Ma, M. Sun, X. Li, M. Su and S. Liang, Talanta, 2003, 59(5), 959–964 CrossRef CAS PubMed.
- W. Jian, M. Yao, D. Zhang and M. Zhu, Chem. Res. Toxicol., 2009, 22(7), 1246–1255 Search PubMed.
- M. Nidya, M. Umadevi and B. J. Rajkumar, Spectrochim. Acta, Part A, 2014, 133, 265–271 CrossRef CAS PubMed.
- Y. Tao, X. Zhang, J. Wang, X. Wang and N. Yang, J. Electroanal. Chem., 2012, 674, 65–70 CrossRef CAS.
- T. Bai, P. Lu, K. Zhang, P. Zhou, Y. Liu, Z. Guo and X. Lu, J. Biomed. Nanotechnol., 2017, 13, 1178–1209 CrossRef CAS.
- Y. Wang, P. Zhang, X. Mao, W. Fu and C. Liu, Sens. Actuators, B, 2016, 231, 95–101 CrossRef CAS.
- S. Naqvi, H. Anwer, S. W. Ahmed, A. Siddiqui, M. R. Shah, S. Khaliq, A. Ahmed and S. A. Ali, Spectrochim. Acta, Part A, 2020, 229, 118002 CrossRef CAS PubMed.
- D. Rohilla, S. Chaudhary, N. Kaur and A. Shanavas, Mater. Sci. Eng., C, 2020, 110, 110724 CrossRef CAS PubMed.
- J. Zhou and B. Tang, In situ Characterization Techniques for Nanomaterials, Springer, Berlin, Heidelberg, 2018, pp. 107–157 Search PubMed.
- J. Z. Zhang and C. Noguez, Plasmonics, 2008, 3(4), 127–150 CrossRef CAS.
- K. Shrivas, N. Nirmalkar, S. S. Thakur, M. K. Deb, S. S. Shinde and R. Shankar, Food Chem., 2018, 250, 14–21 CrossRef CAS PubMed.
- K. C. Noh, Y. S. Nam, H. J. Lee and K. B. Lee, Analyst, 2016, 140(24), 8209–8216 RSC.
- M. Rani, L. Moudgil, B. Singh, A. Kaushal, A. Mittal, G. S. S. Saini, S. K. Tripathi, G. Singh and A. Kaura, RSC Adv., 2016, 6(21), 17373–17383 RSC.
- G. Darabdhara, B. Sharma, M. R. Das, R. Boukherroub and S. Szunerits, Sens. Actuators, B, 2017, 238, 842–851 CrossRef CAS.
- K. Farhadi, M. Forough, A. Pourhossein and R. Molaei, Sens. Actuators, B, 2014, 202, 993–1001 CrossRef CAS.
- L. Pei, Y. Li, C. Huang, Y. Zhang, B. A. Rasco and K. Lai, J. Nanomater., 2014, 2014, 730915 Search PubMed.
- N. Moghimi, M. Mohapatra and K. T. Leung, Anal. Chem., 2015, 87(11), 5546–5552 CrossRef CAS PubMed.
- L. Sciortino, F. Giannici, A. Martorana, A. M. Ruggirello, V. T. Liveri, G. Portale, M. P. Casaletto and A. Longo, J. Phys. Chem. C, 2011, 115(14), 6360–6366 CrossRef CAS.
- Y. Yang, S. Matsubara, M. Nogami, J. Shi and W. Huang, Nanotechnology, 2006, 17(11), 2821 CrossRef CAS.
- Y. Yang, J. Shi, G. Kawamura and M. Nogami, Scr. Mater., 2008, 58(10), 862–865 CrossRef CAS.
- S. Pande, S. K. Ghosh, S. Praharaj, S. Panigrahi, S. Basu, S. Jana, A. Pal, T. Tsukuda and T. Pal, J. Phys. Chem. C, 2007, 111(29), 10806–10813 CrossRef CAS.
- B. R. Khalkho, R. Kurrey, M. K. Deb, I. Karbhal, B. Sahu, S. Sinha, Y. K. Sahu and V. K. Jain, New J. Chem., 2021, 45(3), 1339–1354 RSC.
- R. Kurrey, M. K. Deb, K. Shrivas, J. Nirmalkar, B. K. Sen, M. Mahilang and V. K. Jain, RSC Adv., 2020, 10(66), 40428–40441 RSC.
- J. Li, B. Zheng, Q. W. Zhang, Y. Liu, C. F. Shi, F. B. Wang, K. Wang and X. H. Xia, J. Anal. Test., 2017, 1(1), 8 CrossRef.
- S. Tiwari, M. K. Deb and B. K. Sen, Food Chem., 2017, 221, 47–53 CrossRef CAS PubMed.
- S. Sahu, S. Sharma and K. K. Ghosh, New J. Chem., 2020, 44(35), 15010–15017 RSC.
- S. Nath, S. K. Ghosh, S. Kundu, S. Praharaj, S. Panigrahi and T. Pal, J. Nanopart. Res., 2006, 8(1), 111–116 CrossRef CAS.
- N. E. Motl, A. F. Smith, C. J. DeSantis and S. E. Skrabalak, Chem. Soc. Rev., 2014, 43(11), 3823–3834 RSC.
- K. Shrivas, N. Nirmalkar, S. S. Thakur, R. Kurrey, D. Sinha and R. Shankar, RSC Adv., 2018, 8(43), 24328–24337 RSC.
- L. Hua, H. Han and X. Zhang, Talanta, 2009, 77(5), 1654–1659 CrossRef CAS PubMed.
- Y. Cai, Y. Hua, M. Yin, H. Liu, S. Li, F. Wang and H. Wang, Sens. Actuators, B, 2020, 302, 127198 CrossRef CAS.
- R. Jerome, P. V. Keerthivasan, N. Murugan, N. R. Devi and A. K. Sundramoorthy, ChemistrySelect, 2020, 5(29), 9111–9118 CrossRef CAS.
- J. Wang, H. Wang, Y. Hao, S. Yang, H. Tian, B. Sun and Y. Liu, Food Chem., 2018, 262, 67–71 CrossRef CAS PubMed.
| This journal is © The Royal Society of Chemistry 2021 |

