 Open Access Article
Performance of gamma-Al2O3 decorated with potassium salts in the removal of CS2 from C5 cracked distillate
Xiance Zhang a,
Guanglin Zhou*a,
Mengying Wangb,
Xiaosheng Wang
 a,
Weili Jianga and
Hongjun Zhoua
aCollege of New Energy and Materials, China University of Petroleum-Beijing, Beijing, 102249, China. E-mail: zhouguanglin2@163.com
bCollege of Chemical Engineering and Environment, China University of Petroleum-Beijing, Beijing, 102249, China
First published on 23rd April 2021
Abstract
Deep desulfurization is a key process for the production of high value-added products from C5 distillates. In this work, different potassium salt modified gamma-Al2O3 adsorbents were prepared by an incipient-wetness impregnation method and characterized by N2 adsorption–desorption, SEM-EDS, TEM, CO2-TPD, XRD, FT-IR, and IC. The C5 distillate with a 1200 μg mL−1 sulfur content is desulfurized to less than 10 μg mL−1 within 24 hours by the static adsorption method. For the desulfurization in the fix-bed reactor, the breakthrough sulfur capacity of K2CO3-decorated gamma-Al2O3 reaches 0.76 wt% under the optimized conditions, viz., at 30 °C, with a sulfur content of 50 μg mL−1 in the raw oil, and a liquid hourly space velocity of 1 h−1. The desulfurization activity of the exhausted adsorbent can be recovered after regeneration. Selective adsorption of CS2 includes three processes: adsorption, hydrolysis, and oxidation. CS2 is first adsorbed on the adsorbent and hydrolyzed to form H2S. H2S is further oxidized to form S/SO42−, and then deposits on the surface of the adsorbent. Adsorption, hydrolysis, and oxidation all play essential roles in the removal process of CS2.
1 Introduction
C5 distillate is one of the by-products of high-temperature cracking of naphtha to ethylene.1 Its yield is generally about 14–20% that of ethylene. C5 contains nearly 20 kinds of compounds, including isoprene, cyclopentadiene, and piperylene.2 Their unique molecular structures can be used to synthesize other chemical products, which have high economic value.3 In the petrochemical industry, two technologies are commonly used to treat the C5: one method is to separate it into monomers; another way is to use it as a raw material for producing low-carbon olefins after hydrogenation.The sulfur composition of C5 is different compared with other distillates. When naphtha is cracked to ethylene, it is easy to coke due to the high temperature during the pyrolysis process, which affects the product quality. Salari et al.4 found that different types of sulfides have different effects on coking performance. At a certain sulfur content, the coking rate is as follows: dimethyl disulfide (DMDS) < disulfide oil < dimethyl sulfide < CS2. To reduce the amount of coke and prolong the cracking furnace operating cycle, DMDS and CS2 are selected as coking inhibitors to reduce the coking rate in the industrial production process. Therefore, the main sulfide in the C5 is CS2, with a small number of other sulfides such as thioether, mercaptan, and thiophene. The existence of sulfur compounds greatly impacts the physical properties of catalysts, additives, and products, as well as the processing stability and the value of the products. Although the sulfur content of C5 varies (often in the range of 40–100 μg mL−1) from different manufacturers, the main sulfide is always CS2.
In traditional desulfurization technology, the more mature hydrodesulfurization technology results in unnecessary olefin saturation, excessive sulfur species,5 which is not suitable for the C5. Compared with traditional hydrogen desulfurization, adsorption desulfurization has the advantages of a short process, low energy consumption, and no hydrogen required.6–8 However, the C5 adsorption desulfurization has not achieved large-scale industrialization due to the insufficient experimental data and unclear desulfurization mechanism. Patent CN101450303A9 reported a method of adsorbents preparation, they mixed group 8 and group 11 metal salts with sodium hydroxide as the precipitant in an aprotic solvent, then mixed with the Al2O3 dry glue to obtain the adsorbent. Under certain conditions, the adsorbent could remove almost all sulfide in C5 conjugated diene raw materials. However, this desulfurization process requires hydrogen and a higher operating temperature, which leads to the saturation and polymerization of C5 olefin. Patent CN103182291A10 used the pseudo-boehmite powder to prepare gamma-Al2O3 support and then impregnated a mixed solution of Zn2+, Cu2+, group 1, or group 2 metal to obtain a desulfurization adsorbent. The desulfurization of the cracked C5 using a fixed bed can reduce the sulfur content to 1 μg g−1 or lower. However, the adsorbent sulfur capacity is low, and regeneration is difficult.
The methane reaction with sulfur and hydrogen sulfide is considered the leading cause of undesirable CS2 in the modified Claus process.11 A highly efficient hydrolysis catalyst is required to remove CS2 and COS. The reactions of CS2 hydrolysis are as follows:12 CS2 + H2O → COS + H2S, COS + H2O → CO2 + H2S, CS2 + 2H2O → CO2 + 2H2S. The C5 contains a trace amount of water, and the hydrolysis reaction of CS2 may occur. Therefore, using a hydrolysis catalyst to remove CS2 from the C5 would be an effective method.13,14 In this paper, the gamma-Al2O3 support is loaded with different potassium salts by an incipient-wetness impregnation method. The C5 distillate is used as raw material. Static adsorption experiments and fixed bed dynamic experiments are carried out to study the adsorption performance of the modified adsorbent on CS2. Furthermore, the desulfurization mechanism is investigated by N2 adsorption–desorption, SEM-EDS, TEM, XRD, CO2-TPD, FT-IR, and IC.
2 Results and discussion
2.1 Performance of catalysts in static experiments
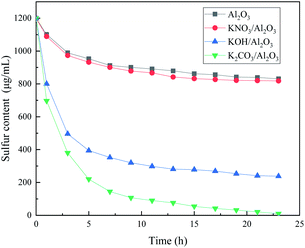
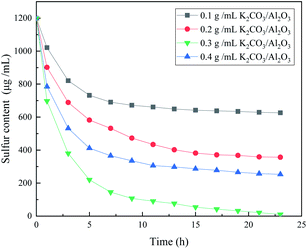
Fig. 1 shows the desulfurization performance of gamma-Al2O3 adsorbents decorated by three different potassium salt solutions. The Al2O3 can remove the CS2 in C5, and the sulfur content in C5 is 989 μg mL−1 after 3 hours. After the calcination at 500 °C, the KNO3 in the KNO3/Al2O3 catalyst decomposes into K2O and form an Al–O–K structure with Al2O3.15 However, the adsorption desulfurization ability of KNO3/Al2O3 is slightly improved, only 16 μg mL−1 higher after 3 hours. The KOH/Al2O3 and K2CO3/Al2O3 improve the adsorption and desulfurization ability of the Al2O3 support significantly, indicating that the alkaline has good selective adsorption for CS2. The modified Al2O3 is more alkaline than Al2O3, which corresponds to the subsequent CO2-TPD characterization. The desulfurization effect of K2CO3/Al2O3 is better than that of KOH/Al2O3. When the adsorption time is 3 hours, the sulfur content in the product is 412 μg mL−1 and 496 μg mL−1, respectively. The cause of this phenomenon is analyzed in the next section.Fig. 2 shows the effect of adsorbents prepared by different concentrations of K2CO3 on the removal performance of CS2. The desulfurization capacity gradually increases with the increase of K2CO3 impregnation concentration. When the impregnation concentration of K2CO3 is 0.3 g mL−1, the static desulfurization performance is the greatest, and the sulfur content in C5 can be reduced to less than 10 μg mL−1 from 1200 μg mL; however, continue increasing the impregnation concentration K2CO3 results in decreasing of the desulfurization capacity. This indicates that the amount of alkali has a significant influence on the desulfurization activity. The loading of K2CO3 affects the alkalinity of the adsorbent surface and the distribution of basic sites in the desulfurizer. The weak base center on the surface of adsorbent is more critical, and the strong alkalinity is not conducive to the adsorption of CS2. Excessive alkalinity causes irreversible adsorption of CS2 and intermediate formation (i.e., H2S and S) in the adsorbent,16 covering the active sites, which is why the same loading amount of KOH is not as good as K2CO3. Consequently, the experimental K2CO3 immersion concentration is determined as 0.3 g mL−1. These results indicate that OH− on the adsorbent plays a vital role in the adsorption activity.
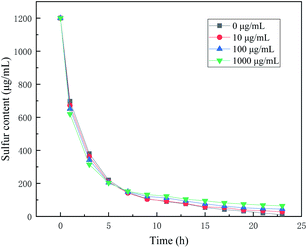
The C5 component contains round 80 μg mL−1 of water, so we used the 0.3 g mL−1 K2CO3/Al2O3 catalyst to investigate the influence of water. In Fig. 3, as the concentration of added water increases, the initial desulfurization rate gradually increases, which shows that the addition of water promotes the hydrolysis rate of CS2. However, with the further progress of desulfurization, CS2 the final desulfurization result decreases with added water. The water may compete with CS2 for adsorption, resulting in the weakening of the adsorption capacity of CS2.17 The increase in water is also beneficial to the oxidation rate. Primavera et al.18 believed that water plays an essential role in the oxidation of H2S. The increase of water content can promote the deposition of sulfur products on the catalyst, resulting in an increasing deactivation rate. As the addition of water increases, the water cannot dissolve thoroughly in the C5, resulting in the separation of oil and water. Therefore, the addition of water cannot improve the performance of the catalyst but reduce the quality of the products.
2.2 Performance of catalysts in fixed-bed reactor
In order to investigate the effect of reaction conditions on the adsorption performance of modified Al2O3, the fixed bed was used to study the dynamic adsorption performance of 0.3 g mL−1 K2CO3/Al2O3 catalyst. Fig. 4 shows the effect of (a) sulfur contents, (b) LSHVs, and (c) reaction temperature on the adsorption desulfurization performance in the dynamic desulfurization process of C5 distillate.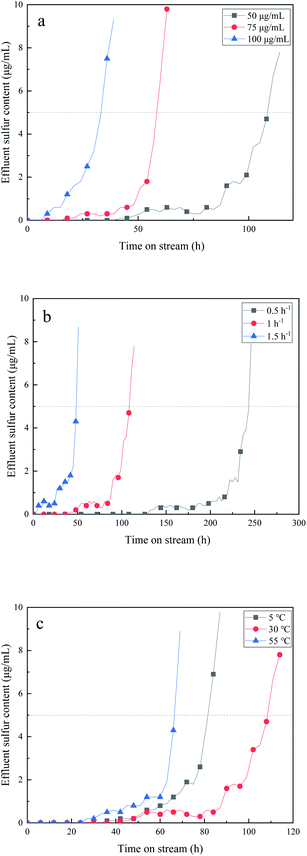 | ||
| Fig. 4 Effect of (a) sulfur content of raw materials, (b) LHSV, and (c) temperature on removal performance of CS2. | ||
Sulfur content is one of the most important factors affecting the desulfurization capacity of the adsorbent. When the raw material sulfur content is 50, 75, and 100 μg mL−1, the breakthrough sulfur capacity is 0.76 wt%, 0.60 wt%, and 0.46 wt%, respectively. The increase in the sulfur content of C5 means that H2S generation increases, which also causes an increase in oxidation products of S and sulfate. The corresponding sulfur products deposit on the surface of the adsorbent, cover the active sites, and hinder the conversion of CS2. Therefore, the increase of sulfur content in C5 leads to the decrease of the adsorption desulfurization performance of the adsorbent.
The prepared K2CO3/Al2O3 adsorbent is used to investigate the effect of different LHSVs on the desulfurization performance of the adsorbents at room temperature. Fig. 4(b) shows that the adsorption capacity of the adsorbent for CS2 gradually decreases as the space velocity increases. When the space velocity is 0.5, 1.0, and 1.5 h−1, the breakthrough sulfur content is 0.86 wt%, 0.76 wt%, and 0.50 wt%, respectively. When the feedstock feed amount is low, the CS2 molecule in the C5 oil has a longer residence time on the surface of the adsorbent, which can promote its adsorption and diffusion process. So, the adsorption performance is better at low space velocity. However, when the space velocity is 0.5 h−1, the amount of raw material oil processed per unit time is too small to meet industrial demand. When the space velocity is too high, the contact time between CS2 and the surface of the adsorbent is shortened, which is not conducive to the adsorption desulfurization process of the adsorbent. Therefore, it is most suitable for industrial applications when the space velocity is 1.0 h−1.
The prepared 0.3 g mL−1 K2CO3/Al2O3 adsorbent is applied to examine the effect of different adsorption temperatures on the desulfurization performance of the adsorbent at an adsorption LSHV of 1.0 h−1. The influence of temperature on the desulfurization effect is shown in Fig. 4(c). This experiment selects a temperature range of 5–55 °C. At 5 °C, the breakthrough sulfur capacity is 0.57 wt%. It is because the hydrolysis reaction rate of CS2 in C5 is low at a relatively lower temperature, resulting in poor desulfurization activity of the adsorbent. With the increase of temperature, the hydrolysis rate increases, and the reaction is more likely to occur. Besides, high temperature also favors the oxidation of H2S, facilitating the next reaction. When the temperature is 30 °C, the breakthrough sulfur capacity is 0.76 wt%, and the desulfurization effect is best. The increase in the temperature leads to a gradual rise of SO42−/S ratio.19 Sulfate is formed more rapidly, causing catalyst poisoning and inhibiting the progress of the hydrolysis reaction. When the temperature is 55 °C, the breakthrough sulfur capacity of the adsorbent is 0.47 wt%, which is not suitable for the desulfurization of C5. Besides, the product begins to turn yellow at 55 °C, indicating that the product has been aggregated, thus affecting desulfurization activity and product quality.
2.3 Evaluation of regeneration performance of adsorbents
The performance evaluation of regenerated adsorbents is carried out in a fixed bed reactor, and its results are shown in Table 1. The evaluation conditions are 30 °C, with a sulfur content of 50 μg mL−1 in the raw oil, and an LHSV of 1 h−1. The sulfur capacity of the adsorbent is 0.74 wt% for the first regeneration and 0.71 wt% for the second regeneration. The adsorbent shows good regeneration performance.| Regeneration times | 0 | 1 | 2 |
| Sulfur capacity (wt%) | 0.76 | 0.74 | 0.71 |
2.4 Characterization of the adsorbents
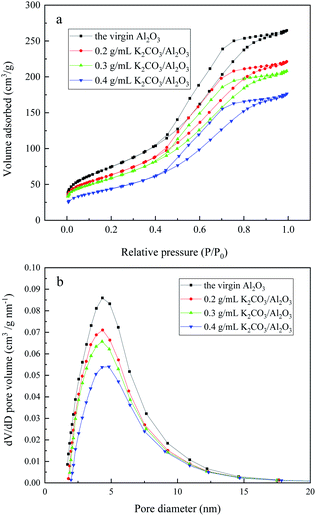
Table 2 shows the pore structure parameters of the adsorbents prepared via different concentrations of K2CO3. It can be seen from Table 2 that as the K2CO3 loading increases, the average pore size increases slightly, while the specific surface area and total pore volume decrease significantly. After loading K2CO3, the average pore size increase is due to the pores being filled with K2CO3, rather than the pore size becoming larger due to impregnation. The decrease in specific surface area and total pore volume is due to the filling of K2CO3, the small pore size disappears, and the large pore size becomes small. When the loading of K2CO3 increases from 0.3 g mL−1 to 0.4 g mL−1, a large amount of K2CO3 is deposited on the surface, the specific surface area decreased from 211.79 m2 g−1 to 158.54 m2 g−1, and the total pore volume decreased from 0.37 cm3 g−1 to 0.31 cm3 g−1.| K2CO3 concentration (g mL−1) | 0.0 | 0.2 | 0.3 | 0.4 |
| BET surface area (m2 g−1) | 272.09 | 229.27 | 211.79 | 158.54 |
| Total pore volume (cm3 g−1) | 0.47 | 0.39 | 0.37 | 0.31 |
| Average pore diameter (nm) | 6.02 | 6.07 | 6.08 | 6.89 |
Fig. 5(a) is an isotherm adsorption–desorption curve of different concentrations of K2CO3/Al2O3 adsorbent. In Fig. 5, the isothermal adsorption–desorption curves of different K2CO3/Al2O3 adsorbents are type IV and have the same H hysteresis loop in medium pressure and high-pressure parts (0.4 < P/P0 < 1), which is generally considered to be interconnected by the pore size of the mesoporous material.20 In the low-pressure section, the adsorption amount is gently increased, and N2 molecules are adsorbed on the mesopores inner surface in a single layer to a plurality of layers. There is a sudden increase in the adsorption amount at P/P0 = 0.4–0.8, which means that the mesoporous structure is relatively uniform. The pore size distribution of the adsorbent is obtained by the Barrett–Joyner–Halenda method (BJH), which is shown in Fig. 5(b). Interaction between the K2CO3 with the support Al2O3 does not significantly change the structure.21 The pore size distribution of the adsorbent loaded with different concentrations of K2CO3 is similar, mainly concentrated at 4–5 nm. When the K2CO3 loading is 0.3 g mL−1, the pore diameter is the smallest, which is mainly about 4.3 nm. The pore size of this range is suitable for the adsorption of CS2, and the adsorption desulfurization performance is best.
Fig. 6 shows the SEM image of virgin Al2O3, fresh 0.2 g mL−1, 0.3 g mL−1, 0.4 g mL−1 K2CO3/Al2O3 adsorbent and deactivated 0.3 g mL−1 K2CO3/Al2O3 adsorbent. When K2CO3 is not loaded, the surface of Al2O3 is very rough with a large number of holes, which is an irregular block structure. After the loading of K2CO3, the pores of Al2O3 are filled with K2CO3, and the surface becomes smooth gradually. The unfilled K2CO3 is loaded on the surface of the support in the form of small particles. As the loading increased, filamentous K2CO3 crystals appeared on the surface of the 0.4 g mL−1 K2CO3/Al2O3 adsorbent.
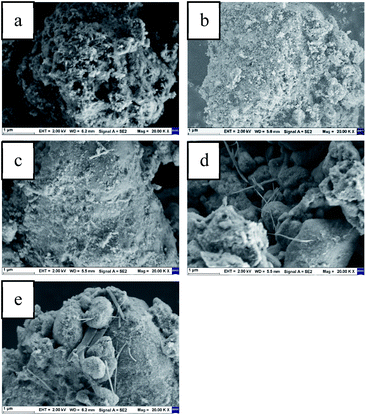 | ||
| Fig. 6 SEM of (a) the virgin-Al2O3, (b–d) the fresh 0.2 g mL−1, 0.3 g mL−1, 0.4 g mL−1 K2CO3/Al2O3, (e) the exhausted 0.3 g mL−1 K2CO3/Al2O3. | ||
When 0.3 g mL−1 K2CO3/Al2O3 adsorbent adsorbs CS2, the product produced by the adsorption process will block the pores and accumulate on the surface, one of the reasons for the decreased activity after adsorption of CS2.22 Among them, many kinds of filamentous or banded crystals appear on the surface of the adsorbed Al2O3 support. Since the loading of K did not increase, the crystals that appeared are associated with the adsorbed products, and the specific results are further analyzed by TEM.
Table 3 shows the EDS characterization result corresponding to the SEM. Virgin-Al2O3 contains only Al and O elements, and other elements are almost zero. After loading K2CO3, the content of the K element gradually increases as the amount of load increases. When the load concentration of K2CO3 is increased from 0.3 g mL−1 to 0.4 g mL−1, the mass increase of K is small, probably because the pores are already filled with K2CO3, and excessive K species blocks the pores and enriches the surface, resulting in a decrease in the loading mass. When CS2 is adsorbed, the presence of the S element can be detected, and the mass is 1.23 wt%, which means that the S element can be well adsorbed on the K2CO3/Al2O3 adsorbent.
| Al | O | K | S | ||
|---|---|---|---|---|---|
| Virgin Al2O3 | at.% | 39.62 | 60.28 | 0.10 | 0.01 |
| wt% | 47.33 | 52.47 | 0.19 | 0.01 | |
| Fresh 0.2 g mL−1 K2CO3/Al2O3 | at.% | 36.18 | 60.25 | 3.52 | 0.05 |
| wt% | 46.95 | 46.35 | 6.62 | 0.07 | |
| Fresh 0.3 g mL−1 K2CO3/Al2O3 | at.% | 29.68 | 62.54 | 7.74 | 0.03 |
| wt% | 38.04 | 47.52 | 14.38 | 0.05 | |
| Fresh 0.4 g mL−1 K2CO3/Al2O3 | at.% | 30.47 | 60.24 | 9.28 | 0.01 |
| wt% | 38.25 | 44.85 | 16.89 | 0.01 | |
| Exhausted 0.3 g mL−1 K2CO3/Al2O3 | at.% | 32.34 | 61.25 | 5.61 | 0.80 |
| wt% | 41.60 | 46.72 | 10.46 | 1.23 |
Since a newly formed crystal are found in the SEM image after desulfurization, TEM analysis is used. Fig. 7 shows a TEM image of the 0.3 g mL−1 K2CO3/Al2O3 adsorbent adsorbed by CS2 and a diffraction pattern of the adsorbed product. After the adsorption of CS2, a wafer appears around the adsorbent, and three crystal rings appear in the diffraction pattern, which is analyzed and calculated. Comparing the calculated Di with the PDF card, it is found that the three Di are 5.756, 1.988, and 1.374, respectively, corresponding to the three diffractive crystal surface (113), (408), and (288) of the S element, which conforms to the S elemental crystal (JCPDS No. 83-2283), demonstrating the formation of elemental S in the products.
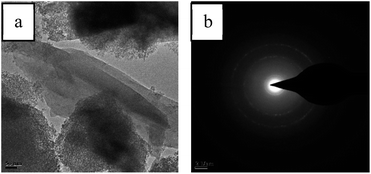 | ||
| Fig. 7 (a) TEM images of exhausted 0.3 g mL−1 K2CO3/Al2O3 adsorbent and (b) diffraction pattern taken from region c marked in (a). | ||
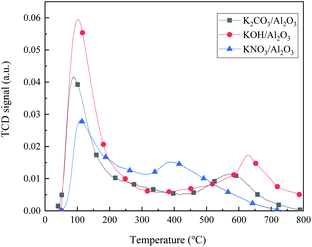
Fig. 8 is the CO2-TPD spectra of the 0.3 g mL−1 KNO3/Al2O3, K2CO3/Al2O3, and KOH/Al2O3 adsorbents. For both K2CO3/Al2O3 and KOH/Al2O3 adsorbents, there are two CO2 desorption peaks at a lower temperature (∼100 °C) and higher temperature (∼600 °C), which belong to the weak base and strong base centers, respectively. Besides, both peak strength and temperature of KOH adsorbent are higher than those of K2CO3, indicating that the alkalinity of KOH/Al2O3 is stronger than that of K2CO3/Al2O3 adsorbent. KNO3/Al2O3 adsorbent has only one weak base and one medium strong base adsorption center, and the desulfurization effect is only improved a little compared with pure Al2O3 adsorbent. In the desulfurization process, the hydrolysis center is OH−, and water plays a role in supplementing OH−.23,24 However, high alkalinity is not favorable for the hydrolysis of CS2 because CS2 and its final hydrolyzed products (H2S and CO2) are easily irreversibly adsorbed on the surface,16 inhibiting the catalytic hydrolysis reaction. Therefore, the adsorption and hydrolysis capacity of KOH with strong alkalinity is weaker than that of K2CO3.
Fig. 9 is an XRD spectrum of K2CO3, Al2O3 support, fresh 0.3 g mL−1 K2CO3/Al2O3 adsorbent, and exhausted 0.3 g mL−1 K2CO3/Al2O3 adsorbent. The main peaks of pure K2CO3 XRD images are at 2θ = 26.3, 30.1, 32.2, 34.3, and 42.9°, which are consistent with PDF cards (JCPDS No. 71-1466).25 The peaks of the XRD images of the support are mainly at 2θ = 19.5, 37.6, 39.4, 45.8, 60.8, and 67.0°, which is consistent with the position of the main peak of gamma-Al2O3 (JCPDS No. 10-0425). Compared with gamma-Al2O3, the strength of the main peak after K2CO3 modification is lower, and a new K2CO3 peak is generated at 2θ = 32.2 and 34.3°. The peak intensity is lower than pure K2CO3, which means that K2CO3 has a good load on the Al2O3 and has good dispersion.25 Liu et al.26 found that the K2CO3/Al2O3 adsorbent after calcining at 500 °C contained K2O, which may be overlaid in the XRD spectra due to lower content. Therefore, the composition of K2CO3/Al2O3 adsorbent is K2CO3, Al2O3, and a small amount of K2O.
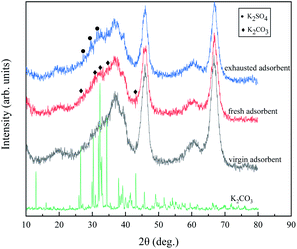 | ||
| Fig. 9 XRD spectra of the K2CO3, the virgin adsorbent, the fresh adsorbent, and the exhausted adsorbent. | ||
When the adsorbent adsorbs CS2, no peak of elemental S was found because the generated elemental S is easily sublimated in the air, resulting in too little amount on the surface of the adsorbent being difficult to detect. At 2θ = 26.4 and 29.8°, there is a new peak generation, and the peak intensity at 2θ = 30.8° increases, which is the characteristic peak of K2SO4 (JCPDS No. 73-1674), which means the production of SO42− after adsorption of CS2. The peak intensity of Al2O3 and K2CO3 after adsorption is reduced due to the deposition of sulfur products formed by adsorption of CS2 on the adsorbents.
Fig. 10 is a Fourier infrared spectrum of the 0.3 g mL−1 K2CO3/Al2O3 adsorbent before and after the adsorption of CS2. It can be seen from Fig. 10 that the peak appearing around 3558 cm−1 is a characteristic peak of –OH,27–29 which is derived from the –OH in K2CO3/Al2O3 adsorbent during catalyst preparation. The peaks at 1400 cm−1 and 1580 cm−1 are characteristic peaks of –COO and –C![[double bond, length as m-dash]](https://www.rsc.org/images/entities/char_e001.gif) O, which are related to the supported potassium carbonate CO2.26 –COO and –C
O, which are related to the supported potassium carbonate CO2.26 –COO and –C![[double bond, length as m-dash]](https://www.rsc.org/images/entities/char_e001.gif) O promote the oxidation of H2S, which accelerates the reaction rate of H2S by O2 to S, further improving the conversion ability of CS2. The peaks at 787 cm−1 (AlO4) and 582 cm−1 (AlO6) are related to the Al–O–Al structure.30
O promote the oxidation of H2S, which accelerates the reaction rate of H2S by O2 to S, further improving the conversion ability of CS2. The peaks at 787 cm−1 (AlO4) and 582 cm−1 (AlO6) are related to the Al–O–Al structure.30
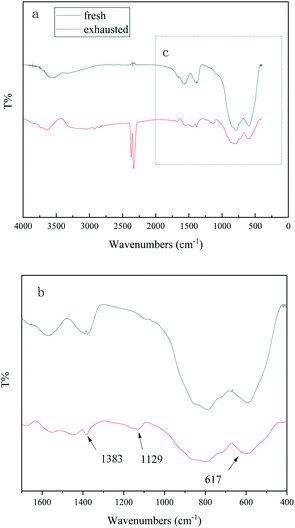 | ||
| Fig. 10 FT-IR spectra of (a) the fresh and exhausted K2CO3/Al2O3 adsorbents and (b) the enlarged area c marked in (a). | ||
After adsorption of CS2, new peaks at 2329 cm−1 and 2370 cm−1 are related to CO2,31 indicating that the CO2 produced by hydrolysis is chemically adsorbed to the adsorbent. The peaks at 2919 cm−1 and 2850 cm−1 are related to –CH3 and –CH2, indicating the residual of the adsorbed C5 on the adsorbent. The peaks at 1383 cm−1 and 1129 cm−1 are related to SO42−, which means that sulfite or sulfate may form. The peak at 617 cm−1 represents the formation of elemental S,32 and the adsorbed CS2 produces elemental sulfur on the surface of the K2CO3/Al2CO3 adsorbent. This result is consistent with that reported in the literature.33
Although we have used XRD and FT-IR to find sulfate group, due to its small content, the peak is not obvious, and it is not possible to distinguish sulfate group from sulfite group. So, the contents of sulfate and sulfite in the fresh and the spent catalysts are analyzed by IC to better explore the sulfur species on the adsorbent. The IC results in Table 4 show that there are no sulfates and sulfites in the fresh adsorbents. The exhausted adsorbent contains 2.62 wt% sulfate but no sulfite. The accumulation of sulfate on the catalyst is the main reason for the decrease of CS2 adsorption performance.
| The fresh adsorbent | The spent adsorbent | |
|---|---|---|
| SO42− (wt%) | 0.00 | 2.62 |
| SO32− (wt%) | 0.00 | 0.00 |
2.5 Discussion on the reaction mechanism
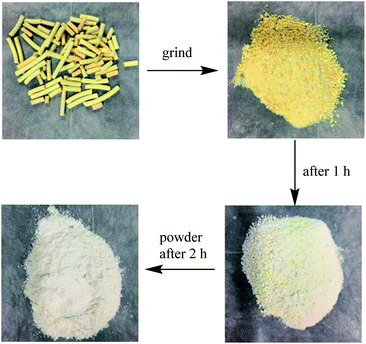
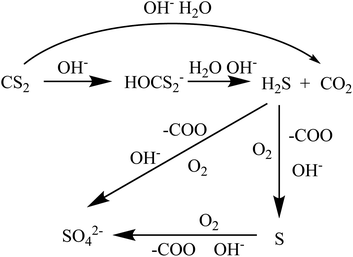
When the K2CO3/Al2O3 adsorbent adsorbs CS2 in C5, the adsorbent gradually turns yellow due to the accumulation of sulfur on the adsorbent.34 After adsorbed K2CO3/Al2O3 is taken out, and it is a yellow granule after grinding. The sulfur smell is dissipated, and the yellow color gradually becomes lighter as time lapses. The adsorbent is further ground to powder. The powder completely turned white after 2 hours, as shown in Fig. 11. This is because CS2 adsorbs on the adsorbent and is converted into elemental S, and elemental S is disappeared when exposed to the air.The removal process of CS2 in C5 distillate includes three processes of adsorption, hydrolysis, and oxidation. The adsorption is related to the pore structure of Al2O3 and active components. The OH− on the support is mainly derived from K2CO3 which is essential for the CS2 conversion.35,36 During the hydrolysis process, trace water in the C5 distillate oil and a large number of OH− on the adsorbent can hydrolyze CS2 to H2S. The C5 contains approximately 50–70 μg mL−1 of dissolved O2; the O2 then oxidizes H2S to elemental S or SO42−, covering the active site of the adsorbent, resulting in a decrease in adsorption capacity.37 During this period, OH−, –COO and C![[double bond, length as m-dash]](https://www.rsc.org/images/entities/char_e001.gif) O act to promote oxidation.38 The specific process is shown in Fig. 12.
O act to promote oxidation.38 The specific process is shown in Fig. 12.
3 Methods
3.1 Materials
The pseudo-boehmite powder and sesbania powder were purchased from Shandong Zibo Hengyi Chemical Technology Co., Ltd. K2CO3 was purchased from Tianjin Reagent Factory no. 3 Factory (A. R.), and potassium nitrate was purchased from Beijing Chemical Plant (A. R.).3.2 Preparation of adsorbent
A certain amount of pseudo-boehmite powder was mixed with an appropriate amount of sesbania powder. 2 wt% dilute nitric acid solution was added to the mixed powder and mixed well. After kneading in a squeezer for 90 min, the template was extruded and dried at 120 °C for 12 h followed by calcination in air at 500 °C for 4 hours to prepare strip-shaped gamma-Al2O3 support.The same concentration (0.3 g mL−1) of KNO3, KOH, K2CO3 solution and different concentrations (0.1 g mL−1, 0.2 g mL−1, 0.3 g mL−1, and 0.4 g mL−1) of K2CO3 solution were prepared. The gamma-Al2O3 support was impregnated with these solutions, respectively, by an incipient-wetness impregnation method, dried at 120 °C for 12 hours, and then calcined at 500 °C for 4 hours to obtain the corresponding potassium salt modified gamma-Al2O3 desulfurization adsorbents. They were denoted as 0.3 g mL−1 KNO3/Al2O3, 0.3 g mL−1 KOH/Al2O3, 0.1 g mL−1 K2CO3/Al2O3, 0.2 g mL−1 K2CO3/Al2O3, 0.3 g mL−1 K2CO3/Al2O3, and 0.4 g mL−1 K2CO3/Al2O3. Before the experiments, the catalyst was calcined at 400 °C to remove the H2O and CO2.
The regeneration performance of adsorbents was also investigated. The deactivated adsorbents were calcined at 500 °C in the air atmosphere for 3 hours and then cleaned with deionized water for 3 times to remove the deposited sulfate. After that, 0.1 g mL−1 K2CO3 solution was used for reimpregnation to obtain the regenerated adsorbent.
3.3 Desulfurization performance tests
The cracked C5 distillate was used as raw material, and 0.12 g and 0.005 g of CS2 was added to 100 mL of cracked C5 distillate, respectively. The mixture was stirred until CS2 was completely dissolved. The sulfur contents in the as-prepared C5 oil were 1200 μg mL−1 and 50 μg mL−1, respectively. 0.001 g, 0.01 g, and 0.1 g of water were added to 100 mL of prepared C5 distillate, respectively. The final water content of the C5 oil is 10 μg mL−1, 100 μg mL−1, and 1000 μg mL−1, respectively.The static adsorption method was applied to investigate the adsorption performance of CS2. The experimental conditions were as follows: the adsorption temperature was 30 °C, and 5 g of the modified desulfurization adsorbent was added to 50 mL of C5. The adsorption performance is determined by evaluating the sulfur content of the C5 distillate after adsorption.
The dynamic desulfurization experiment was carried out in a fixed bed reactor at a pressure of 0.4 MPa. The volume of the reaction tube was 30 mL. The sulfur-containing C5 distillate oil is passed through a micro-injection pump from the bottom to the top through a fixed bed with 21 g of modified adsorbent. The effects of temperatures (5, 30 and, 55 °C), different sulfur contents of raw material (50, 75, and 100 μg mL−1), and different liquid hourly space velocities (LHSV) (0.5, 1.0, and 1.5 h−1) on desulfurization performance of the adsorbent were investigated. During the experiment, C5 was collected at the fixed bed outlet at intervals, and the sulfur content was analyzed. When the sulfur content of the C5 was higher than 5 μg mL−1, it was considered that the adsorbent was exhausted, and the experiment was stopped. The calculation formula of the adsorbent breakthrough sulfur capacity SC (wt%) is shown in eqn (1),
 | (1) |
Total sulfur content in the liquid of C5 before and after the reaction was analyzed using an RPP-2000S UV fluorescence sulfur analyzer.
3.4 Characterization of catalysts
The Brunauer–Emmett–Teller (BET) surface area and total pore volume of the adsorbent were measured using an N2 adsorption–desorption apparatus (TriStar II 3020). The total pore volume was calculated by the amount of N2 adsorbed at a relative pressure (P/P0) = 0.99. The total area was calculated using a multipoint BET surface area calculation method. The morphology of the surface of the adsorbent particles was observed by a field emission scanning electron microscope (SEM, Zeiss Sigma 500). The surface elemental analysis of the adsorbents was measured by an energy spectrometer (EDS, Bruker XFlash 6/30). Transmission electron microscopy image (TEM) was measured using F-20 microscopy (FEI, USA). CO2-TPD was characterized using a Micro Chemitics Instrument's Auto Chem II Model 2920 Multi-Function Adsorber. The catalyst was first purged in helium at a temperature of 400 °C for 1 h, cooled to room temperature, and saturated with pure CO2 at a flow rate of 50 mL min−1 for 30 min. After that, the TPD experiment was started, the heating rate was 10 °C min−1, the helium flow rate was 50 mL min−1, and the temperature was raised to 800 °C. XRD was characterized by a Panaco Sharp Xpert Pro MPD instrument for fresh K2CO3/Al2O3 adsorbents and exhausted adsorbents. The test conditions were: Cu Kα ray, voltage 36 kV, current 30 mA, scanning range 10–80°, step size 0.02° s−1. The FT-IR was tested using a Nicoleti S50 infrared spectrometer from PerkinElmer. The sample was mixed and milled with KBr before testing, and the infrared wavelength ranged from 4000 to 400 cm−1. Ionic chromatography (IC) was tested by Thermo Dionex ICS-1100. Samples were prepared using 0.10 N NaOH to extract sulfate and sulfite from the spent catalysts using sonication.4 Conclusions
In this paper, we prepared K2CO3/Al2O3 adsorbents to remove CS2 from C5 distillate. When the K2CO3 loading concentration is 0.3 g mL−1, the desulfurization capacity is the best, and the C5 fraction oil with a sulfur content of 1200 μg mL−1 can be desulfurized to below 10 μg mL−1. The use of the adsorbent in a fixed bed reactor also exhibits good adsorptive desulfurization capabilities. When the sulfur content is 50 μg mL−1, the space velocity is 1 h−1, and the temperature is 30 °C, the sulfur content can be reduced to 5 μg mL−1 or less and maintained for 108 hours. Under the optimized operating conditions, the breakthrough sulfur capacity is 0.76 wt%. The second and third regeneration capacities of the adsorbent were 74 wt% and 71 wt%, respectively. Based on the evidence of surface chemical characterization data, the removal mechanism of CS2 is proposed. The process of desulfurization of C5 distillate oil includes adsorption, hydrolysis, and oxidation. The adsorption is related to the pore structure of the adsorbents and the active components. The hydrolysis and oxidation processes are consistent with the removal of CS2 in the Claus plant. Further work would be to explore the regeneration mechanism of the deactivated adsorbent.Author contributions
Xiance Zhang: methodology, investigation, formal analysis, data curation, writing-original draft, Guanglin Zhou: conceptualization, writing-review & editing, project administration, resources, supervision, Mengying Wang: formal analysis, writing-review & editing, Xiaosheng Wang: writing-review & editing, resources, Weili Jiang: writing-review & editing, Hongjun Zhou: supervision.Conflicts of interest
There are no conflicts to declare.Acknowledgements
We are grateful to the financial supports from the Science Foundation of the China University of Petroleum, Beijing (No. 2462018YJRC028), China Postdoctoral Science Foundation (2019M660931).References
- J. Y. Hou, F. Guo, Q. Hu, Y. Li and Z. M. Hou, Chin. J. Polym. Sci., 2019, 37, 674–680 CrossRef CAS.
- H. C. Hsu, S. J. Wang, J. D. Y. Ou and D. S. H. Wong, Ind. Eng. Chem. Res., 2015, 54, 9798–9804 CrossRef CAS.
- H. Miki, J. Jpn. Pet. Inst., 2019, 62, 245–254 CrossRef CAS.
- D. Salari, A. Niaei, J. Towfighi and P. Panahi, Iran. J. Chem. Chem. Eng., 2006, 2, 40–51 Search PubMed.
- S. Brunet, D. Mey, G. Pérot, C. Bouchy and F. Diehl, Appl. Catal., A, 2005, 278, 143–172 CrossRef CAS.
- W. Jiang, X. Gao, L. Dong, J. Xiao, L. H. Zhu, G. Y. Chen, S. H. Xun, C. Peng, W. S. Zhu and H. M. Li, Pet. Sci., 2020, 17, 1422–1431 CrossRef CAS.
- Y. Liu, Y. Pan, H. Wang, Y. Liu and C. Liu, Chin. J. Catal., 2018, 39, 1543–1551 CrossRef CAS.
- M. A. Larrubia, A. d. Gutièrrez-Alejandre, J. Ramìrez and G. Busca, Appl. Catal., A, 2002, 224, 167–178 CrossRef CAS.
- C. Li, Z. Jiang, Y. Zhang, Y. Yang, M. Yang and L. Wang, Chinese Pat., CN101450303A, 2009 Search PubMed.
- H. Yu, J. Nan, J. Zhang, Y. Zhang, X. Qu, S. Geng and Y. Shi, Chinese Pat., CN103182291A, 2013 Search PubMed.
- K. Karan and L. A. Behie, Ind. Eng. Chem. Res., 2004, 43, 3304–3313 CrossRef CAS.
- C. Deng, X. P. Wu, X. M. Sun, Y. Ren and Y. H. Sheng, J. Comput. Chem., 2009, 30, 285–294 CrossRef CAS PubMed.
- P. D. Clark, N. I. Dowling and M. Huang, Appl. Catal., B, 2001, 31, 107–112 CrossRef CAS.
- F. I. Khalili, M. Sultan, C. Robl and M. A. Al-Ghouti, J. Ind. Eng. Chem., 2015, 28, 282–293 CrossRef CAS.
- M. Song, X. Yang and G. Wang, RSC Adv., 2018, 8, 35014–35022 RSC.
- H. Yi, D. He, X. Tang, H. Wang, S. Zhao and K. Li, Fuel, 2012, 97, 337–343 CrossRef CAS.
- N. Pechler and G. Emig, Gas Sep. Purif., 1991, 5, 247–251 CrossRef CAS.
- A. Primavera, A. Trovarelli, P. Andreussi and G. Dolcetti, Appl. Catal., A, 1998, 173, 185–192 CrossRef CAS.
- L. Wang, D. Wu, S. Wang and Q. Yuan, J. Environ. Sci., 2008, 20, 436–440 CrossRef CAS.
- S. Naumov, R. Valiullin and J. Kärger, Diffus. Fundam., 2007, 6, 67.61–67.62 Search PubMed.
- A. E. Aksoylu, A. N. Akin, S. G. Sunol and Z. İ. Önsan, Turk. J. Chem., 1996, 20, 88–94 CAS.
- X. Song, K. Li, C. Wang, X. Sun, P. Ning and L. Tang, Chem. Eng. J., 2017, 330, 727–735 CrossRef CAS.
- Q. Li, H. Yi, X. Tang, S. Zhao, B. Zhao, D. Liu and F. Gao, Chem. Eng. J., 2016, 284, 103–111 CrossRef CAS.
- J. West, B. P. Williams, N. Young, C. Rhodes and G. J. Hutchings, Catal. Lett., 2001, 74, 111–114 CrossRef CAS.
- S. C. Lee, Y. M. Kwon, H. J. Chae, S. Y. Jung, J. B. Lee, C. K. Ryu, C. K. Yi and J. C. Kim, Fuel, 2013, 104, 882–885 CrossRef CAS.
- H. Liu, L. Su, F. Liu, C. Li and U. U. Solomon, Appl. Catal., B, 2011, 106, 550–558 CrossRef CAS.
- C. Murugan, H. C. Bajaj and R. V. Jasra, Catal. Lett., 2010, 137, 224–231 CrossRef CAS.
- S. U. Rege and R. T. Yang, Chem. Eng. Sci., 2001, 56, 3781–3796 CrossRef CAS.
- L. Fernández-Carrasco and E. Vázquez, Fuel, 2009, 88, 1533–1538 CrossRef.
- A. Boumaza, L. Favaro, J. Lédion, G. Sattonnay, J. B. Brubach, P. Berthet, A. M. Huntz, P. Roy and R. Tétot, J. Solid State Chem., 2009, 182, 1171–1176 CrossRef CAS.
- K. Li, G. Liu, T. Y. Gao, F. Lu, L. Tang, S. Liu and P. Ning, Appl. Catal., A, 2016, 527, 171–181 CrossRef CAS.
- M. Liang, C. Li and H. Guo, J. Fuel Chem. Technol., 2002, 30, 347–352 CAS.
- E. He, G. Huang, H. Fan, C. Yang, H. Wang, Z. Tian, L. Wang and Y. Zhao, Fuel, 2019, 246, 277–284 CrossRef CAS.
- G. Zhou, Y. Fu and H. Zhou, Petrochemical Technol., 2001, 30, 602–604 CAS.
- R. Sui, C. B. Lavery, D. Li, C. E. Deering, N. Chou, N. I. Dowling and R. A. Marriott, Appl. Catal., B, 2019, 241, 217–226 CrossRef CAS.
- Y. Yue, X. Zhao, W. Hua and Z. Gao, Appl. Catal., B, 2003, 46, 561–572 CrossRef CAS.
- H. Yi, S. Zhao, X. Tang, C. Song, F. Gao, z. Wang, B. Zhang and Y. Zuo, Catal. Commun., 2014, 56, 106–109 CrossRef CAS.
- X. Song, P. Ning, C. Wang, K. Li, L. Tang, X. Sun and H. Ruan, Chem. Eng. J., 2017, 314, 418–433 CrossRef CAS.
| This journal is © The Royal Society of Chemistry 2021 |

