 Open Access Article
Oxide-based catalysis: tailoring surface structures via organic ligands and related interfacial charge carrier for environmental remediation
S. Harish *a,
S. Athithyaa,
V. Shivanib,
S. Ponnusamya,
M. Shimomura
 b,
J. Archana
 a and
M. Navaneethan
 *ac
*ac
aFunctional Materials and Energy Devices Laboratory, Department of Physics and Nanotechnology, SRM Institute of Science and Technology, Kattankulathur, 603 203, India. E-mail: aravindharri@gmail.com; m.navaneethan@gmail.com
bResearch Institute of Electronics, Shizuoka University, 3-5-1 Johoku, Naka-Ku, Hamamatsu, Shizuoka 432-8011, Japan
cNanotechnology Research Center, SRM Institute of Science and Technology, Kattankulathur, Chennai, 603 203, Tamil Nadu, India
First published on 28th May 2021
Abstract
Hierarchical nanostructures and the effects of ligands on their structure formation were investigated. Morphological analysis showed the change in the morphology from nanospindles to hollow hexagonal nanodisks with the change in ligands. Structural analysis exhibited the formation of both hexagonal ZnO and monoclinic CuO structures in the composition. The elemental composition confirms the presence of CuO and ZnO in the composition. An ultra-fast degradation was achieved for the nanocomposites. The ZnO/CuO composite with ethylenediamine showed the best activity by degrading 98.77% of the methylene blue dye in 36 min. A possible photocatalytic mechanism is proposed.
1. Introduction
Photocatalysis is the process of speeding up a photoreaction using a catalyst under light irradiation. In photocatalysis, superoxide and hydroxide radicals are generated by electrons of the conduction band and holes of the valence band upon the irradiation of a light source. These radicals undergo subsequent reactions with organic molecules and decompose them into harmless compounds. Photocatalysis has been used for numerous applications such as dye degradation,1–5 water splitting,6 food packaging, medical implants, and chemical compound delivery.7 The increasing level of pollution by organic waste is a great concern and there by research on photocatalysis increased to degrade the organic pollutants. The materials used as photocatalysts are metal–organic frameworks (MOFs),8 plasmonics,9 semiconductors,10 etc. However, MOFs have some disadvantages, such as low thermal stability and electrical conductivity, while plasmonics can be expensive. Hence, semiconductor photocatalysts have attracted considerable attention for use in the treatment of wastewater. Semiconductors have applications in almost every field of research, such as electronics,11–14 solar energy conversion,15 photo remediation and photoelectrochemistry,16 photovoltaics,17 cosmetics,18 agriculture,19 and medicine.20Among the numerous semiconductor materials, TiO2 has been widely investigated for photocatalytic applications. However, TiO2 is active only in UV light because of its wide bandgap. To utilize the entire solar spectrum, alternative materials need to be used instead of TiO2 photocatalysts. Zinc oxide is a non-toxic material with a wide bandgap (∼3.4 eV) and large exciton binding energy (60 meV), and has been investigated for diverse applications such as ultraviolet (UV) photodetectors,21 room-temperature exciton lasing applications,22 artificial synaptic thin-film transistors,23 supercapacitors,24 thin-film transistors,25 sensors,26 photovoltaics,27,28 photocatalysis,1,2 medical industry and drug delivery,29 cosmetic industry,30 textiles,31 and environmental remediation.32 Due to increasing environmental pollution levels, the photocatalytic application of ZnO nanostructures for environmental remediation has attracted considerable attention. ZnO is known to be UV-active with the ability to absorb the solar spectrum. This characteristic is manipulated to achieve good photocatalytic activity, which depends on the effects of morphology and its size.1,31 Owing to its significant effects on photocatalytic activity, researchers have tried to tune the morphology of ZnO. For example, Kumar et al. have reported the degradation of resorcinol and concluded that spherical ZnO nanoparticles demonstrated the highest activity, followed by rod-like and flake-like ZnO particles.31 Liu et al. have shown that nanofibers degraded 85% of an organic pollutant in 20 min, while nanoparticles degraded only 73%, hence concluding that nanofibers exhibit better photocatalytic activity than nanoparticles.32 The agglomerated nanoparticles seem to lower the activity due to reduced surface interactions between the dye and catalyst, while the porous structure of nanofibers increases surface interactions between the two and results in higher activity.
In spite of its significant properties, ZnO as a photocatalyst has some disadvantages such as being active in the UV light, low yield, and high recombination rate. The solar spectrum constitutes only 5–7% of the UV region, while 46% is the visible region. Doped ZnO nanostructures have shown the reduced recombination of charge carriers with enhanced photocatalytic activity by modifying bandgap and inducing defects.33–35 Researchers have even deposited noble metals such as Ag, Au, Pt, and Pd on ZnO to enhance the photocatalytic activity.36 By depositing such metals on the surface, the photoinduced charge carriers are expected to be captured more easily and enhance the light absorption, thereby improving the photocatalytic efficiency. Coupling ZnO with a low bandgap material makes it possible to use under visible light.37–39 These structures have higher photodecomposition activity and degrade organic pollutants into less harmful compounds.
CuO is a p-type semiconductor, which is abundant and economical with a narrow bandgap (∼1.2 eV) and high exciton binding energy (140 meV). For example, Yin et al. have reported that amorphous copper oxide nanoclusters can act as photocatalysts to reduce CO2 in the atmosphere when grafted onto the surface of a semiconductor.40 Hence, CuO can be coupled with ZnO as a photocatalyst for the degradation of organic pollutants. Numerous studies have reported that combining a low bandgap semiconductor with a high bandgap semiconductor enhanced the photocatalytic activity with reduced recombination.41–44 Another way of enhancing the photocatalytic activity of a material is using capping agents. A capping agent modifies the surface of the photocatalyst and makes it more available for surface interactions. Amines can act as good capping agents. They break the weak bonds and terminate growth in a particular direction. Amines can be recycled and do not liberate any toxic by-products. In the absence of an amine, the breakdown of organic pollutants is relatively slower, and the crystal growth process includes an additional step of oriented aggregation.45–50 Hence, the effects of different capping agents on the formation of nanocomposites and their photocatalytic activities need to be investigated. For the very first time, we have investigated the effects of different capping agents (ethylene diamine (EDA), diethylamine (DEA), triethylamine (TEA), and cyclohexylamine (CYC)) on the formation of ZnO/CuO nanocomposites and photocatalytic activity.
2. Experimental procedure
0.2 M of Zn(CH3COO)2·2H2O and 0.01 mol Cu(CH3COO)2 were added in 50 mL deionized water and stirred for 15 min. 1 mL of ethylenediamine and 0.2 mol L−1 of NaOH was mixed to the above solution and stirred for 30 min. The prepared solution transferred to an autoclave, then kept in a muffle furnace at 200 °C for 4h (EDA). The same procedure was followed for diethylamine, triethylamine, and cyclohexylamine capped samples. The samples were termed as EDA for ethylenediamine, DEA for diethylamine, TEA for triethylamine, and CYC for cyclohexylamine.2.1 Characterization techniques
The crystal structure measurements have been carried out using a Rigaku diffractometer (RINT-2200, Japan, Cu Kα radiation) at a scan rate of 2° min−1 ranging from 20–80°. The morphology of the samples has been investigated using a field emission scanning electron microscope (FESEM) (JEOL JSM 7001F microscope) at an accelerating voltage of 15 kV with a working distance of around ∼10 mm. Transmission electron microscopy (TEM) was performed at an accelerating voltage of 200 kV and emission current of 135 μA in the bright-field (BF) mode (Hitachi H800) via high-resolution transmission electron microscopy (HRTEM; JEOL 2100F microscope), interplanar spacing and the nanocrystalline nature of the samples are analysed. Raman spectroscopy is studied with a green laser of 532 nm wavelength with different laser powers (JASCO NRS 7100). XPS analysis was performed using Shimadzu ESCA 3400 (Japan) to identify the chemical composition and valence states. The UV-Vis absorption measurements were carried out at room temperature to analyze the bandgap of nanomaterials using Shimadzu, UV-2600 spectrophotometer. Photoelectrochemical studies were recorded using the Biologic 150 electrochemical workstation under solar cell illumination.2.2 Photocatalytic studies
The photocatalytic activities of the as-synthesised ZnO/CuO samples with different capping agents were evaluated using methylene blue (MB) as a model pollutant. The reactions were carried out at room temperature using Asahi Spectra (MAX 303, 500 W, Japan) as the light source. In a typical reaction, 10 ppm of the dye was added to 50 mL de-ionised water and stirred for 5 min. Under constant stirring, the pH of the solution was adjusted to 12 in the above solution, followed by 50 mg of catalyst was added. To achieve an adsorption–desorption equilibrium, the solution was left in dark for 20 min under stirring. The reaction solution was then irradiated under a light source positioned 15 cm away from the surface of the solution. At regular intervals, 3 mL of the solution was collected, centrifuged, and analysed using a UV-Vis spectrometer. The MB dye degradation was calculated from a decrease in the intensity of absorbed light at 664 nm.3. Results and discussion
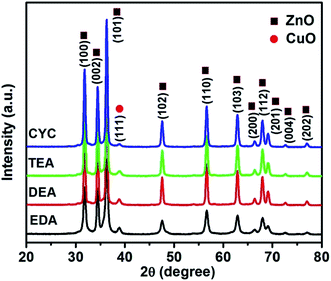
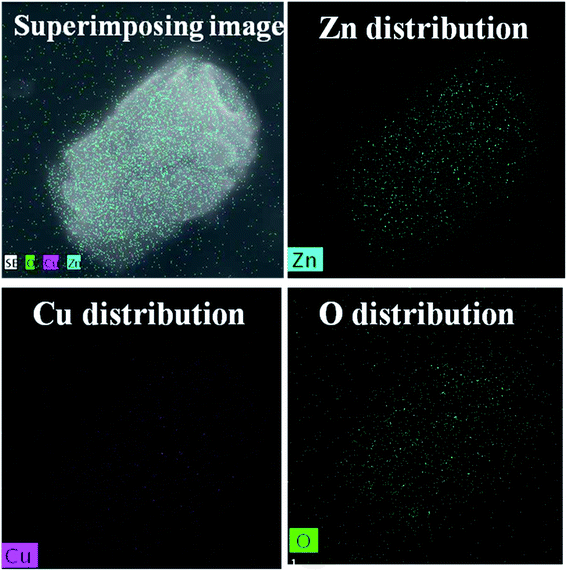
Fig. 1 shows the powder XRD patterns of ZnO/CuO composites. All the samples showed diffraction peaks corresponding to the hexagonal and monoclinic structures of ZnO and CuO, respectively. The peaks obtained at 31.89°, 34.48°, 36.37°, 47.59°, 56.68°, 62.94°, 66.36°, 69.19°, and 76.9° corresponded to (100), (002), (101), (102), (110), (103), (200), (201), and (202) planes of ZnO (JCPDS card no. 01-089-0510), respectively.2,32 In addition, one peak at 38.85° has been observed which corresponds to the (111) plane of CuO (JCPDS card no. 03-065-2309).51 The addition of capping agents did not influence the structure of the composite as no peaks were obtained for the capping agents.The morphological analyses of the EDA-capped ZnO/CuO sample showed the formation of nanospindles and nanoparticles, as shown in Fig. 2(a1). The surface of the nanospindles is porous, confirming that nanoparticles were agglomerated in the formation of a spindle-like structure, as shown in Fig. 2(a2), whereas hexagonal nanodisks are obtained for the DEA-capped ZnO/CuO composite, as shown in Fig. 2(b1). The TEA-capped ZnO/CuO composite showed the formation of hierarchical nanostructures from self-assembled nanodisks, as shown in Fig. 2(c1). Fig. 2(b1) and (c1) show that hexagonal nanodisks are etched in the middle and orient themselves to form hollow nanorods. The etching effects observed in DEA and TEA-capped composites might be due to the terminal methyl groups, which can react easily and break bonds on the composite surface, unlike the methyl groups in EDA and CYC. The TEM images clearly shows the formation of nanodisks in the samples. Fig. 2(c2) shows the image of a short nanorod, the size of which is calculated to be 500–600 nm. CYC-capped ZnO/CuO shows smaller nanodisks compared to the other samples. The size of ZnO/CuO nanodisks is 300–400 nm, with a length of 600 nm. The elemental distribution of the TEA sample further confirms the formation of CuO in the composite, as shown in Fig. 3.
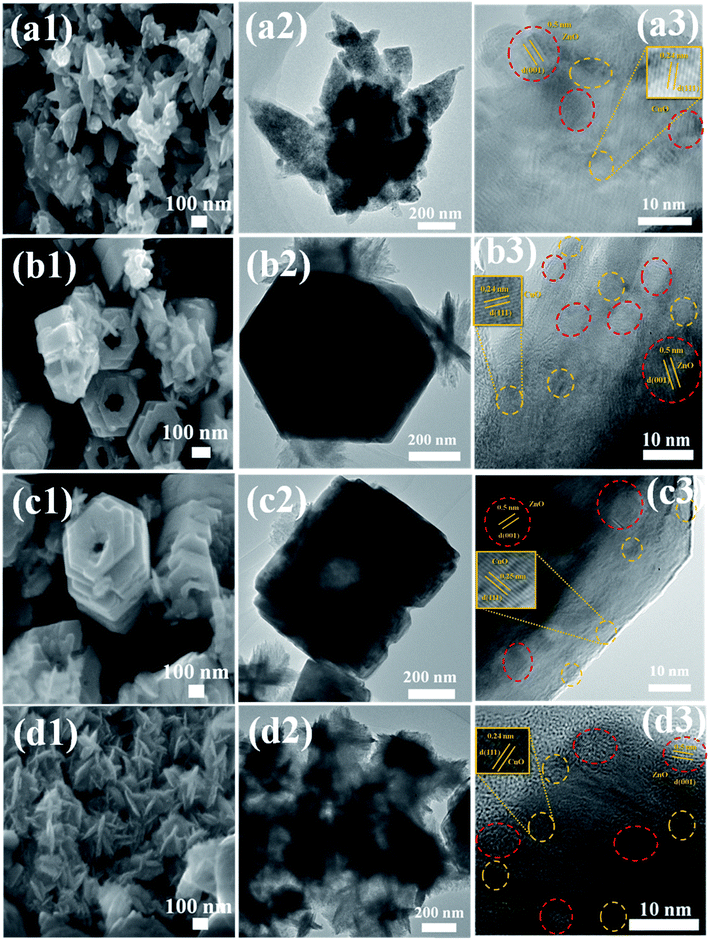 | ||
| Fig. 2 FESEM, TEM, and HRTEM images of (a1–a3) EDA, (b1–b3) DEA, (c1–c3) TEA, and (d1–d3) CYC-capped ZnO/CuO samples. | ||
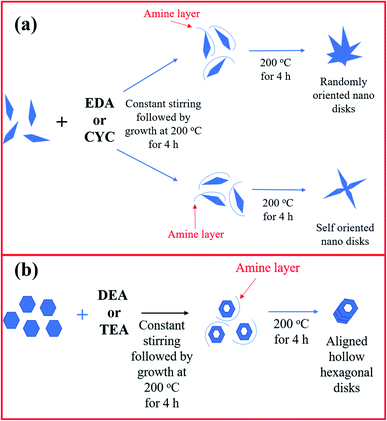
The growth mechanism of ZnO/CuO with the addition of different capping ligands is shown in Fig. 4(a) and (b). When an amine is added to the reaction mixture, it forms a layer over the nanodisk surface and terminates further addition of nanodisks on certain faces while promoting growth on some faces of the disk. EDA has terminal amine groups with methyl groups at the center of the chain. This results in the random orientation of nanodisks upon maintaining the solution at 200 °C for 4 h. When CYC was added to the solution, self-oriented nanodisks were obtained. It is proposed that the aromatic structure of CYC played some role in orienting the nanodisks. However, when DEA or TEA was added to the solution, the terminal methyl groups played a significant role and resulted in a different growth mechanism. The amines coat the nanodisks and etch the nanodisks in the center while terminating the growth in all directions except the hexagonal face. The nanodisks align into hierarchical structures in the hexagonal direction alone, giving rise to hollow hexagonal nanorods.
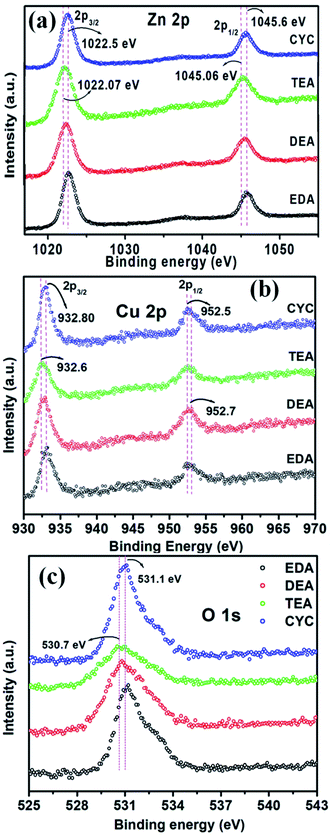
XPS spectra of ZnO/CuO composites capped with different amines are shown in Fig. 5. The peaks centred at 1022.5 eV (Zn 2p3/2) and 1045.6 eV (Zn 2p1/2) suggest the existence of Zn2+ (Fig. 5(a)). The energy difference is 23 eV for a +2 oxidation state.52 When DEA and TEA were used as the capping agents, the peaks slightly shifted from 1022.5 eV to 1022.07 eV (Zn 2p3/2) and 1045.6 eV to 1045.06 eV (Zn 2p1/2), respectively. Doublet peaks were obtained for EDA and CYC-capped composites centered at 932.8 eV (Cu 2p3/2) and 952.5 eV (Cu 2p1/2) of Cu2+ states, respectively (Fig. 5(b)). The peaks shifted from 932.8 to 932.6 eV and 952.5 to 952.7 eV when the capping agent was changed to DEA and TEA. A possible reason is that the electronegativity of Cu ions is higher than that of Zn ions. This lead to more interactions of Cu ions in the ZnO/CuO composite, which hinder the reaction with Zn2+ ions. The peak shift towards higher energy was due to the intermixing or charge transfer between Zn and Cu ions.53 The peak at 531.1 eV confirms the bonding of Zn and oxygen in ZnO (Fig. 5(c)). A similar peak shift from 531.1 to 530.7 eV was attributed to the capped ZnO/CuO. From the analysis, a strong interaction between ZnO and CuO in the composites was observed.
The optical property of semiconductors is an essential parameter to assess suitable light response and wavelength that are needed for photocatalytic reactions. The UV visible absorption of CuO/ZnO nanocomposites was observed and is presented in Fig. 6(a). The two major UV absorption regions were studied, and the first region from 250–415 nm is attributed to the recombination of photogenerated electrons and holes in the semiconducting material.55 The second broad absorption peak in the range 500–705 nm is assigned to the indirect emission from interstitial Zn-related defects.56 The optical band gap energy was evaluated using absorbance and photon energy by the Tauc's plot. The plot shows (αhν)2 for CYC, DEA, EDA, and TEA in Fig. 6(b). The bandgap value for different samples such as CYC, DEA, EDA, and TEA are 2.96, 2.95, 2.91, and 2.89 eV, respectively, giving appropriate band energy. The bandgaps confirmed that the CuO/ZnO composites absorb visible light and could be used as visible photocatalysts. The functional properties and the presence of amine in the composition were analyzed via FTIR, as shown in Fig. 6(c). The bands at 3377 and 1643 cm−1 correspond to the O–H stretching and bending vibrations of H2O molecules. The presence of amine molecules was confirmed by the 1562 and 1410 cm−1 bands. The presence of the organic molecule was confirmed by the band at 2923 cm−1. The C–H bending and M–O stretching peaks are at 869, 990, 400, and 600 cm−1, respectively.41,54 The isotherms of the gaseous N2 adsorption–desorption performed to study the porosity nature of CuO/ZnO composites are shown in Fig. 6(d). All the samples represented the low sloping of the adsorption and desorption curves. The region of the adsorption curve is formed due to the tensile strength effect, and the residues present in the sample can leave pores, leading to the formation of the region for the desorption curve. The CYC-based composite recorded high tensile strength effects than the other sample, denoting the presence of high pores in the composites. The specific surface areas and pore sizes of CYC, DEA, EDA, and TEA are found to be 18.17 (17.05), 16.56 (15.26), 10.05 (17.05), and 14.70 m2 g−1 (15.26 nm), respectively.
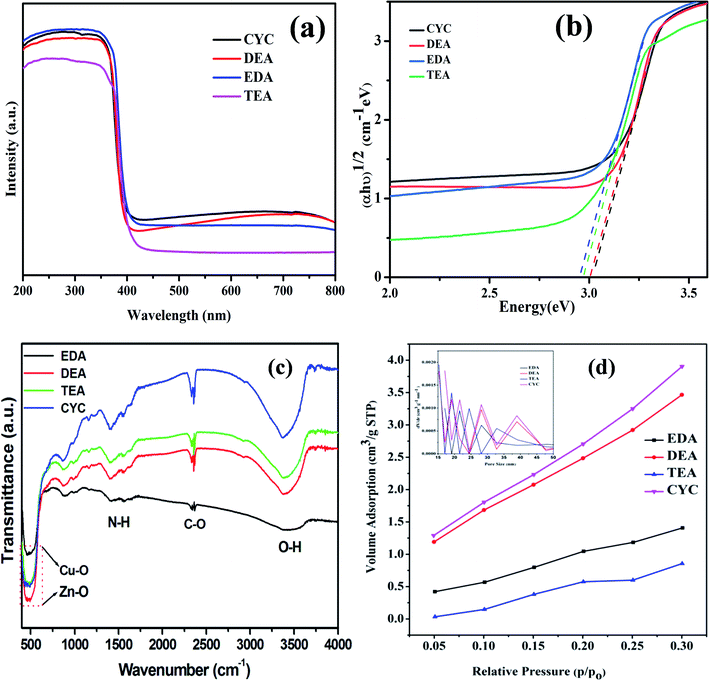 | ||
| Fig. 6 (a) UV-Vis spectra, (b) Tauc plot, (c) FTIR spectra and (d) BET analysis of ZnO/CuO composites. | ||
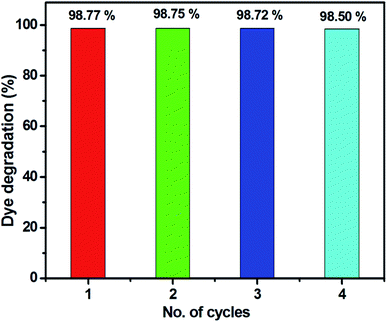
The activities of CuO/ZnO with different capping ligands were evaluated (Fig. 7). The initial absorption peak of the EDA sample (Fig. 7(a)) for the MB absorption peak intensity decreases gradually with an increase in the irradiation time and becomes transparent after 36 min of irradiation. The associated color changes of the suspension from dark blue to transparent over 36 min of irradiation were observed, as shown in Fig. 7(a). Fig. 7(b), (c), and (d) show the UV absorption spectra of DEA, TEA, and CYC-capped samples at 36 min of constant illumination. The amounts of MB degraded over the EDA, DEA, TEA, and CYC-capped samples were 98.77, 79.26, 97.09, and 98.29, respectively (Fig. 8(a)). Among the samples, EDA, TEA, and CYC acted as good catalysts and were successful in decomposing the organic dye into harmless compounds. DEA as a photocatalyst showed lesser efficiency compared to the other three catalysts. EDA acts as the best catalyst with the highest degradation of 98.77% in 36 min. The morphology of EDA and CYC might be the reason for exhibiting such a high photodegradation efficiency compared to the other two. The better morphology of EDA and CYC-capped composites helps in adsorbing more dye and decomposing it more quickly.
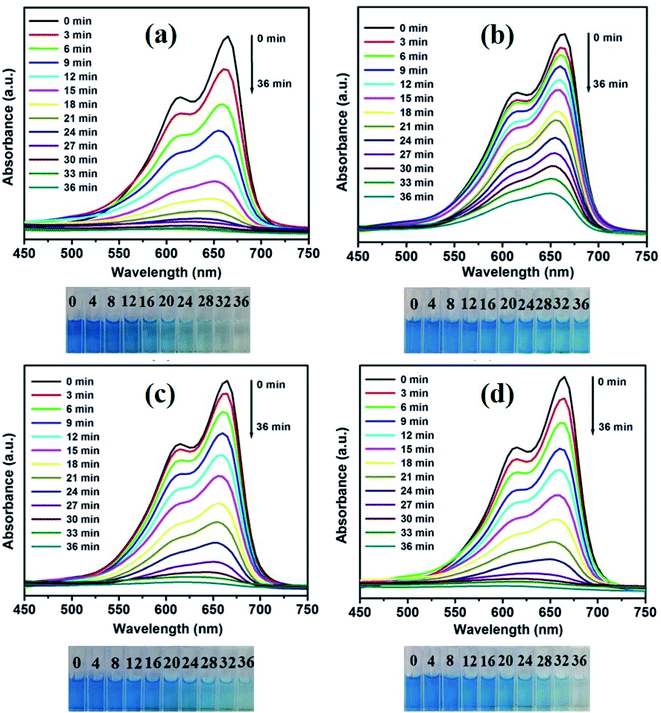 | ||
| Fig. 7 Effects of different capping agents on the degradation efficiency: (a–d) UV absorption spectra of the as-prepared ZnO/CuO samples. | ||
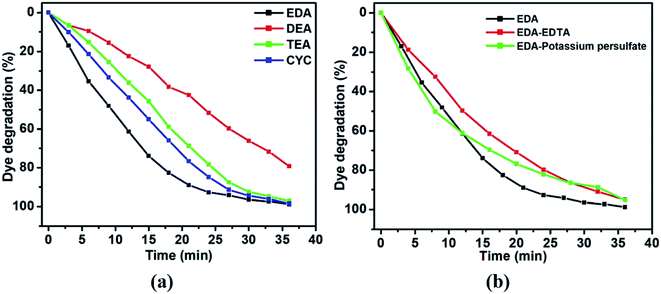 | ||
| Fig. 8 (a) Plot of dye degradation (%) as a function of irradiation time (min) and (b) scavenger studies on the as-prepared samples of ZnO/CuO. | ||
Apart from morphology, the pH of the solution might be another possible explanation for the observed photocatalytic activity. The pH of the capping agents increases in the following order: EDA > CYC > TEA > DEA. When these capping agents are added to the ZnO/CuO solution, the pH of the solution shifts accordingly due to the interactions of the cationic (dye solution) and negative charge (catalyst solution). Hence, we observe a very good photocatalytic activity. However, as pH increases to higher values, there is an excess of negative charge in the solution. With the number of MB molecules being fixed, there will be repulsion between excess negative charges. Apart from decreasing the dye absorption on the catalyst, these charges might hinder the light from the surface of the catalyst.
Scavenger studies have been performed on the EDA-capped ZnO/CuO sample. When a scavenger is added to the solution during photocatalysis, it suppresses one out of the two radicals and allows the other radical to take part in the photocatalytic reaction. If there is a distinct variation in degradation compared to the original result, as high as 50%, we can easily identify the major radicals. Fig. 8(b) shows the scavenger studies that have been performed. EDTA has been chosen as the hole scavenger and potassium persulfate as the electron scavenger. When EDTA was added, a degradation of 95.04% was obtained, while degradation of 95.3% was obtained by adding potassium persulfate. Since there is not much deviation from the original degradation of 98.7%, it can be inferred that hydroxide and superoxide radicals are equally important for photocatalytic activity.
The photocatalytic degradation process obeys first-order kinetics, and ln(C/C0) has been plotted against the irradiation time of MB (Fig. 9). Using the formula,
C = C0![[thin space (1/6-em)]](https://www.rsc.org/images/entities/char_2009.gif) exp(kt) exp(kt)
| (1) |
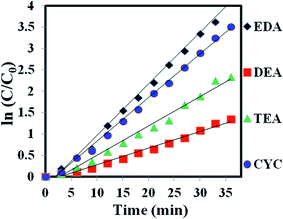 | ||
| Fig. 9 (a) Plots of ln(C0/Ct) as a function of time (min) for the photodegradation of MB over the ZnO/CuO samples capped with EDA, DEA, TEA, and CYC. | ||
| Sample | Kapp (ZnO/CuO) | R2 | Maximum degradation (%) | Time taken for degradation (min) |
|---|---|---|---|---|
| EDA | 0.1202 | 0.9905 | 98.77 | 36 |
| DEA | 0.0387 | 0.9842 | 79.26 | 36 |
| TEA | 0.0686 | 0.9861 | 97.09 | 36 |
| CYC | 0.1016 | 0.9958 | 98.29 | 36 |
| S. no. | Sample | Dye | Light | Power (W) | Time (min) | Degradation (%) | Ref. no. |
|---|---|---|---|---|---|---|---|
| 1 | ZnO | MB | Visible | 250 | 60 | — | 55 |
| 2 | Eu–ZnO | MB | UV | 450 | 300 | 90.5 | 56 |
| 3 | g-C3N4–ZnO | MO | Visible | 500 | 90 | 97 | 57 |
| 4 | CuO/nano TiO2 | MB | Visible | 300 | 300 | 99 | 58 |
| 5 | Ag/TiO2/graphene | MB | Visible | 500 | 60 | — | 59 |
| 6 | CQDs/meso-Ti-450 | MB | Visible | 1000 | 60 | 98 | 60 |
| 7 | ZnS–ZnO | MB | Visible | 500 | 360 | 74 | 61 |
| 8 | ZnO | MB | Visible | 500 | 180 | 40 | 62 |
| 9 | ZNT | MB | Visible | 400 | 240 | 97 | 63 |
| 10 | ZnO/NiFe2O4 | MB | UV | 32 | 70 | — | 64 |
| 11 | ZnO/CNT | MB | Visible | 160 | 180 | 98 | 65 |
| 12 | ZnO/CuO | MB | Visible | 500 | 36 | 98 | This work |
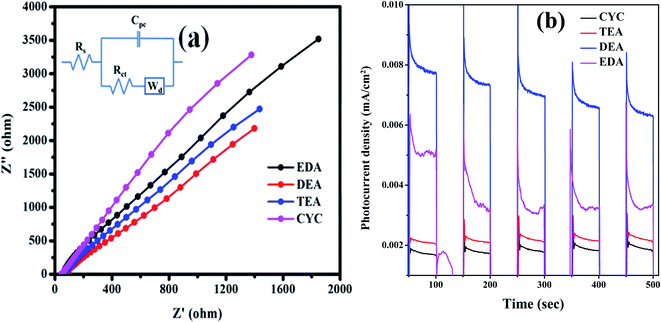
The charge transfer process at the interface and the electrochemical activity of the nanomaterials were investigated via electrochemical impedance spectroscopy (EIS). Here, we have applied the frequency range of 100 kHz to 1 Hz to study the EIS spectra when the three-electrode system is placed in an aqueous electrolyte. The obtained spectroscopy data and equivalent circuit (inset image) are shown in Fig. 11(a). The simulated electrochemical data of nanocatalysts according to the equivalent circuit are shown in Fig. 11(a). The high frequency region represents the charge transport resistance of catalysts (Rct). The Rct for EDA, DEA, TEA, and CYC are 8000, 3000, 5000, and 7000 Ω, respectively. A good catalyst material means that the Rct value should be minimum for dye degradation in the photocatalytic process. Therefore, the electrocatalytic activity of the nanocatalysts shows the following order: EDA > CYC > TEA > DEA, which is consistent with the performance order in the dye degradation. The transient photocurrent (i–t) responses were recorded by the chronoamperometry technique at an applied voltage (0.7 V). The rise and drop of the photocurrent response correspond to the illumination being switched on/off for every duration of 50 s (1.23 V vs. RHE). The stability was good for the entire samples under numerous light circles, which indicate no loss in current density. Fig. 11(b) shows the photoanodes under dark and simulated solar radiation. Among all, EDA shows an enhanced photocurrent density (0.009 mA cm−2) (1.23 V vs. RHE) when compared with CYC (0.0021 mA cm−2) (1.23 V vs. RHE), TEA (0.0022 mA cm−2) (1.23 V vs. RHE), and EDA (0.0062 mA cm−2) (1.23 V vs. RHE). The optimum photocurrent response of the CYC is low, but the photocatalysis response is high due to high surface area.
Based on these studies, a photocatalytic mechanism has been proposed.35,66 As shown in Fig. 12, when light is illuminated, the electrons move to the CB (conduction band) from VB (valence band) by holes in the VB. These holes and electrons can react with water and oxygen to form hydroxide and superoxide radicals. These hydroxide and superoxide radicals react with MB pollutants, converting them into harmless compounds. Hence, the separation of charge carriers is very important.
| CuO/ZnO + hν → CuO(e− + h+)/ZnO(e− + h+) | (2) |
| CuO(e− + h+)/ZnO(e− + h+) → CuO(h+)/ZnO(e−) | (3) |
| h+ + OH− → OH | (4) |
| e− + O2 → O2˙− | (5) |
| H2O + O2˙− → HO2˙ + OH− | (6) |
| HO2˙ + H2O2 + OH˙ | (7) |
| H2O2 + OH˙ | (8) |
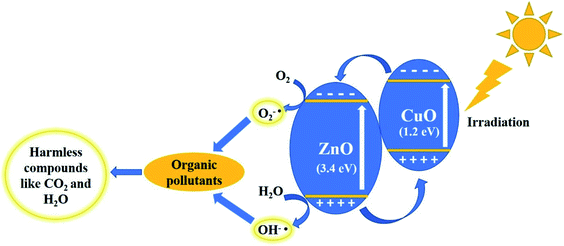 | ||
| Fig. 12 Mechanism of the photocatalytic activity of the ZnO/CuO samples under visible light irradiation. | ||
Since CuO has a small bandgap and active in visible light region, the electrons in the valence band of CuO get excited first, which later moves from the conduction band of CuO to ZnO (eqn (2) & (3)). The excited electron react with the dissolved oxygen and form radical ions (eqn (5)), which produces more hydroxide ions (OH˙) (eqn (6)–(8)). Holes react with OH− ions and produce highly reactive hydroxyl radicals (eqn (4)).44 This leads to the oxidation of the dye molecules. In this way, charge carriers are generated in the catalyst and always separated as the electrons keep moving from the conduction band of CuO to ZnO, while the holes move from the valence band of ZnO to CuO, without any interaction between electrons and holes.
4. Conclusion
ZnO/CuO composites capped with different amines have been synthesized. The effects of different capping ligands on the composites have been studied. The morphological analysis reveals that EDA and CYC-capped ZnO/CuO show the formation of nanospindles and nanodisks, while DEA and TEA-capped ZnO/CuO caused the hexagonal nanodisks to orient in the form of nanorods. The nanodisks were etched at the center when DEA and TEA were used as the capping agents, leading to the formation of hollow nanorods. The photocatalytic studies performed on MB showed that EDA-capped ZnO/CuO had the most efficient photocatalytic activity, followed by CYC-capped ZnO/CuO. Higher photocatalytic activity has been obtained using capping agents for these composites. Thus, ZnO/CuO composites with capping agents can be considered as promising photocatalytic materials for degrading organic pollutants present in the water bodies.Conflicts of interest
There are no conflicts to declare.Acknowledgements
Authors thank the management of SRM IST for financial support to carry out the research. Authors thank Center for Instrumental Analysis, Shizuoka University, Hamamastu, Japan for providing research facilities.References
- D. Zhang, X. Liu, H. Wan, N. Zhang, S. Liang, R. Ma and G. Qiu, ACS Sustainable Chem. Eng., 2017, 5(7), 5869–5879 CrossRef CAS.
- W. Cui, J. He, H. Wang, J. Hu, L. Liu and Y. Liang, Appl. Catal., B, 2018, 232, 232–245 CrossRef CAS.
- L. Liu, P. Hu, Y. Li, W. An, J. Lu and W. Cui, Appl. Surf. Sci., 2019, 466, 928–936 CrossRef CAS.
- J. Hu, P. Zhang, W. An, L. Liu, Y. Liang and W. Cui, Appl. Catal., B, 2019, 245, 130–142 CrossRef CAS.
- Y. Liang, X. Wang, W. An, Y. Li, J. Hu and W. Cui, Appl. Surf. Sci., 2019, 466, 666–672 CrossRef CAS.
- M. Gao, L. Zhu, W. Ong, J. Wang and G. W. Ho, Catal. Sci. Technol., 2015, 5, 4703–4726 RSC.
- C. Han, M. Pelaez, V. Likodimos, A. G. Kontos, P. Falaras, K. O’Shea and D. D. Dionysiou, Appl. Catal., B, 2011, 77–87 CrossRef CAS.
- Y. Li, H. Xu, S. Ouyang and J. Ye, Phys. Chem. Chem. Phys., 2016, 18, 7563–7572 RSC.
- W. Ye, R. Long, H. Huang and Y. Xiong, J. Mater. Chem. C, 2017, 5, 1008–1021 RSC.
- R. Daghrir, P. Drogui and D. Robert, Ind. Eng. Chem. Res., 2013, 52, 3581–3599 CrossRef CAS.
- E. Lhuillier, S. Pedetti, S. Ithurria, B. Nadal, H. Heuclin and B. Dubertret, Acc. Chem. Res., 2015, 48(1), 22–30 CrossRef CAS PubMed.
- G. R. Hong, S. S. Lee, Y. Jo, M. J. Choi, Y. C. Kang, B. H. Ryu, K. B. Chung, Y. Choi and S. Jeong, ACS Appl. Mater. Interfaces, 2016, 8(44), 29858–29865 CrossRef CAS PubMed.
- K. H. Kim, Z. Chi, M. J. Cho, J. Jin, M. Y. Cho, S. J. Kim, J. Joo and D. H. Choi, Chem. Mater., 2007, 19, 4925–4932 CrossRef CAS.
- E. Koenig, A. Jacobs and G. Lisensky, J. Chem. Educ., 2017, 94(6), 738–742 CrossRef CAS.
- A. Zakutayev, C. M. Caskey, A. N. Fioretti, D. S. Ginley, J. Vidal, V. Stevanovic, E. Tea and S. Lany, J. Phys. Chem. Lett., 2014, 5, 1117–1125 CrossRef CAS PubMed.
- J. A. Merlo, C. R. Newman, C. P. Gerlach, T. W. Kelley, D. V. Muyres, S. E. Fritz, M. F. Toney and C. Daniel Frisbie, J. Am. Chem. Soc., 2005, 127, 3997–4009 CrossRef CAS PubMed.
- T. L. Bahers, M. Rérat and P. Sautet, J. Phys. Chem. C, 2014, 118, 5997–6008 CrossRef CAS.
- N. Imanaka, T. Masui, H. Hirai and G. Adachi, Chem. Mater., 2003, 15, 12 CrossRef.
- R. Raliya, J. C. Tarafdar and P. Biswas, J. Agric. Food Chem., 2016, 64(16), 3111–3118 CrossRef CAS PubMed.
- J. W. Rasmussen, E. Martinez, P. Louka and D. G. Wingett, Expert Opin. Drug Delivery, 2010, 7, 9 Search PubMed.
- B. D. Boruah and A. Misra, ACS Appl. Mater. Interfaces, 2016, 8(28), 18182–18188 CrossRef PubMed.
- P. Yang, H. Yan, S. Mao, R. Russo, J. Johnson, R. Saykally, N. Morris, J. Pham, R. He and H. J. Choi, Adv. Funct. Mater., 2002, 12, 5 Search PubMed.
- P. B. Pillai and M. M. de Souza, ACS Appl. Mater. Interfaces, 2017, 9(2), 1609–1618 CrossRef PubMed.
- H. C. Han, C. W. Chong, S. B. Wang, D. Heh, C. A. Tseng, Y. F. Huang, S. Chattopadhyay, K. H. Chen, C. F. Lin, J. H. Lee and L. C. Chen, Nano Lett., 2013, 13, 1422–1428 CrossRef CAS PubMed.
- S. Y. Cho, Y. H. Kang, J. Y. Jung, S. Y. Nam, J. Lim, S. C. Yoon, D. H. Choi and C. Lee, Chem. Mater., 2012, 24, 3517–3524 CrossRef CAS.
- D. Gedamu, I. Paulowicz, S. Kaps, O. Lupan, S. Wille, G. Haidarschin, Y. K. Mishra and R. Adelung, Adv. Mater., 2014, 26, 1541–1550 CrossRef CAS PubMed.
- A. Sharma, M. Ionescu, G. G. Andersson and D. A. Lewis, Sol. Energy Mater. Sol. Cells, 2013, 115, 64–70 CrossRef CAS.
- A. B. Djurišic, X. Liu and Y. H. Leung, Phys. Status Solidi RRL, 2014, 8, 2 Search PubMed.
- T. G. Smijs and S. Pavel, Nanotechnol., Sci. Appl., 2011, 4, 95–112 CrossRef CAS PubMed.
- A. Becheri, M. Dürr, P. L. Nostro and P. Baglioni, J. Nanopart. Res., 2008, 10, 679–689 CrossRef CAS.
- K. S. R. K. Rao and S. G. Kumar, RSC Adv., 2015, 5, 3306–3351 RSC.
- H. Liu, J. Yang, J. Liang, Y. Huang and C. Tangz, J. Am. Ceram. Soc., 2008, 91(4), 1287–1291 CrossRef CAS.
- N. C. S. Selvam, J. J. Vijaya and L. J. Kennedy, Ind. Eng. Chem. Res., 2012, 51, 16333–16345 CrossRef.
- V. Etacheri, R. Roshan and V. Kumar, ACS Appl. Mater. Interfaces, 2012, 4(5), 2717–2725 CrossRef CAS PubMed.
- A. Phuruangrat, O. Yayapao, T. Thongtem and S. Thongtem, J. Nanomater., 2014, 9 Search PubMed.
- R. J. V. Michael, B. Sambandam, T. Muthukumar, M. J. Umapathya and P. T. Manoharan, Phys. Chem. Chem. Phys., 2014, 16, 8541 RSC.
- S. Harish, M. Sabarinathan, J. Archana, M. Navaneethan, S. Ponnusamy, C. Muthamizhchelvan, H. Ikeda and Y. Hayakawa, Appl. Surf. Sci., 2017, 418, 171–178 CrossRef CAS.
- S. Harish, M. Sabarinathan, J. Archana, M. Navaneethan, K. D. Nisha, S. Ponnusamy, V. Gupta, C. Muthamizhchelvan, D. K. Aswal, H. Ikeda and Y. Hayakawa, Appl. Surf. Sci., 2017, 418, 147–155 CrossRef CAS.
- S. Harish, J. Archana, M. Sabarinathan, M. Navaneethan, A. Silambarasan, K. D. Nisha, S. Ponnusamy, C. Muthamizhchelvan, H. Ikeda, D. K. Aswal and Y. Hayakawa, Appl. Surf. Sci., 2017, 418, 103–112 CrossRef CAS.
- G. Yin, M. Nishikawa, Y. Nosaka, N. Srinivasan, D. Atarashi, E. Sakai and M. Miyauchi, ACS Nano, 2015, 9(2), 2111–2119 CrossRef CAS PubMed.
- S. Harish, J. Archana, M. Sabarinathan, M. Navaneethan, K. D. Nisha, S. Ponnusamy, C. Muthamizhchelvan, H. Ikeda, D. K. Aswal and Y. Hayakawa, Appl. Surf. Sci., 2016, 418, 103–112 CrossRef.
- P. S. Kumar, M. Selvakumar, S. G. Babu, S. Induja and S. Karuthapandian, J. Alloys Compd., 2017, 701, 562–573 CrossRef.
- G. Dong, B. Du, L. Liu, W. Zhang, Y. Liang, H. Shi and W. Wang, Appl. Surf. Sci., 2016, 399, 86–94 CrossRef.
- S. Pal, S. Maiti, U. N. Maiti and K. K. Chattopadhyay, CrystEngComm, 2015, 17, 1464–1476 RSC.
- G. Dawson, W. Zhoub and R. Blackley, Phys. Chem. Chem. Phys., 2011, 13, 20923–20926 RSC.
- M. Fricke, A. Voigt, P. Veit and K. Sundmacher, Ind. Eng. Chem. Res., 2015, 54(42), 10293–10300 CrossRef CAS.
- S. Jinfang, B. Ni, J. Zhang, C. Wu, D. Cheng, Y. Chi, H. Wang, M. Wang and Z. Zhao, Metals, 2019, 9, 341 CrossRef.
- B. Sridharan, K. Uma, P. Guan-Ting, T. Yang and S. Ramaraj, Materials, 2018, 11, 1030 CrossRef PubMed.
- M. Basu, N. Garg and A. K. Ganguli, J. Mater. Chem. A, 2014, 2, 7517–7525 RSC.
- J. Yu, S. Zhuang, X. Xu, W. Zhu, B. Feng and J. Hu, J. Mater. Chem. A, 2015, 3, 1199–1207 RSC.
- N. Widiarti, J. K. Sae and S. Wahyuni, IOP Conf. Ser.: Mater. Sci. Eng., 2017, 172, 012036 Search PubMed.
- L. G. Mar, P. Y. Timbrell and R. N. Lamb, Thin Solid Films, 1993, 223, 341–347 CrossRef CAS.
- S. Luo, T.-D. Nguyen-Phan, A. C. Johnston-Peck, L. Barrio, S. Sallis, D. A. Arena and S. Kundu, J. Phys. Chem. C, 2015, 119, 2669–2679 CAS.
- P. Wenqin, Q. Shengchun, C. Guangwei and W. Zhanguo, Cryst. Growth Des., 2006, 6, 1518–1522 CrossRef.
- D. Zhang, X. Liu, H. Wan, N. Zhang, S. Liang, R. Ma and G. Qiu, ACS Sustainable Chem. Eng., 2017, 5(7), 5869–5879 CrossRef CAS.
- A. Phuruangrat, O. Yayapao, T. Thongtem and S. Thongtem, J. Nanomater., 2014, 1–9 Search PubMed.
- J.-X. Sun, Y.-P. Yuan, L.-G. Qui, X. Jiang, A.-J. Xie, Y.-H. Shen and J.-F. Zhu, Dalton Trans., 2012, 41, 6756–6763 RSC.
- A.-J. Simamora, T.-L. Hsiung, F.-C. Chang, T.-C. Yang, C.-Y. Liao and H. P. Wang, Int. J. Hydrogen Energy, 2012, 37, 13855–13858 CrossRef CAS.
- Y. Wen, H. Ding and Y. Shan, Nanoscale, 2011, 3, 4411–4417 RSC.
- R. Miao, Z. Luo, W. Zhong, S.-Y. Chen, T. Jiang, B. Dutta, Y. Nasr, Y. Zhang and S. L. Suib, Appl. Catal., B, 2016, 189, 26–38 CrossRef CAS.
- A. K. Kole, C. S. Tiwary and P. Kumbhakar, CrystEngComm, 2013, 15, 5515–5525 RSC.
- S. Baruah, R. F. Rafique and J. Dutta, Nano, 2008, 03, 399 CrossRef CAS.
- X. Liu, X. Wang, H. Li, J. Li, L. Pan, J. Zhang, G. Min, Z. Sun and C. Sun, Dalton Trans., 2015, 44, 97–103 RSC.
- J. T. Adeleke, T. Theivasanthi, M. Thiruppathi, M. Swaminathan, T. Akomolafe and A. B. Alabi, Appl. Surf. Sci., 2018, 455, 195–200 CrossRef CAS.
- M. M. Mohamed, M. A. Ghanem, M. Khairy, E. Naguib and N. H. Alotaibi, Appl. Surf. Sci., 2019, 487, 539–549 CrossRef CAS.
- Y. Wang, S. Lany, J. Ghanbaja, Y. Fagot-Revurat, Y. P. Chen, F. Soldera, D. Horwat, F. Mücklich and J. F. Pierson, Phys. Rev. B, 2016, 94(24), 245418 CrossRef.
| This journal is © The Royal Society of Chemistry 2021 |

