
 Open Access Article
 This Open Access Article is licensed under a Creative Commons Attribution-Non Commercial 3.0 Unported Licence
A high performance barium-promoted cobalt catalyst supported on magnesium–lanthanum mixed oxide for ammonia synthesis
Hubert Ronduda a,
Magdalena Zyberta,
Wojciech Patkowskia,
Andrzej Ostrowskia,
Przemysław Jodłowskib,
Damian Szymańskic,
Leszek Kępińskic and
Wioletta Raróg-Pilecka*a
a,
Magdalena Zyberta,
Wojciech Patkowskia,
Andrzej Ostrowskia,
Przemysław Jodłowskib,
Damian Szymańskic,
Leszek Kępińskic and
Wioletta Raróg-Pilecka*a
aWarsaw University of Technology, Faculty of Chemistry, Noakowskiego 3, 00-664, Warsaw, Poland
bCracow University of Technology, Faculty of Chemical Engineering and Technology, Warszawska 24, 31-155, Kraków, Poland
cInstitute of Low Temperature and Structure Research, Polish Academy of Sciences, Okólna 2, 50-950, Wrocław, Poland
First published on 15th April 2021
Abstract
Ammonia synthesis was performed over a barium-promoted cobalt catalyst supported on magnesium–lanthanum mixed oxide. The rate of NH3 formation over this catalyst was about 3.5 times higher than that over the unpromoted catalyst at 9 MPa and 400 °C. Furthermore, no sign of thermal deactivation was observed during long-term overheating at 600 °C for 360 h. The results of physicochemical studies, including XRPD, DRIFTS, H2-TPD, CO2-TPD, Nads + H2 TPSR and kinetic analysis, revealed that the addition of Ba promoter increased the surface basicity of the catalyst and modified the adsorption properties of the Co surface towards H2 and NH3. The decreased adsorption strength of the corresponding sites towards hydrogen and ammonia resulted in greater availability of active sites in the Ba-promoted cobalt catalyst. These characteristics are considered to have a profound effect on the performance of this catalyst in NH3 synthesis.
Introduction
The catalytic synthesis of ammonia, which sustains the global food supply chain for about 40% of the world's population, is one of the most important inventions of the twentieth century.1,2 Moreover, ammonia is a very important feedstock for the chemical industry; it is also considered as an energy carrier because it has high energy density (12.8 GJ m−3) and high hydrogen-storage capacity (17.8 wt%) and is liquified at room temperature.3During the past century, only the Haber–Bosch process has been successfully employed for ammonia synthesis. In this process, a magnetite-based iron catalyst is used. Despite its many virtues, such as long lifespan, high mechanical strength and relatively low cost, its activation requires high temperatures (>450 °C) and high pressures (>20 MPa), leading to remarkable energy consumption, i.e. 1–2% of the annual global energy production.4–6 Therefore, several attempts to develop a new ammonia synthesis catalyst operating effectively under lower temperature and pressure have been made in last decades. Great interest has been given to supported ruthenium catalysts. Ruthenium catalyst supported on carbon promoted with alkali-metal ions, which is known to be a second-generation catalyst, was introduced industrially in the Kellogg's Advanced Ammonia Process (KAAP) in 1992. This ruthenium catalyst is about one order of magnitude more active than the iron catalyst and operates effectively at pressures of 7–10.5 MPa.7,8 However, the industrial application of this catalyst is limited due to its poor stability (easy sintering of Ru nanoparticles),6 strong affinity towards hydrogen and the high price of ruthenium because of the very low crustal abundance of this element.8 To overcome these drawbacks, ruthenium catalysts using nitrides,9,10 perovskites,2,7,11,12 zeolites,13 and rare-earth metal oxides3,4,14–19 as supports were developed and presented as alternatives to the carbon support. Although they operated stably at thermodynamically favourable conditions, their long-term economic success was questionable due to ruthenium price fluctuations.
As an alternative to the iron and ruthenium catalysts that have been successfully applied in ammonia synthesis plants, cobalt catalysts appear to be promising. Because of their high activity and long lifespan, Co catalysts are suitable catalyst systems for NH3 synthesis.5,6,20–24 Recently, we revealed that a Ba-promoted cobalt catalyst supported on magnesium–lanthanum mixed oxide is an efficient catalyst for ammonia synthesis.23 The study investigated the kinetics of NH3 synthesis over the Ba-promoted cobalt catalyst and a well-known iron catalyst under various reaction conditions. Under all conditions investigated, it was found that the Co catalyst was much more active, i.e. from 2 to 5 times (depending on the conditions) more than the Fe catalyst, indicating its potential as a new catalyst system. Moreover, as listed in Table 1, compared with some other reported catalysts, such as supported Ru catalysts, the Ba + Co/Mg–La catalyst was found to be a valuable alternative. The activity of this catalyst was only 1.4 times lower than that of the Ba–K–Ru/C catalyst. This indicates that the Ba-promoted cobalt catalyst is competitive with the thoroughly investigated Fe and Ru catalysts, and a switch to this kind of catalyst can occur in the future.
| Catalyst | Active metal loading (wt%) | T (°C) | P (MPa) | V0a (L h−1) | rNH3 (gNH3 gcat−1 h−1) | Ref. |
|---|---|---|---|---|---|---|
| a Total flow rate of the inlet gas, i.e. H2 and N2 gas (H2/N2 = 3). | ||||||
| FeOOH–K/Al2O3 | 25 | 500 | 9 | 12 | 0.56 | 28 |
| Fe-cat | 62 | 400 | 9 | 70 | 1.61 | 25 |
| Ru/CeO2-r | 10 | 400 | 10 | 70 | 1.96 | 29 |
| Ba–Ru/AC-G | 10 | 400 | 10 | 70 | 5.32 | 27 |
| Ba–K–Ru/C | 10 | 400 | 10 | 70 | 6.39 | 1 |
| Co–Ba/C | 10 | 400 | 9 | 70 | 3.72 | 21 |
| Co/CeO2-a | 10 | 430 | 10 | 72 | 1.46 | 26 |
| Ba + Co/Mg–La | 34 | 400 | 9 | 70 | 4.68 | 25 |
In the present work, we examined the effect of barium addition on the activity in NH3 synthesis of the Ba-promoted cobalt catalyst supported on magnesium–lanthanum mixed oxide. We provided an insight into the role of barium in the enhancement of the activity of this catalyst in comparison to the unpromoted catalyst. We hope that our research will not only be useful for the design of ammonia synthesis catalysts operating under environmentally benign conditions but will also be helpful to provide additional insight into the promotional effect of barium on various catalysts for ammonia synthesis.
Experimental section
Support and catalyst preparation
Magnesium–lanthanum mixed oxide (Mg/La molar ratio of 7) was synthesized by a co-precipitation method at high super-saturation conditions.23 A solution containing potassium hydroxide (pure p.a., POCH) and potassium carbonate (pure p.a., POCH) was added dropwise to a solution containing magnesium and lanthanum nitrates up to pH 11 (at 30 °C under vigorous stirring). After precipitation, the slurry was aged at 65 °C for 18 h, cooled to room temperature, filtered and washed with distilled water to neutral pH 7. Then, the precipitate was dried at 120 °C (18 h) and calcined at 450 °C for 18 h in static air.The precursors of the supported Co catalysts of the nominal cobalt content equal to 35 wt% were obtained by wet impregnation of MgO–La2O3 mixed oxide, followed by solvent evaporation, drying at 120 °C for 18 h and calcination in static air at 500 °C for 18 h. The Ba-promoted cobalt catalyst precursor of the nominal content of barium equal to 3.5 wt% was prepared by wet impregnation of the calcined Co catalyst precursor with an aqueous solution of barium nitrite (pure p.a., Pfaltz & Bauer) followed by solvent evaporation and drying at 120 °C for 18 h. The precursors were pressed into cylindrical pellets, crushed and sieved to particles with sizes between 0.2 and 0.63 mm. The thus-obtained samples were denoted as Co/Mg–La and Ba + Co/Mg–La, respectively. The element contents in the catalyst precursors are presented in Table 2.
| Catalyst | Co contenta (wt%) | Ba contenta (wt%) | SBETb (m2 g−1) | Vpc (mL g−1) | FEe (%) | dH2f (nm) | dXRDg (nm) | Density of basic sitesh (μmol m−2) |
|---|---|---|---|---|---|---|---|---|
| a The Co and Ba content in the catalyst precursors determined by ICP-OES analysis.b Estimated by BET method.c Estimated by BJH method.d Estimated for the catalysts (i.e. in the reduced forms).e FE, fraction exposed calculated based on the number of surface Co atoms and the total number of Co atoms in the sample.f dH2, average cobalt particle size calculated based on FE.g Calculated by using Scherrer's equation.h Calculated by using the amount of CO2 desorbed and specific surface area of the catalysts after the hydrogen activation. | ||||||||
| Ba + Co/Mg–La | 34.1 | 3.4 | 32.4 (29.3)d | 0.15 (0.25)d | 3.9 | 32 | 21 | 7.4 |
| Co/Mg–La | 36.0 | — | 36.1 (34.9)d | 0.18 (0.23)d | 4.0 | 31 | 17 | 5.8 |
Catalyst characterization
The specific surface areas and total pore volumes of the prepared samples were determined using N2 physisorption measurements in a Micromeritics ASAP 2020 instrument. Prior to analysis, the samples were degassed under vacuum at 90 °C for 1 h and at 150 °C for 4 h. To determine the specific surface areas and total pore volumes of the catalysts in the reduced form, the samples were also subjected to an in situ reduction process in the same ASAP 2020 instrument at 600 °C for 18 h using H2 flow (20 mL min−1). Then, the samples were degassed under vacuum at 150 °C for 2 h and N2 physisorption measurements were performed. The experimental uncertainty for the determination of the specific surface areas and total pore volumes was ±1%.The XRPD patterns were recorded on a Bruker D8 Advance diffractometer equipped with a LYNXEYE position-sensitive detector using Cu-Kα radiation (λ = 0.15418 nm). The data were collected in the Bragg–Brentano (θ/θ) horizontal geometry (flat reflection mode) between 20° and 70° (2θ) in a continuous scan using 0.03° steps for 960 s per step under standard laboratory conditions (temperature and relative humidity). Using the Scherrer equation (k = 0.89), the average cobalt crystallite size was calculated from the full width half maximum (FWHM) of the Co (002) peak located at 2θ = 44.3°.
The diffuse reflectance Fourier transform spectroscopy (DRIFTS) measurements were performed using a Thermo FTIR iS10 spectrometer equipped with an MCT detector and DRIFT high-temperature reaction chamber (Harrick Scientific Co.). The DRIFT analyses were performed by averaging 128 scans with 4 cm−1 resolution. The DRIFT spectra of the catalyst precursors were obtained under 50 mL min−1 Ar flow at ambient conditions. The reduction of the catalyst precursors was performed under 50 mL min−1 of a 5 vol% H2/N2 mixture at 600 °C for 3 h; the temperature was subsequently decreased to 150 °C, and the spectra of the reduced catalysts were taken under dehydrated conditions at 150 °C in a 50 mL min−1 Ar flow.
The morphologies of the cobalt catalysts in the precursor and reduced forms were determined with a field emission scanning electron microscope (FEI Nova NanoSEM 230).
The H2 temperature-programmed reduction (H2-TPR), H2 temperature-programmed desorption (H2-TPD), temperature-programmed surface reaction of Nads with H2 (Nads + H2 TPSR) and CO2 temperature-programmed desorption (CO2-TPD) were performed using a Micromeritics AutoChem 2920 instrument equipped with a thermal conductivity detector. During the hydrogen temperature-programmed reduction (H2-TPR) measurements, the catalyst precursor sample of 0.2 g was heated to 900 °C at a constant rate of 5 °C min−1 in a 10 vol% H2/Ar mixture flow (40 mL min−1). For the H2-TPD measurements, the catalyst precursor sample of 0.5 g was reduced at 600 °C for 18 h in H2 flow (40 mL min−1). The H2 adsorption was carried out at 150 °C for 15 min, and it was continued while cooling to 0 °C and subsequently for 15 min at 0 °C. After purging with argon at 0 °C for 1 h, the catalyst was heated to 900 °C at a constant rate of 5 °C min−1 in argon flow (40 mL min−1). Based on the amount of H2 desorbed, the dispersion of cobalt (FE, fraction exposed) and the average cobalt particle size were calculated.30,31 The uncertainty for the determination of the amount of H2 desorbed, and thus the dispersion of cobalt and its average particle size, was ±3%. For the Nads + H2 TPSR measurements, the catalyst precursor sample of 0.5 g was reduced at 600 °C for 18 h in H2 flow (40 mL min−1). The N2 adsorption was carried out at 200 °C for 14 h, and it was continued while cooling to 0 °C. After purging with helium at 0 °C for 1 h, the catalyst was heated to 800 °C at a constant rate of 5 °C min−1 in hydrogen flow (40 mL min−1). For the CO2-TPD measurements, the catalyst precursor sample of 0.5 g was reduced at 600 °C for 18 h in H2 flow (40 mL min−1). The CO2 adsorption was carried out at 40 °C for 2 h. After rinsing with helium at 40 °C for 1 h, the catalyst was heated to 900 °C at a constant rate of 5 °C min−1 in the helium flow (40 mL min−1). The uncertainty for the determination of the amount of CO2 desorbed was ±3%. A detailed description of the procedure of all the temperature-programmed measurements can be found elsewhere.23,25
Evaluation of the catalytic performance
Catalytic activity measurements in the synthesis of ammonia were performed in a flow tubular reactor. A detailed description of the experimental setup has been presented elsewhere.25,32,33 Before the measurements, the catalyst precursors were activated under atmospheric pressure in the reacting gas mixture (H2/N2 = 3) according to the procedure: 480 °C (48 h) → 520 °C (24 h) → 550 °C (24 h) → 600 °C (48 h). The activity measurements were performed under steady-state conditions of temperature (400 °C), pressure (9 MPa), total flow rate of the inlet gas (70 L h−1), and NH3 concentration (0–10 mol%). The increment of the NH3 concentration was determined and used for the calculation of the NH3 synthesis rate (rNH3) corresponding to the average NH3 concentration in the gas phase (aNH3) based on eqn (1).32–34
 | (1) |
The reaction kinetics were analysed by applying the modified power-law rate equation25 (eqn (2)):
 | (2) |
 is the rate constant for the forward reaction, pN2, pH2, and pNH3 are the partial pressures of N2, H2 and NH3, respectively, n, p, q are the reaction orders with respect to N2, H2 and NH3, respectively, and KP is the equilibrium constant. Assuming that the rate-determining step of ammonia synthesis is N2 dissociation,35 the reaction order with respect to N2 is unity (n = 1). Thus, based on fitting the experimental data to eqn (2), the reaction orders with respect to H2 and NH3 were determined.
Results and discussion
Evaluation of the catalytic performance
Fig. 1 displays the ammonia synthesis rate (rNH3) as a function of time on stream over the supported Co catalysts. Under the same reaction conditions, the NH3 synthesis rate over Ba + Co/Mg–La was ca. 3.5 times higher than that of Co/Mg–La. As shown in Fig. 1, the long-term overheating, i.e. 600 °C for 360 h, revealed no sign of thermal deactivation. The activities decreased by ca. 2% for both the catalysts, indicating their excellent thermal resistance, which is a crucial factor affecting the application potential of catalyst systems.35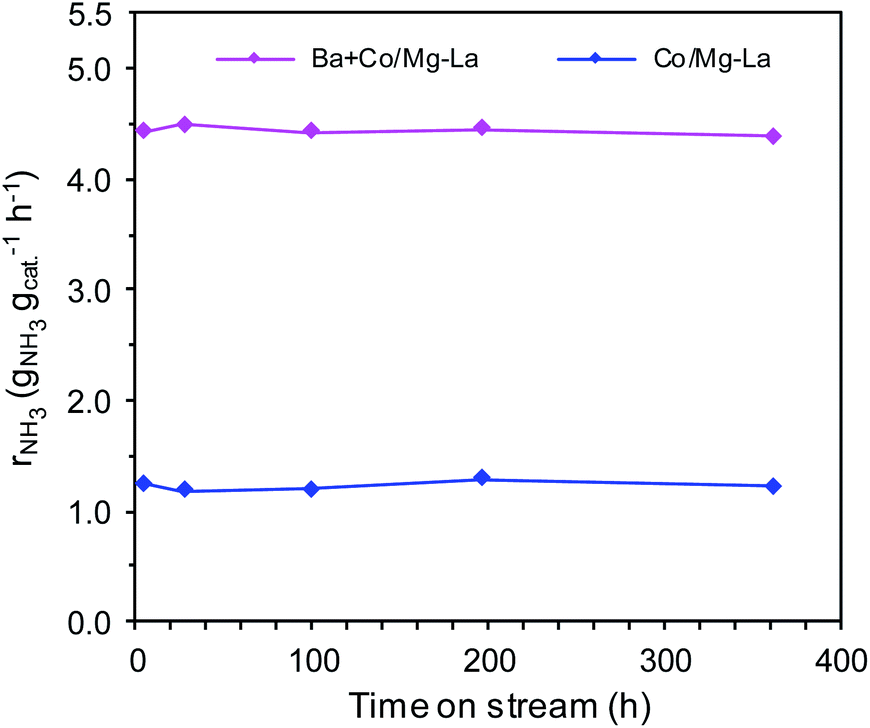 | ||
| Fig. 1 Ammonia synthesis rate (rNH3) as a function of time on stream over the supported Co catalysts (activity measurement conditions: 400 °C, 9 MPa, H2/N2 = 3, 70 L h−1; heat-treatment (overheating) conditions: 600 °C, 0.1 MPa, H2/N2 = 3, 30 L h−1). | ||
The superior activity of the Ba-promoted cobalt catalyst in comparison to other catalysts (Table 1, Fig. 1) became the motivation to undertake extensive research to identify the factors responsible for its enhanced activity in the ammonia synthesis reaction.
N2 physisorption
Fig. 2 presents the adsorption–desorption isotherms and corresponding pore size distribution curves for the supported Co catalysts in the precursor and reduced forms. Both the catalyst precursors (Fig. 2a) exhibited type IV adsorption isotherms with H3 type hysteresis loops. The hysteresis loop of type H3 indicates the presence of pores formed from non-parallel planes, i.e. slit-shaped pores.36–38 The pore size distribution curves revealed that the catalyst precursors were mesoporous and characterized by a unimodal pore size distribution (pore diameters from 2 to 50 nm). After the hydrogen activation (Fig. 2b), the types of the adsorption–desorption isotherms remained unchanged. However, both the catalysts were characterized by a broader pore size distribution (pore diameters from 2 to 90 nm) in comparison to the catalyst precursors.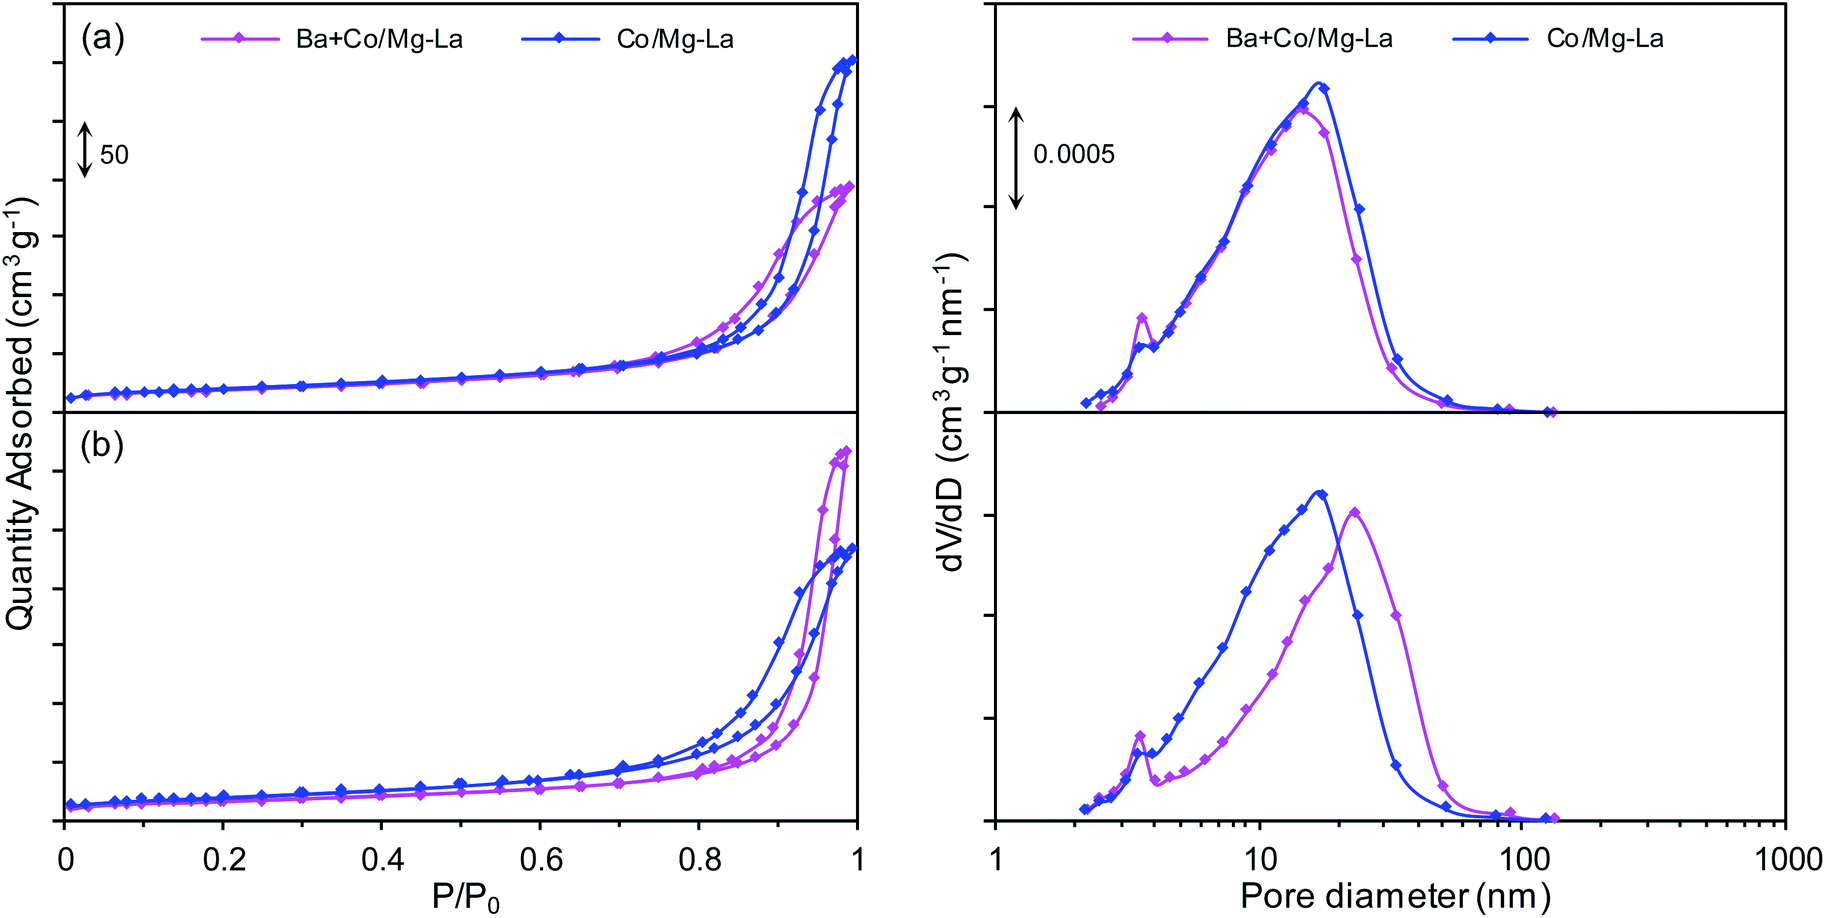 | ||
| Fig. 2 Nitrogen adsorption–desorption isotherms (left) and corresponding pore size distribution curves (right) for the supported Co catalysts in the precursor (a) and reduced (b) forms. | ||
The specific surface areas (SBET) and total pore volumes (Vp) of both precursors were in the ranges of 32–36 m2 g−1 and 0.15–0.18 mL g−1, respectively (Table 2). The lower BET surface area of Ba + Co/Mg–La could be due to the introduction of the promoter precursor, i.e. barium nitrite, into the Co catalyst precursor by the wet impregnation method. As the impregnating salt solution penetrated the porous structure of the precursor, it blocked its pores, resulting in decreases of the values of SBET and Vp. Note also that for both the precursors, the reduction process led to a decrease of the BET area and an increase of the pore volume. The decreasing of the specific surface area was due to the sintering of the catalyst particles during the high-temperature heat treatment, whereas the increase of the total pore volume was due to the formation of larger pores (Fig. 2b) as gaseous substances (water vapor, carbon dioxide) were released during the reduction process.
XRPD
Fig. 3 depicts the XRPD patterns of the supported Co catalyst both in the precursor and reduced forms. The XRPD patterns of the precursors (Fig. 3a) demonstrated the presence of magnesium oxide (MgO, PDF# 04-0829), hexagonal lanthanum oxide carbonate(II–La2O2CO3, PDF# 37-0804), and cobalt(II,III) oxide (Co3O4, PDF# 42-1467). In the case of the Ba + Co/Mg–La precursor, barium carbonate (BaCO3, PDF# 41-0373) was identified. Its presence could be due to the reaction between barium nitrite and carbon dioxide (contained in air) during the drying step.39 The XRPD patterns of the catalysts after the hydrogen activation (Fig. 3b) revealed the occurrence of magnesium oxide (MgO, PDF# 04-0829), hexagonal lanthanum oxide (La2O3, PDF# 05-0602) and face-centred cubic (FCC) cobalt (Co FCC, PDF# 15-0806). Note that for the Ba-promoted cobalt catalyst, there were no reflections ascribed to the phases of the barium compounds. According to reports,40,41 the lack of reflections of Ba-bearing phases indicates that the barium precursor transforms during the reduction (activation) into a form that is undetectable by XRPD (e.g. amorphous BaOx species). As shown in Table 2, the calculated average Co crystallite sizes (dXRD) were nearly the same for both the catalysts. This indicates that the presence of the Ba promoter effectively stabilizes the sizes of the Co nanoparticles in the catalysts. The same effect was reported by other researchers42,43 when performing ammonia synthesis over Ba-promoted ruthenium catalysts.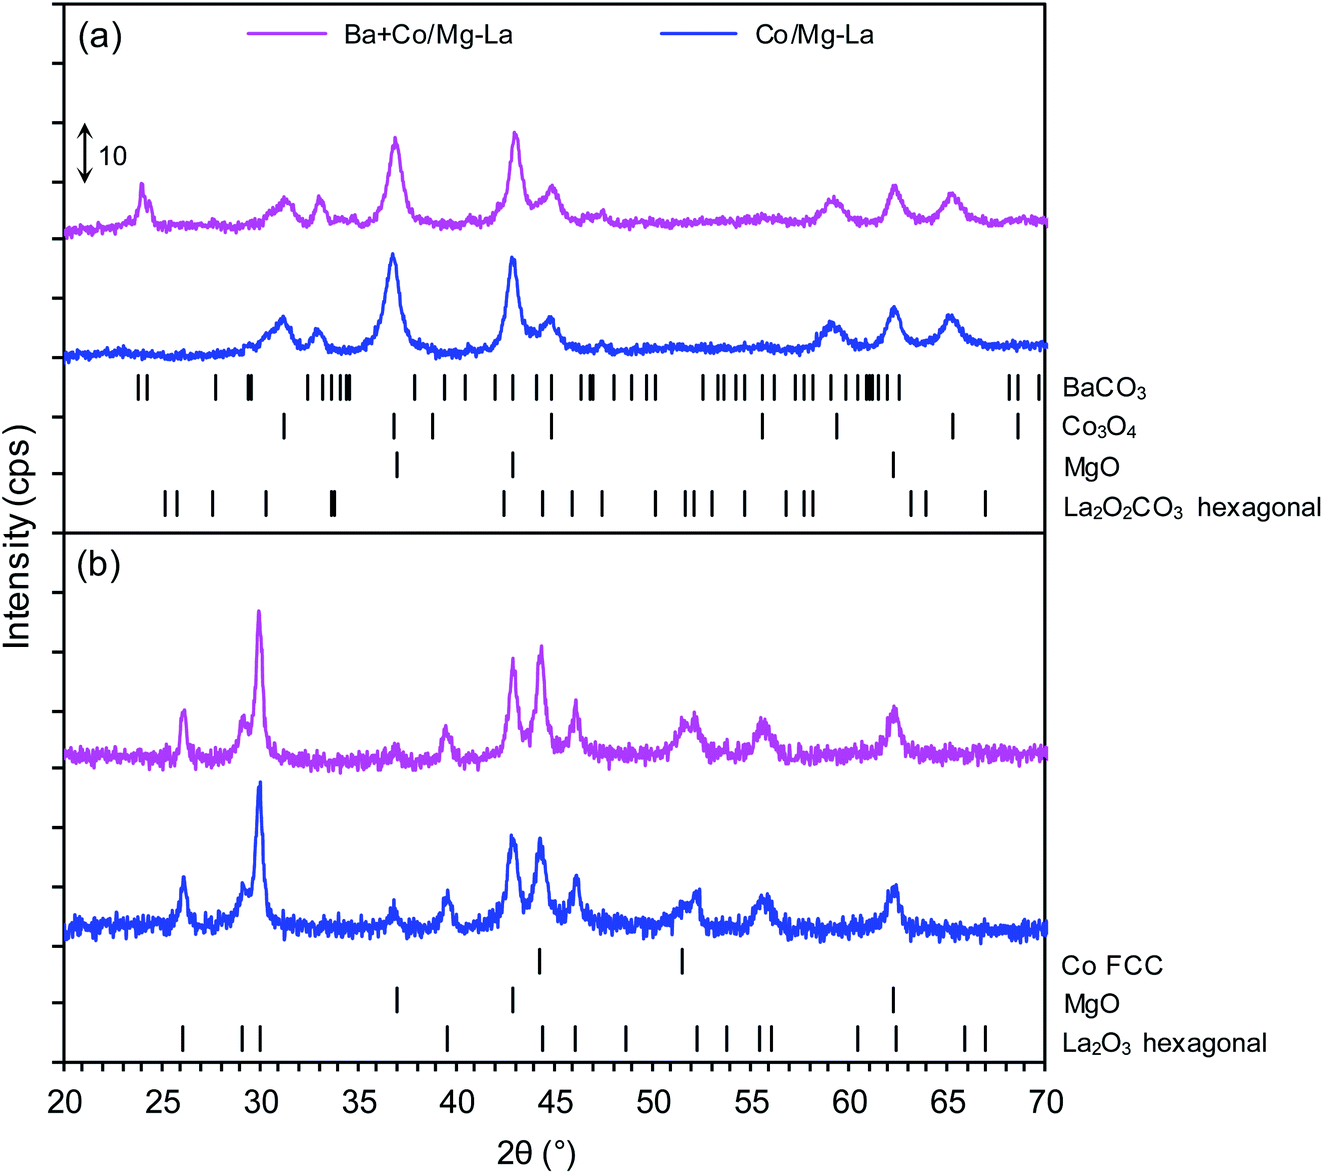 | ||
| Fig. 3 XRPD patterns of the supported Co catalysts in the precursor (a) and reduced (b) forms. | ||
DRIFTS
Fig. 4 shows the DRIFTS spectra of the supported Co catalysts in the precursor and reduced forms. The DRIFTS spectra of the precursors shown in Fig. 4a reveal two sharp bands at 3777 and 3697 cm−1, attributed to the OH-stretching vibrations of Mg(OH)2 (formed by the exposure of MgO to the ambient atmosphere). The broad band at 3500–3300 cm−1 was attributed to OH-stretching vibrations of water molecules, while those at 1653 and 1585 cm−1 were attributed to their bending mode.44,45 Several bands at 1448, 1398, 877 and 732 cm−1 were associated with La2O2CO3 species. According to the literature,46 the bands at 1448, 877, and 732 cm−1 can be ascribed to type II (hexagonal) La2O2CO3, while the band at 1398 cm−1 inferred the formation of polydentate carbonates.47 The presence of these species was confirmed by XRPD analysis (Fig. 3a). The DRIFTS spectra of the catalysts after reduction, presented in Fig. 4b, reveal that the bands associated with OH-stretching vibrations of Mg(OH)2 were diminished and additional bands at 1750–1000 cm−1 were observed. The bands at 1511, 1371, 1061, 866 and 731 cm−1 corresponded to type I (tetragonal) or Ia (monoclinic) La2O2CO3 species. This infers that the thermal decomposition of carbonaceous species requires long-term heating. This is because La2O2CO3 is a stable intermediate in the thermal decomposition of lanthanum carbonate, La2(CO3)3.48 A weak band corresponding to adsorbed CO2 was visible at around 2455 cm−1 for the Ba + Co/Mg–La catalyst.47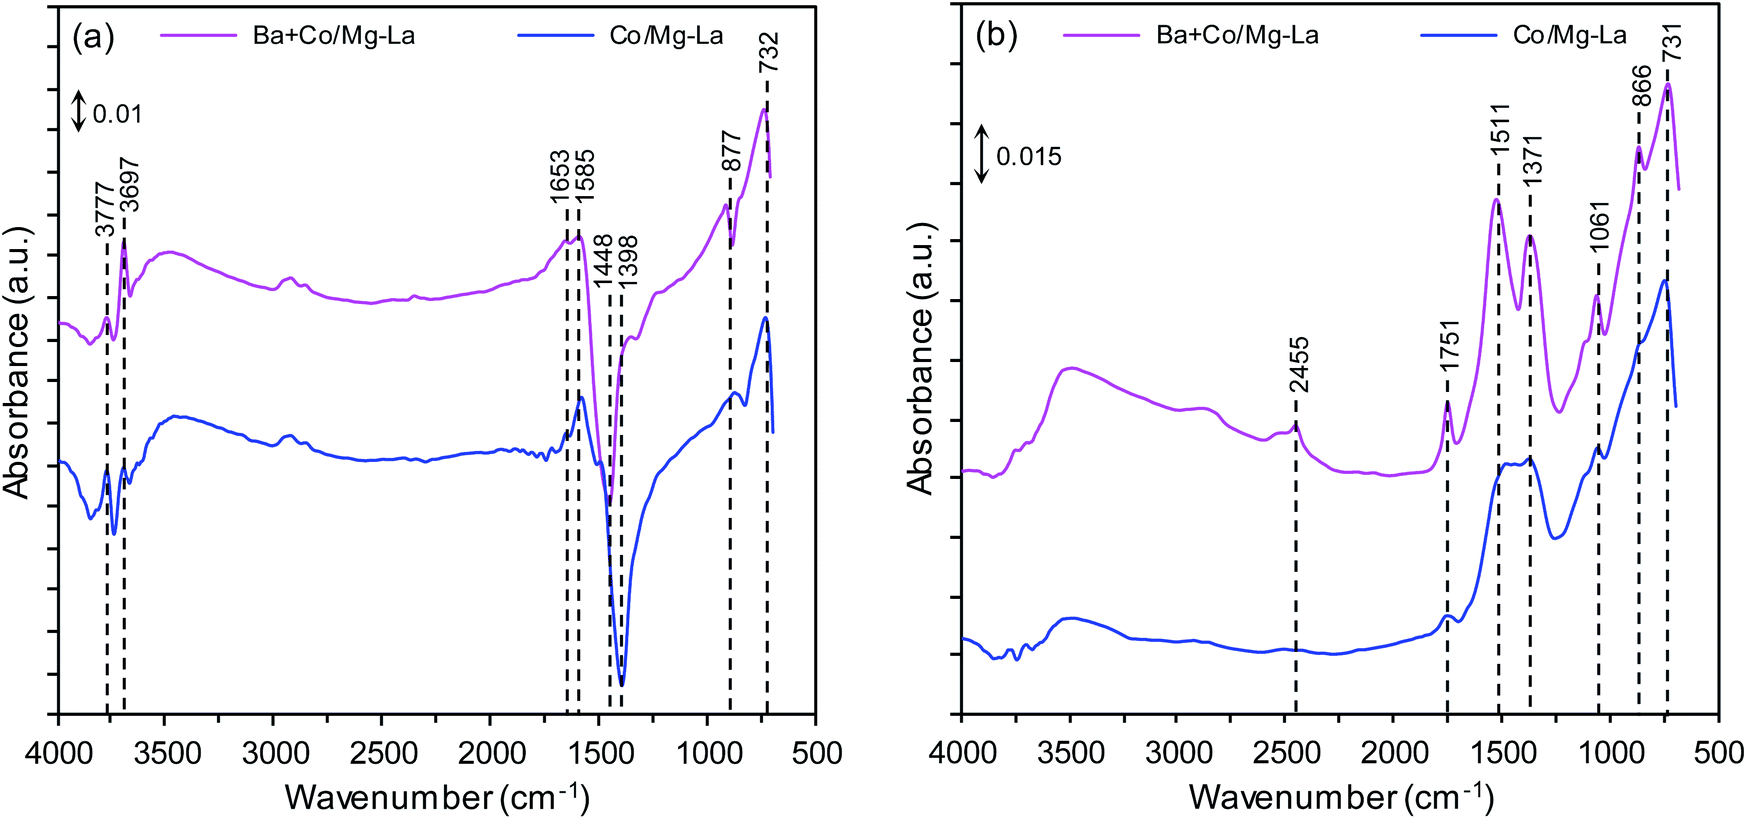 | ||
| Fig. 4 DRIFTS spectra of the supported Co catalyst in the precursor (a) and reduced (b) forms. | ||
H2-TPR
Fig. 5 displays the H2-TPR profiles of the cobalt catalyst precursors. Notably, for both the catalyst precursors, similar reduction characteristics were observed. There were two distinct reduction peaks: the low-temperature peak (LT, 150–400 °C) and high-temperature peak (HT, 400–800 °C). The low-temperature peak was assigned to the reduction of cobalt(II,III) oxide, which occurs in two stages (Co3+ → Co2+ → Co0).49–53 For the Co/Mg–La catalyst precursor, the low-intensity peak at 253 °C was barely distinguishable from the high-intensity peak at 360 °C, suggesting overlapping of these peaks (assigned to the two-stage cobalt(II,III) oxide reduction). According to the reports,23,54,55 the high-temperature broad peak at 400–800 °C was attributed to the thermal decomposition of lanthanum oxide carbonate, La2O2CO3 (identified as the support component, Fig. 3a). In comparison to the Co/Mg–La precursor, the Ba + Co/Mg–La precursor was characterized by the presence of two clear peaks centred at 259 °C and 350 °C, corresponding to the two-stage cobalt(II,III) oxide reduction. In addition to the thermal decomposition of La2O2CO3, as for the Co/Mg–La precursor, the high-temperature peak could be ascribed to the thermal decomposition of barium carbonate, BaCO3 (identified as the Ba promotor precursor, Fig. 3a), which according to a report56 typically occurs at 500–700 °C. | ||
| Fig. 5 H2-TPR profiles of the supported Co catalysts. | ||
SEM-EDS
Fig. 6 depicts the SEM images of the Co catalysts in the precursor and reduced forms. For both the catalyst precursors (Fig. 6a), irregular particles of various shapes and sizes from a few nm up to 1 μm were observed. As shown in the magnified SEM images, the largest particles were, in fact, aggregates of tightly packed small particles (20–100 nm). Comparing the morphologies of the catalysts after the activation, as shown in Fig. 6b, differences are clearly visible. For both the catalysts, the SEM images were similar and evidence the transformation of the large aggregates into agglomerates of less densely packed particles. It appears that the heating of the precursors under H2 atmosphere caused noticeable changes in the morphologies of the catalysts. A more detailed SEM analysis at high magnification revealed that there were two fractions of particles, i.e. spherical with sizes from 20 to 40 nm and larger (ca. 70 nm) with polygon shapes. This corresponds well with the XRPD data, showing close similarity of the diffraction patterns of both the catalysts (Fig. 3). The widths of reflection of various crystalline phases presented in the catalysts were comparable, although they were smaller for La2O3.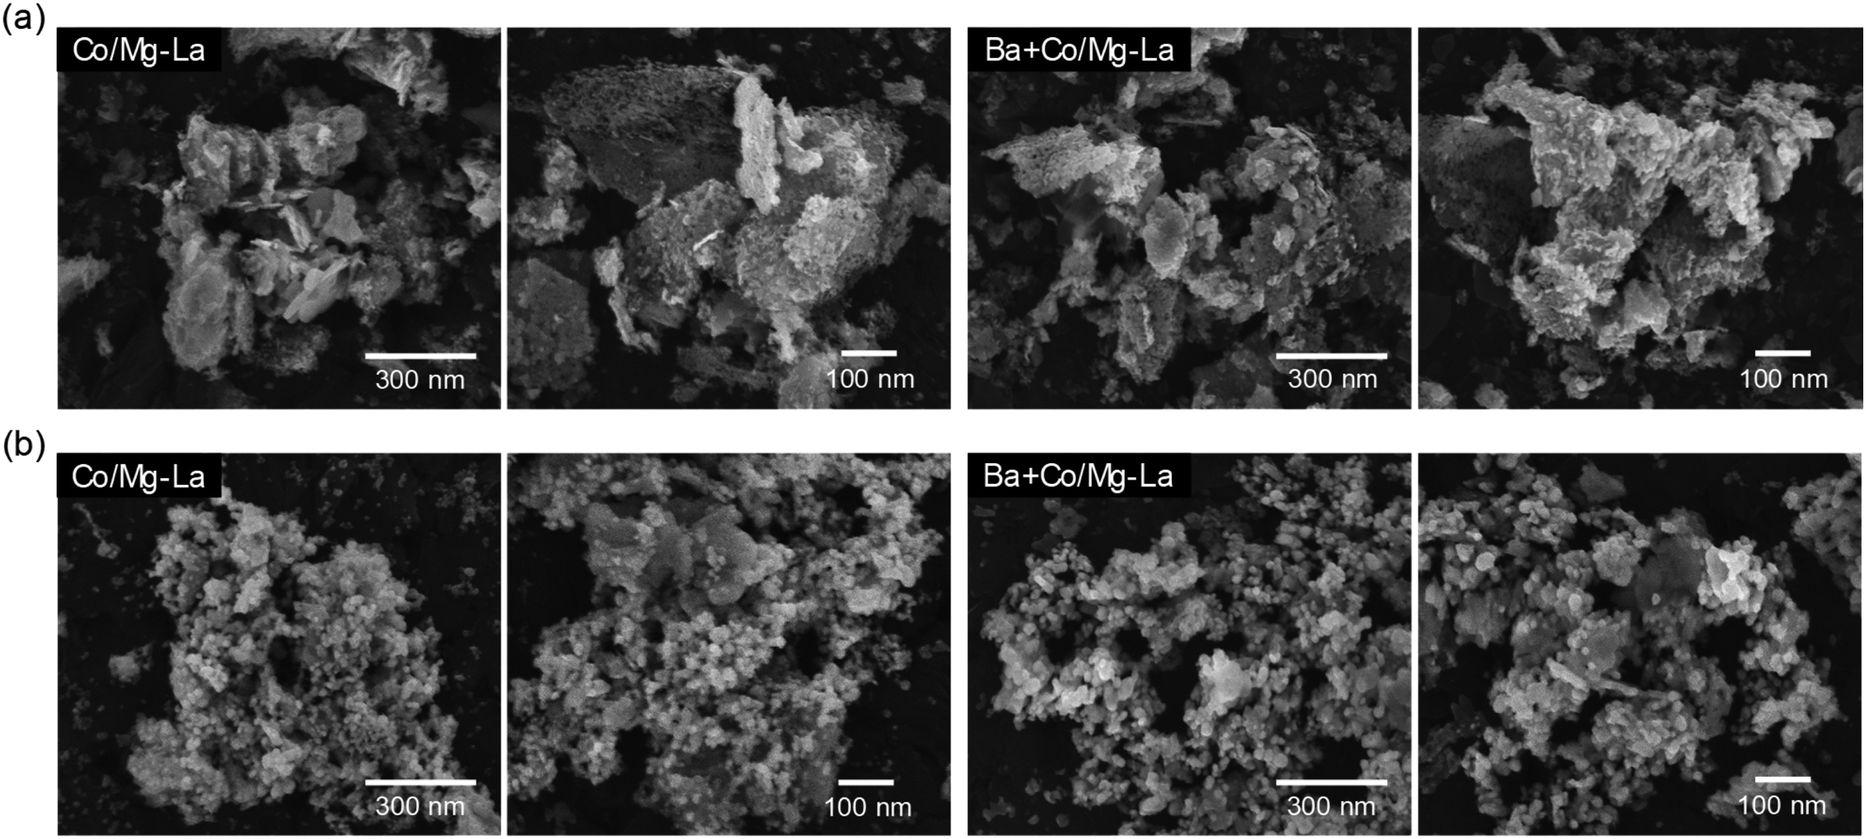 | ||
| Fig. 6 Respective SEM images of the supported Co catalysts in the precursor (a) and reduced (b) forms. | ||
SEM-EDS elemental mapping was performed to identify the distribution of elements on the surfaces of the catalysts in the precursor and reduced forms. The obtained results are presented in Fig. 7. The EDS elemental maps of the surfaces of the catalyst precursors (Fig. 7a) show that the elements, except for oxygen, were not uniformly distributed. The areas rich in lanthanum showed magnesium deficiency and vice versa. This indicates that lanthanum and magnesium formed two separate oxide phases, i.e. magnesium oxide and lanthanum oxide/lanthanum oxide carbonate, whose presence was confirmed by XRPD (Fig. 3). Noticeably, cobalt preferably deposited on magnesium oxide instead of on lanthanum oxide/lanthanum oxide carbonate. Upon reduction (Fig. 7b), the distributions of the elements remained unchanged, although a stronger segregation tendency of barium in the Ba-promoted catalyst was noted.
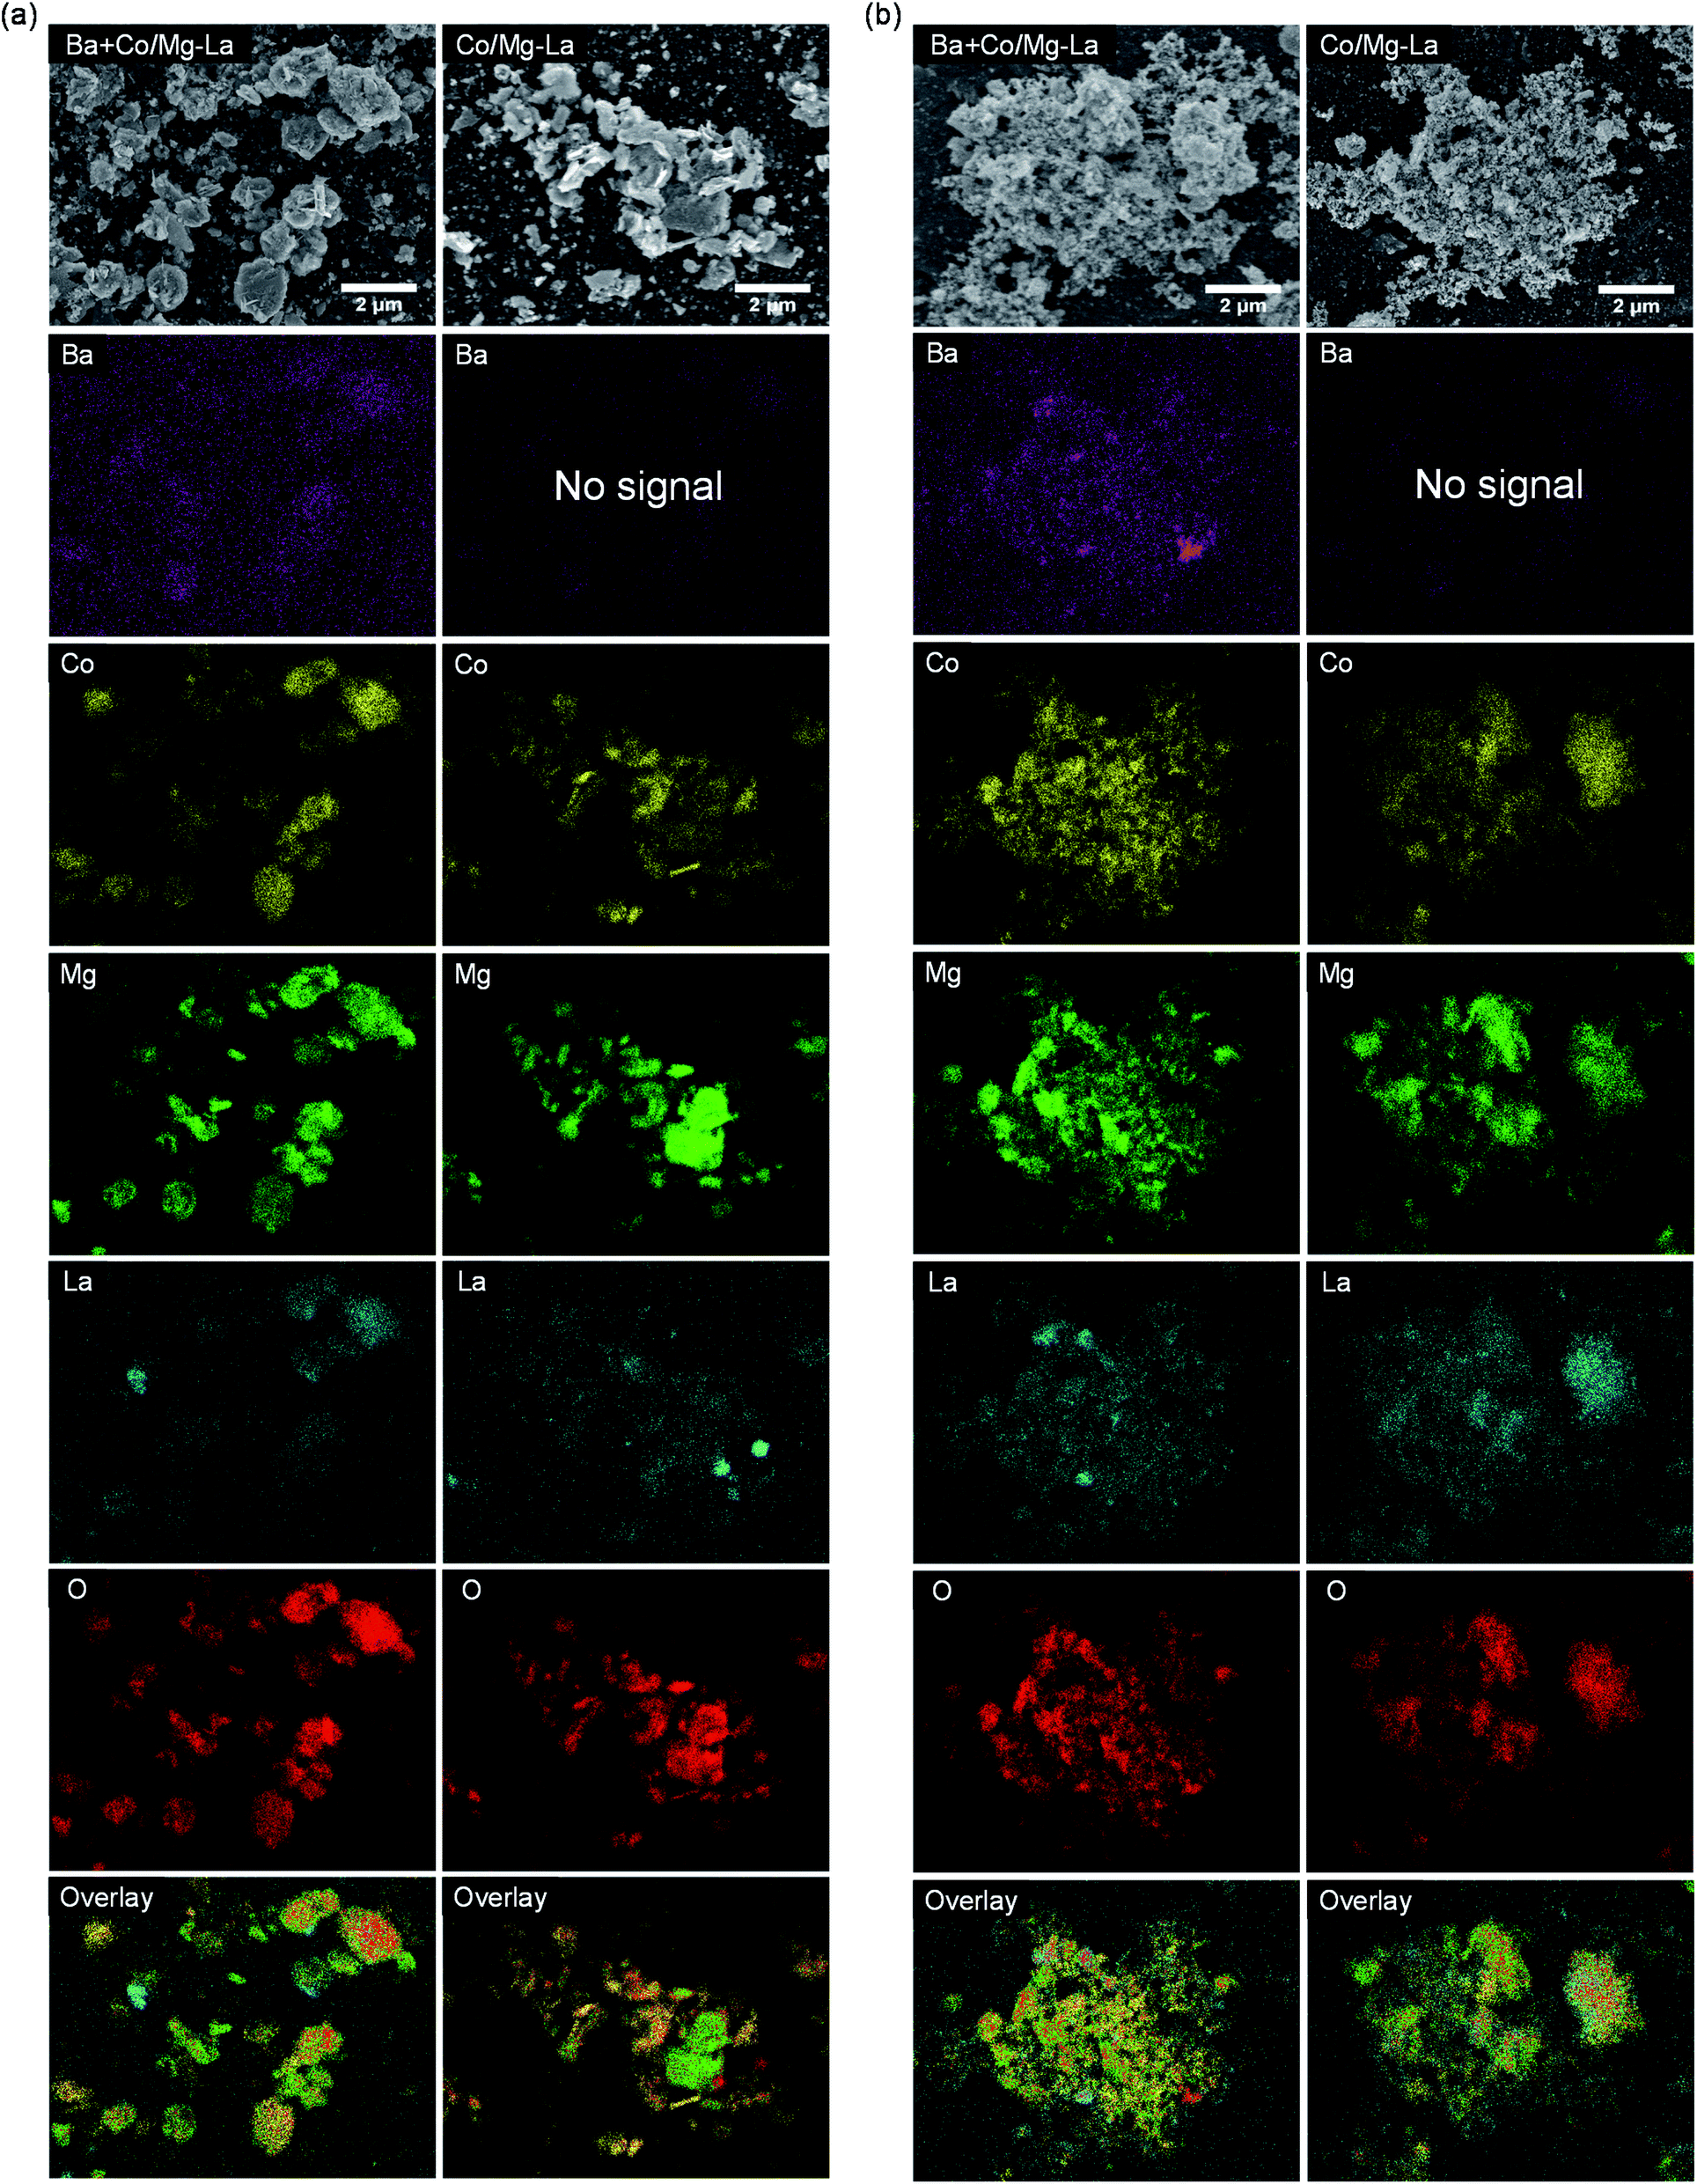 | ||
| Fig. 7 SEM-EDS maps of the element distributions of cobalt (Co), barium (Ba), magnesium (Mg), lanthanum (La) and oxygen (O) on the surface of the supported Co catalysts in the precursor (a) and reduced (b) forms. | ||
CO2-TPD
Fig. 8 shows the CO2-TPD profiles of the cobalt catalysts. Notably, three desorption peaks were distinguished: the low-temperature (<250 °C), medium-temperature (250–550 °C) and high-temperature (>550 °C) peaks, whose presence was associated with the adsorption sites binding carbon dioxide weakly, intermediately and strongly, respectively. According to literature reports,47,57,58 the strength of carbon dioxide–surface interactions reflects the surface basicity. The adsorption sites weakly binding CO2 are associated with Brønsted basicity (hydroxyl groups, OH−), while the medium and strong adsorption sites are assigned to Lewis basicity (oxygen species, e.g. O−, O2−, O22−). However, only Lewis basic sites are able to effectively donate electrons to active metal phase, and subsequent electrons transfer from the metal d-orbitals to the antibonding π* orbitals of N2, facilitating its dissociation by weakening the N![[triple bond, length as m-dash]](https://www.rsc.org/images/entities/char_e002.gif) N bond.35
N bond.35
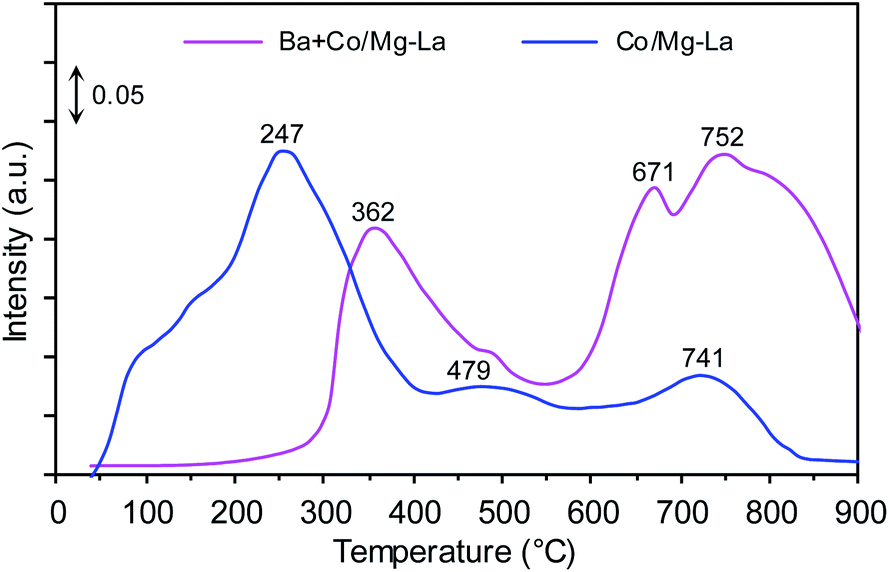 | ||
| Fig. 8 CO2-TPD profiles of the supported Co catalysts. | ||
For the Co/Mg–La catalyst, three desorption peaks were detected. The broad low-temperature peak centred at 247 °C corresponds to the basic sites of magnesium oxide, while the medium-temperature peak at 479 °C was attributed to the adsorbed CO2 on the hexagonal lanthanum oxide.47 The high-temperature peak centred at 741 °C could originate from the interaction of CO2 with cubic La2O3.47,59 In the case of the Ba-promoted catalyst, two desorption peaks were distinguished. The medium-temperature peak at 362 °C corresponded to the basic sites of hexagonal La2O3, while the high-temperature peaks located at 671 and 752 °C could be attributed to the interaction of CO2 with BaO and cubic La2O3, respectively.47,56,59 It is noteworthy that the CO2 desorption peaks in the medium- and high-temperature range originated from the decomposition of carbonaceous species formed by the interaction of carbon dioxide with barium and/or lanthanum oxide. This was because of the high basicity of these oxides.59 As shown in Fig. 8, the addition of Ba promoter drastically diminished the surface basic sites of magnesium oxide. This interesting finding suggests that the magnesium oxide surface rather than the lanthanum oxide surface was primarily covered by barium components. Similar results concerning the preferential deposition of barium components were reported by Bansode et al.,60 who found that the barium compounds predominantly covered an alumina surface and not a copper surface despite high accessibility of the Cu surface. Taking into account that only medium and strong basic sites have the ability to donate electrons to metal atoms,2,53 the strongest surface basicity was exhibited by the Ba-promoted cobalt catalyst. The density of basic sites on this catalyst was 7.4 μmol m−2, ca. 1.3 times higher than that of the unpromoted catalyst, 5.8 μmol m−2 (Table 2). This implies that this difference accounts for the higher activity in NH3 synthesis of Ba + Co/Mg–La than of Co/Mg–La.
H2-TPD
Fig. 9 shows the H2-TPD profiles recorded for the supported Co catalysts. Notably, three H2 desorption peaks were seen: the low-temperature (LT, <250 °C), medium-temperature (MT, 250–550 °C) and high-temperature (HT, >550 °C) peaks were ascribed to the desorption of H2 that was weakly, intermediately and strongly bound to the Co surface, respectively. The two peaks centred at ca. 106 and 756 °C were observed in the H2-TPD curve recorded for Co/Mg–La. According to Wang et al.,6 the presence of the H2 desorption peak above 700 °C is associated with a strong chemisorption state of H2 on the Co surface. These Co active sites, from which hydrogen desorbs at high temperature, are known to be detrimental to the activity of cobalt catalysts for NH3 synthesis.6,23 The strongly chemisorbed hydrogen atoms on the Co surface, for which the activation energy for H2 desorption is high, do not desorb at the reaction temperature of ammonia synthesis and thus are not involved in NH3 synthesis. This effect was also observed by other authors,1,6,61 being most pronounced in Ru catalysts. The addition of Ba promoter shifted the position of the high-temperature peak to a lower temperature (from 756 to 559 °C). Thus, it is reasonable to assume that the addition of Ba leads to a decrease of the adsorption strength of hydrogen on the Co surface. As a result, these hydrogen species are involved in the reaction of NH3 synthesis. This suggests that the addition of Ba promoter plausibly enhances the rate of NH3 formation by changing the chemisorption properties of hydrogen on the Co surface (e.g. creating new sites that are available for the adsorption of H2). A similar phenomenon was recently observed for the Co-supported catalysts; Lin et al.62 found that the addition of Ba promoter on Co/CeO2 changed the adsorption performance of hydrogen.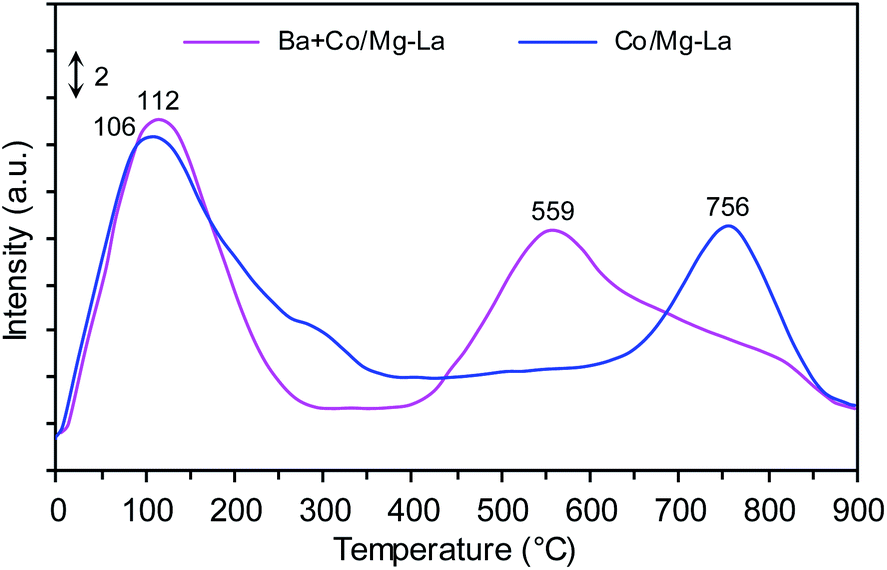 | ||
| Fig. 9 H2-TPD profiles of the supported Co catalysts. | ||
The addition of a low amount of Ba increased the intensity of the H2 desorption peak, and the position shifted to higher temperatures. However, the increase in the Ba loading led to shifts in the position of the H2 desorption peak to higher temperatures. Lin et al.1 also found that the copresence of Ba and K promoters shifted the hydrogen desorption peak to lower temperatures, suggesting that K and Ba can enhance NH3 activity by changing the chemisorption properties of hydrogen.
Based on the total amount of H2 desorbed, the exposed fractions and average particle sizes of Co were determined (Table 2). There were no differences in the calculated values of FE and dH2, revealing that the addition of Ba did not affect the particle size of metallic Co. This corresponds well with the XRPD data (Table 2) and previously published literature.42,43,62 The discrepancy in Co sizes determined by H2-TPD and XRPD was possibly due to the fact that cobalt formed clusters consisting of smaller crystallites. These cobalt crystallites were detectable by XRPD; however, only the external surface area of the clusters was accessible during the sorption of hydrogen molecules.
Nads + H2 TPSR
Fig. 10 depicts the Nads + H2 TPSR profiles recorded for the supported Co catalysts. Two distinct NH3 desorption peaks were recorded for the Co/Mg–La catalyst. The low-temperature (293 °C) and the high-temperature (>800 °C) peaks were due to the desorption of NH3 that was intermediately and strongly bound to the Co active sites, respectively. The presence of the high-temperature desorption peak of NH3 was associated with a strong chemisorption state of NH3 on the catalyst. In addition to the ammonia desorption peak at 279 °C, three desorption peaks at ca. 381, 545 and 622 °C were observed for the Ba + Co/Mg–La catalyst. The peaks at 279, 381 and 545 °C were associated with the desorption of NH3 that was intermediately bound to the surface Co active sites, whereas the peak at 622 °C was due to the strong chemisorption state of NH3 on the catalyst. These ammonia species adsorbed on the catalysts do not desorb at the reaction temperature of NH3 synthesis, thus decreasing the accessibility of the surface Co active sites for the reactant gases (H2 and N2). Note that for the Co/Mg–La catalyst, ammonia was not desorbed completely even above 800 °C. This infers the stronger interaction of ammonia with the Co active sites of Co/Mg–La than with those of Ba + Co/Mg–La. Thus, it is reasonable to assume that the presence of Ba promoter leads to a decrease in the adsorption strength of Co active sites towards ammonia and hence an increase in the number of active sites that are accessible to reactants during the reaction. A similar result was observed by other researchers. Lin et al.61 suggested that the promotion of NH3 activity by potassium was a consequence of the change in the chemisorption properties, i.e. decreasing the adsorption strength of Ru surface atoms towards hydrogen, nitrogen and ammonia.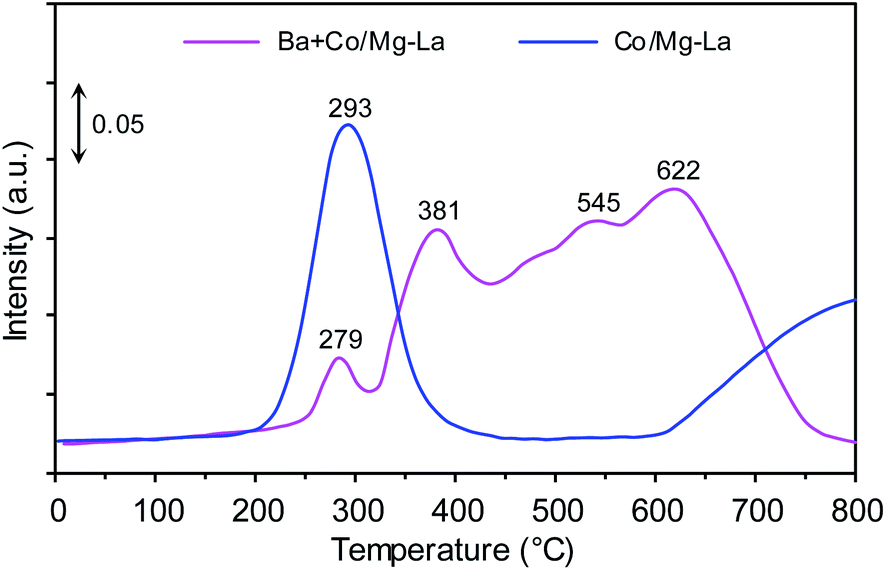 | ||
| Fig. 10 Nads + H2 TPSR profiles of the supported Co catalysts. | ||
Kinetic studies
Fig. 11 shows the dependences of the ammonia synthesis rate (rNH3) on the average NH3 concentration in the gas phase (aNH3), presented as plots of ln![[thin space (1/6-em)]](https://www.rsc.org/images/entities/char_2009.gif) rNH3 versus lnaNH3 for the supported Co catalysts. Notably, for both the catalysts, the rate of NH3 formation decreased with increasing ammonia concentration in the gas phase. This is because the measured NH3 concentrations were near the thermodynamic equilibrium concentration (i.e. aNH3(eq) = 23.4 mol% at 400 °C and 9 MPa). However, at all ammonia concentrations tested, the rates of NH3 formation over Ba + Co/Mg–La were higher than those achieved with Co/Mg–La, indicating a strong promotional effect of barium. Furthermore, the superiority of the Ba-promoted catalyst was more pronounced with increasing NH3 concentration in the gas phase. At low NH3 content (1 mol%), the ammonia synthesis rate of the Ba + Co/Mg–La catalyst was ca. 2.5 times higher than that of the Co/Mg–La catalyst. At high ammonia content (10 mol%), the reaction rate obtained over Ba + Co/Mg–La reached 0.44 gNH3 gcat−1 h−1, >5.8 times the value achieved with the Co/Mg–La catalyst. These results indicate that the rate of NH3 formation over the Ba + Co/Mg–La catalyst was less inhibited by the ammonia product than that over the Co/Mg–La catalyst.
rNH3 versus lnaNH3 for the supported Co catalysts. Notably, for both the catalysts, the rate of NH3 formation decreased with increasing ammonia concentration in the gas phase. This is because the measured NH3 concentrations were near the thermodynamic equilibrium concentration (i.e. aNH3(eq) = 23.4 mol% at 400 °C and 9 MPa). However, at all ammonia concentrations tested, the rates of NH3 formation over Ba + Co/Mg–La were higher than those achieved with Co/Mg–La, indicating a strong promotional effect of barium. Furthermore, the superiority of the Ba-promoted catalyst was more pronounced with increasing NH3 concentration in the gas phase. At low NH3 content (1 mol%), the ammonia synthesis rate of the Ba + Co/Mg–La catalyst was ca. 2.5 times higher than that of the Co/Mg–La catalyst. At high ammonia content (10 mol%), the reaction rate obtained over Ba + Co/Mg–La reached 0.44 gNH3 gcat−1 h−1, >5.8 times the value achieved with the Co/Mg–La catalyst. These results indicate that the rate of NH3 formation over the Ba + Co/Mg–La catalyst was less inhibited by the ammonia product than that over the Co/Mg–La catalyst.
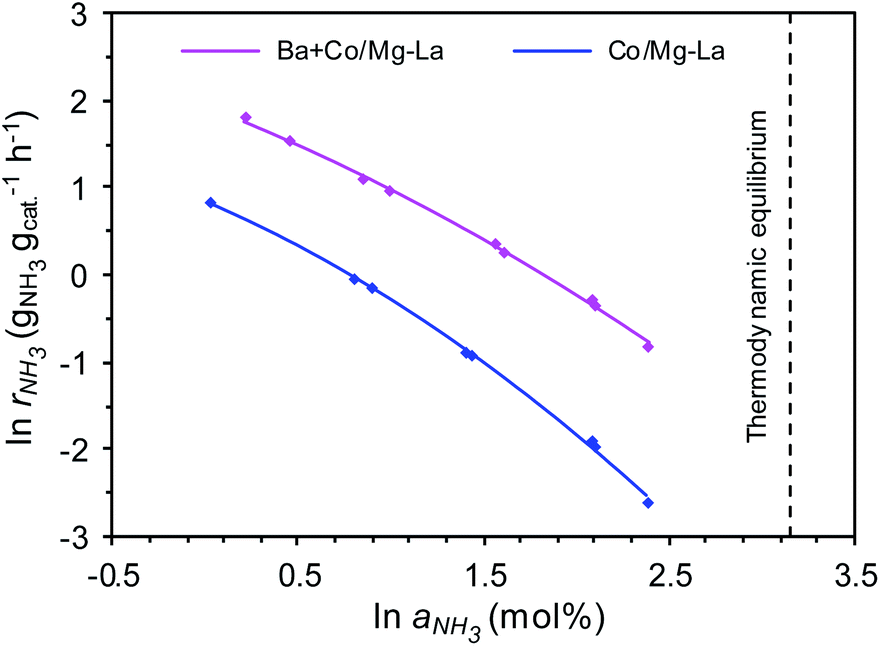 | ||
| Fig. 11 Ammonia synthesis rate as a function of average NH3 concentration in the gas phase (plots of lnrNH3 versus lnaNH3) for the supported Co catalysts (measurement conditions: 400 °C, 9 MPa, H2/N2 = 3, a1 = 0–10 mol%, 70 L h−1). | ||
To gain deeper insight into the behaviour of the catalysts in the ammonia synthesis reaction, kinetic analyses with a power-law rate equation were performed. The calculated values of the reaction orders with respect to H2 (p) and NH3 (q) determined from eqn (2) are presented in Table 3. The reaction order with respect to H2 was positive for both the catalysts, which indicates that ammonia synthesis over these catalysts was not inhibited by hydrogen adsorption, a phenomenon that is known as hydrogen poisoning.3 However, the value of p for Ba + Co/Mg–La was higher, revealing that the Co surface of this catalyst was not blocked by hydrogen as much as that of Co/Mg–La under the same conditions. This agrees well with the H2-TPD results. In contrast, for most of the known Ru catalysts, the reaction order with respect to hydrogen is negative; hence, increasing the reaction pressure has no effect on the rate of ammonia synthesis.3 The reaction order with respect to NH3 for both catalysts was strongly negative, i.e. less than −0.9, indicating that the rate of ammonia formation over these catalysts may be easily affected by the reverse reaction, especially under conditions where the NH3 concentration (conversion degree) is high. However, the reaction order with respect to NH3 (q) was more negative in the presence of Co/Mg–La; thus, the ammonia synthesis rate over this catalyst at high ammonia concentrations was expected to be low. This was confirmed by experimental data, as displayed in Fig. 11. In contrast, in the presence of Ru catalysts, the reaction order with respect to NH3 is less negative (−0.65 to −0.11),3 indicating that they are not poisoned by the ammonia generated during the reaction.
Conclusions
The high activity and stability of barium-promoted cobalt catalysts supported on magnesium–lanthanum mixed oxide in the reaction of ammonia synthesis were examined in this work. The activity of the Ba-promoted catalyst was ca. 3.5 times higher than that of the unpromoted catalyst and was accompanied by long-term thermostability. The physicochemical characteristics revealed that the addition of Ba promoter increased the surface basicity of the catalyst and changed the adsorption properties of the Co surface towards H2 and NH3. The decreased adsorption strength of the corresponding sites towards hydrogen and ammonia resulted in greater accessibility of the active sites in the Ba-promoted cobalt catalyst. These characteristics are considered to have a profound effect on the performance of this catalyst for NH3 synthesis. Due to the superior performance of the barium-promoted cobalt catalyst supported on magnesium–lanthanum mixed oxide, it is an attractive potential catalytic system for NH3 synthesis carried out under environmentally benign conditions in the future.Author contributions
Conceptualization, H. R.; methodology, H. R.; validation, H. R., and M. Z.; formal analysis, H. R.; investigation, H. R., M. Z., W. P., A. O., P. J., D. S., L. K., and W. R.-P.; resources, W. R.-P.; writing – original draft, H. R.; writing – review and editing, H. R., M. Z., W. R.-P., L. K., and P. J.; funding acquisition, W. R.-P.; supervision, H. R., and W. R.-P.Conflicts of interest
There are no conflicts to declare.Acknowledgements
Research was funded by POB Technologie Materiałowe of Warsaw University of Technology within the Excellence Initiative: Research University (IDUB) programme.References
- B. Lin, Y. Guo, J. Lin, J. Ni, J. Lin, L. Jiang and Y. Wang, Appl. Catal., A, 2017, 541, 1–7 CrossRef CAS.
- Z. Wang, B. Liu and J. Lin, Appl. Catal., A, 2013, 458, 130–136 CrossRef CAS.
- K. Imamura, S. I. Miyahara, Y. Kawano, K. Sato, Y. Nakasaka and K. Nagaoka, J. Taiwan Inst. Chem. Eng., 2019, 105, 50–56 CrossRef CAS.
- Y. Ogura, K. Sato, S. I. Miyahara, Y. Kawano, T. Toriyama, T. Yamamoto, S. Matsumura, S. Hosokawa and K. Nagaoka, Chem. Sci., 2018, 9, 2230–2237 RSC.
- W. Gao, P. Wang, J. Guo, F. Chang, T. He, Q. Wang, G. Wu and P. Chen, ACS Catal., 2017, 7, 3654–3661 CrossRef CAS.
- X. Wang, L. Li, T. Zhang, B. Lin, J. Ni, C. T. Au and L. Jiang, Chem. Commun., 2019, 55, 474–477 RSC.
- M. Muhler, F. Rosowski, O. Hinrichsen, A. Hornung and G. Ertl, Stud. Surf. Sci. Catal., 1996, 101, 317–326 CrossRef CAS.
- S. Hagen, R. Barfod, R. Fehrmann, C. J. H. Jacobsen, H. T. Teunissen and I. Chorkendorff, J. Catal., 2003, 214, 327–335 CrossRef CAS.
- C. J. H. Jacobsen, J. Catal., 2001, 200, 1–3 CrossRef CAS.
- T. W. Hansen, J. B. Wagner, P. L. Hansen, S. Dahl, H. Topsøe and C. J. H. Jacobsen, Science, 2001, 294, 1508–1510 CrossRef CAS PubMed.
- Z. Wang, J. Lin, R. Wang and K. Wei, Catal. Commun., 2013, 32, 11–14 CrossRef CAS.
- W. Li, S. Wang and J. Li, Chem.–Asian J., 2019, 14, 2815–2821 CAS.
- J. Cai, C. Wang, Y. Liu, J. Ni, B. Lin, X. Wang, J. Lin and L. Jiang, J. Rare Earths, 2020, 38, 873–882 CrossRef CAS.
- Y. Ogura, K. Tsujimaru, K. Sato, S. I. Miyahara, T. Toriyama, T. Yamamoto, S. Matsumura and K. Nagaoka, ACS Sustainable Chem. Eng., 2018, 6, 17258–17266 CrossRef CAS.
- L. Zhang, J. Lin, J. Ni, R. Wang and K. Wei, Catal. Commun., 2011, 15, 23–26 CrossRef CAS.
- X. Wang, J. Ni, B. Lin, R. Wang, J. Lin and K. Wei, Catal. Commun., 2010, 12, 251–254 CrossRef CAS.
- X. Luo, R. Wang, J. Ni, J. Lin, B. Lin, X. Xu and K. Wei, Catal. Lett., 2009, 133, 382–387 CrossRef CAS.
- W. Li, P. Liu, R. Niu, J. Li and S. Wang, Solid State Sci., 2020, 99, 105983 CrossRef CAS.
- R. Javaid, Y. Aoki and T. Nanba, J. Phys. Chem. Solids, 2020, 146, 109570 CrossRef CAS.
- X. Wang, X. Peng, W. Chen, G. Liu, A. Zheng, L. Zheng, J. Ni, C. tong Au and L. Jiang, Nat. Commun., 2020, 11, 1–10 CAS.
- M. Karolewska, E. Truszkiewicz, M. Wściseł, B. Mierzwa, L. Kępiński and W. Raróg-Pilecka, J. Catal., 2013, 303, 130–134 CrossRef CAS.
- A. Tarka, M. Zybert, E. Truszkiewicz, B. Mierzwa, L. Kępiński, D. Moszyński and W. Raróg-Pilecka, ChemCatChem, 2015, 7, 2836–2839 CrossRef CAS.
- H. Ronduda, M. Zybert, W. Patkowski, A. Tarka, P. Jodłowski, L. Kępiński, A. Sarnecki, D. Moszyński and W. Raróg-Pilecka, Appl. Catal., A, 2020, 598, 117553 CrossRef CAS.
- V. S. Marakatti and E. M. Gaigneaux, ChemCatChem, 2020, 12, 5838–5857 CrossRef CAS.
- H. Ronduda, M. Zybert, W. Patkowski, A. Tarka, A. Ostrowski and W. Raróg-Pilecka, J. Taiwan Inst. Chem. Eng., 2020, 114, 241–248 CrossRef CAS.
- B. Lin, Y. Liu, L. Heng, J. Ni, J. Lin and L. Jiang, Catal. Commun., 2017, 101, 15–19 CrossRef CAS.
- B. Lin, Y. Guo, C. Cao, J. Ni, J. Lin and L. Jiang, Catal. Today, 2018, 316, 230–236 CrossRef CAS.
- H. Fan, X. Huang, K. Kähler, J. Folke, F. Girgsdies, D. Teschner, Y. Ding, K. Hermann, R. Schlögl and E. Frei, ACS Sustainable Chem. Eng., 2017, 5, 10900–10909 CrossRef CAS.
- B. Lin, Y. Liu, L. Heng, X. Wang, J. Ni, J. Lin and L. Jiang, Ind. Eng. Chem. Res., 2018, 57, 9127–9135 CrossRef CAS.
- R. C. Reuel and C. H. Bartholomew, J. Catal., 1984, 85, 63–77 CrossRef CAS.
- A. Borodziński and M. Bonarowska, Langmuir, 1997, 13, 5613–5620 CrossRef.
- Z. Kowalczyk, Catal. Lett., 1996, 37, 173–179 CrossRef CAS.
- Z. Kowalczyk, S. Jodzis and J. Sentek, Appl. Catal., A, 1996, 138, 83–91 CrossRef CAS.
- Z. Kowalczyk, J. Sentek, S. Jodzis, M. Muhler and O. Hinrichsen, J. Catal., 1997, 169, 407–414 CrossRef CAS.
- J. R. Jennings, Catalytic Ammonia Synthesis, 1991 Search PubMed.
- M. Thommes, K. Kaneko, A. V. Neimark, J. P. Olivier, F. Rodriguez-Reinoso, J. Rouquerol and K. S. W. Sing, Pure Appl. Chem., 2015, 87, 1051–1069 CAS.
- G. Leofanti, M. Padovan, G. Tozzola and B. Venturelli, Catal. Today, 1998, 41, 207–219 CrossRef CAS.
- B. Guo, H. Shen, K. Shu, Y. Zeng and W. Ning, J. Chem. Sci., 2009, 121, 317–321 CrossRef CAS.
- C. J. Bardwell, R. I. Bickley, S. Poulston and M. V. Twigg, Thermochim. Acta, 2015, 613, 94–99 CrossRef CAS.
- M. Zybert, M. Karasińska, E. Truszkiewicz, B. Mierzwa and W. Raróg-Pilecka, Pol. J. Chem. Technol., 2015, 17, 138–143 CrossRef CAS.
- M. Nishi, S.-Y. Chen and H. Takagi, Catalysts, 2019, 9, 480 CrossRef CAS.
- Z. Kowalczyk, S. Jodzis, W. Raróg, J. Zieliński and J. Pielaszek, Appl. Catal., A, 1998, 173, 153–160 CrossRef CAS.
- Y. Ma, G. Lan, X. Wang, G. Zhang, W. Han, H. Tang, H. Liu and Y. Li, RSC Adv., 2019, 9, 22045–22052 RSC.
- N. C. S. Selvam, R. T. Kumar, L. J. Kennedy and J. J. Vijaya, J. Alloys Compd., 2011, 509, 9809–9815 CrossRef CAS.
- Y. Li, Q. Xie, Q. Hu, C. Li, Z. Huang, X. Yang and H. Guo, Sci. Rep., 2016, 6, 1–11 CrossRef PubMed.
- R. P. Turcotte, J. O. Sawyer and L. Eyring, Inorg. Chem., 1969, 8, 238–246 CrossRef CAS.
- J. Ni, L. Chen, J. Lin, M. K. Schreyer, Z. Wang and S. Kawi, Int. J. Hydrogen Energy, 2013, 38, 13631–13642 CrossRef CAS.
- A. N. Shirsat, M. Ali, K. N. G. Kaimal, S. R. Bharadwaj and D. Das, Thermochim. Acta, 2003, 399, 167–170 CrossRef CAS.
- M. Kang, M. W. Song and C. H. Lee, Appl. Catal., A, 2003, 251, 143–156 CrossRef CAS.
- L. Xue, C. Zhang, H. He and Y. Teraoka, Appl. Catal., B, 2007, 75, 167–174 CrossRef CAS.
- V. M. Belousov, J. Stoch, I. V. Batcherikova, E. V. Rozhkova and L. V. Lyashenko, Appl. Surf. Sci., 1989, 35, 481–494 CrossRef CAS.
- S. S. Y. Lin, D. H. Kim and S. Y. Ha, Appl. Catal., A, 2009, 355, 69–77 CrossRef CAS.
- B. Tomić-Tucaković, D. Majstorović, D. Jelić and S. Mentus, Thermochim. Acta, 2012, 541, 15–24 CrossRef.
- S. Podila, Y. A. Alhamed, A. A. Alzahrani and L. A. Petrov, Int. J. Hydrogen Energy, 2015, 40, 15411–15422 CrossRef CAS.
- S. Podila, H. Driss, S. F. Zaman, Y. A. Alhamed, A. A. Alzahrani, M. A. Daous and L. A. Petrov, J. Mol. Catal. A: Chem., 2016, 414, 130–139 CrossRef CAS.
- X. Wang, L. Lv, Q. Zhang, Y. Zhang, J. Wang and M. Shen, Catal. Sci. Technol., 2013, 3, 200–207 RSC.
- Z. You, K. Inazu, K. Aika and T. Baba, J. Catal., 2007, 251, 321–331 CrossRef CAS.
- P. Seetharamulu, K. Hari Prasad Reddy, A. H. Padmasri, K. S. Rama Rao and B. David Raju, Catal. Today, 2009, 141, 94–98 CrossRef CAS.
- N. A. Razali, M. Conte and J. McGregor, Catal. Lett., 2019, 149, 1403–1414 CrossRef CAS.
- A. Bansode, B. Tidona, P. R. Von Rohr and A. Urakawa, Catal. Sci. Technol., 2013, 3, 767–778 RSC.
- B. Lin, K. Wei, X. Ma, J. Lin and J. Ni, Catal. Sci. Technol., 2013, 3, 1367–1374 RSC.
- B. Lin, Y. Liu, L. Heng, J. Ni, J. Lin and L. Jiang, J. Rare Earths, 2018, 36, 703–707 CrossRef CAS.
| This journal is © The Royal Society of Chemistry 2021 |