 Open Access Article
Study of catalytic hydrogenation and dehydrogenation of 2,3-dimethylindole for hydrogen storage application
Yuan Donga,
Haoming Zhaoa,
Yinheng Zhaoa,
Ming Yang *ab,
Heshun Zhanga and
Hansong Chenga
aSustainable Energy Laboratory, Faculty of Materials Science and Chemistry, China University of Geosciences, Wuhan, 430074, P. R. China
bZhejiang Institute, China University of Geosciences, Hangzhou, 311305, China. E-mail: yangming8180@gmail.com
First published on 27th April 2021
Abstract
2,3-Dimethylindole (2,3-DMID), a candidate with a hydrogen storage capacity of 5.23 wt%, was studied as a new liquid organic hydrogen carrier (LOHC) in detail in this report. Hydrogenation of 2,3-DMID was conducted over 5 wt% Ru/Al2O3 by investigating the influences of temperature and hydrogen pressure. 100% of fully hydrogenated product, 8H-2,3-DMID can be achieved at 190 °C and 7 MPa in 4 h. Dehydrogenation of 8H-2,3-DMID was performed over 5 wt% Pd/Al2O3 at 180–210 °C and 101 kPa. It is found that dehydrogenation of 8H-2,3-DMID followed first order kinetics with an apparent activation energy of 39.6 kJ mol−1. The structures of intermediates produced in the 8H-2,3-DMID dehydrogenation process were analyzed by DFT calculations.
Introduction
Nowadays, the usage of renewable clean energy has become unavoidable, aiming to reduce greenhouse gas emissions and to compensate for declining fossil-fuel resources.1–3 A consensus has been reached that hydrogen energy is one of the most attractive choices.4,5 However, it is difficult to store hydrogen without bulky, heavy equipment due to the low density and high explosive risk.6 Apparently, the further transportation of hydrogen must be necessary depending on the method of hydrogen storage.7,8 Thus, the major challenge towards the large scale utilization of hydrogen is to develop a safe and practical method for the onboard storage.9–11 In the past decades, hydrogen was dominantly stored and transported in its elemental form as compressed hydrogen (200–700 bar) and liquefied hydrogen (−253 °C) for onboard applications, both of which require a large amount of energy in the storage process.9,12–14 Besides, the safety and cost are another concern for compressed hydrogen and liquefied hydrogen. Consequently, researchers are committed to search for materials which can store hydrogen more safely and efficiently.Hydrogen can be stored in form of hydrogen molecule by physical adsorption on materials with a large specific surface area (e.g., carbon-based materials15,16 and metal organic frameworks17,18) and in form of hydrogen atoms by chemical adsorption which are bonded with the substrates by chemical bonding (e.g., organic liquid compounds19 and metal hydrides20). High hydrogen storage densities can be achieved at relatively low temperature (−196 °C) and high pressures (10–100 bar) for physical adsorption for the former. In comparison, elevated temperature is required to release hydrogen stored by chemical adsorption. LOHCs (liquid organic hydrogen carriers) have been considered as promising hydrogen storage substrates in recent years.21–26 Hydrogen was bonded to these compounds through catalytic hydrogenation and released through catalytic dehydrogenation. As early as 1970s, aromatic hydrocarbon compounds were initially proposed as hydrogen storage carriers such as benzene and toluene, which were mainly applied in industrial process (e.g., in oil refineries). However, with high enthalpy of dehydrogenation (>60 kJ mol−1 H2), the operation temperatures of these hydrogenated cycloalkanes were required over 300 °C, which typically lead to the molecule cracking or coking.27–29 Hence, a large number of literatures concerning the catalysts development for dehydrogenation of cycloalkanes were reported in decades.30–37 In 2004, a series of hetero-aromatic molecules with relatively low heat of hydrogenation screening as LOHCs were firstly studied through systematic experimental and theoretical by Pez et al.38,39 It is reported that incorporation of N heteroatom into the aromatic ring favored the dehydrogenation thermodynamics and kinetics. Carbazole-based compounds, such as N-ethylcarbazole (NECZ, mp: 70 °C) and N-propylcarbazole (NPCZ, mp: 48 °C), were investigated most widely as LOHCs by a lot of groups.40–45 With a hydrogen capacity of 5.79 wt%, NECZ can be completely hydrogenated over Ru/Al2O3 at the temperature of 150 °C with a hydrogen pressure of 5 MPa within 180 min. The fully reverse process, dehydrogenation of NECZ, can be realized below 200 °C over Pd/Al2O3 (ref. 46) and Pt/Al2O3.47 Wu et al. Reported a Co-based catalyst, which can achieve a reversible hydrogen uptake and release of NECZ in high efficiency.48 Fully dehydrogenated N-propylcarbazole can be obtained at 200 °C in 240 min with applied Pd/Al2O3 catalyst.49 Arlt et al. investigated the thermochemical properties of N-alkylcarbazoles (N-isopropylcarbazole, N-propylcarbazole, and N-butylcarbazole)50 and found the melting point of eutectic systems composed of N-alkylcarbazoles can be lowered dramatically to 24 °C,51 which are suitable for large scale and long distance storage and delivery at ambient conditions with existing infrastructures. In addition, Wasserscheid et al. proposed benzyltoluene (BT) and dibenzyltoluene (DBT) as promising LOHCs.52,53 Although dehydrogenation of these hydrocarbon molecules was required at temperatures above 250 °C,54 these mixtures were still regarded as attractive LOHCs as the result of their low melting point (−34–36 °C), high boiling point (390 °C), low flammability and low costs. Recently, indole-based compounds were also suggested as LOHCs, such as indole,55,56 N-methylindole (NMID),57 1,2-dimethylindole58 and 7-ethylindole (7-EID).59 Table 1 gives an overview of properties and reaction conditions for indole derivatives hydrogenation and dehydrogenation which have been reported in relative literatures. It is indicated that indole derivates with different alkyl chains substituted in different positions exhibit markedly difference in hydrogenation and dehydrogenation kinetics.
| Substrate | Melting point (°C) | Hydrogenated product | Hydrogen capacity (wt%) | Hydrogenation conditions from substrate to hydrogenated product | Dehydrogenation conditions from hydrogenated product to substrate |
|---|---|---|---|---|---|
| a HFIP: hexafluoroisopropanol; p-TSA = p-toluenesulfonic acid. | |||||
indole |
51 | 2H-indoline |
1.68 | Pt/C, 3 MPa, 50 °C, 3 h, 100% conversion in H2O with p-TSA.60 | — |
8H-indole |
6.4 | Pd/C, 0.7 MPa, 50 °C, 8 h, 100% conversion in HFIP solvent.61 | — | ||
NMID |
−29 | 8H-NMID |
5.76 | Ru/Al2O3, 130 °C, 6 MPa, 2 h, 100% conversion in hexane solvent.57 | Pd/Al2O3, 200 °C, 101 kPa, 3 h, 100% conversion.57 |
NEID |
−17.8 | 8H-NEID |
5.23 | Ru/Al2O3, 180 °C, 9 MPa, 2 h, 100% conversion in hexane solvent.62 | Pd/Al2O3, 190 °C, 101 kPa, 6 h, 100% conversion.63 |
7-EID |
−14.5 | 8H-7-EID |
5.23 | Ru/Al2O3, 160 °C, 7 MPa, 1.5 h, 100% conversion in hexane solvent.59 | Pd/Al2O3, 190 °C, 101 kPa, 270 min, 100% conversion.59 |
2-MID |
57 | 2H-2-MID |
1.43 | Pt/C, 60 °C, 4 MPa, 4 h, 97% conversion in toluene with p-TSA.64 | Cobalt pincer catalyst, 150 °C, 101 kPa, 4 d, 100% conversion in p-xylene solvent.66 |
8H-2-MID |
5.76 | Ru/Al2O3, 160 °C, 7 MPa, 0.7 h, 100% conversion in 1,4-dioxane solvent.65 | Pd/Al2O3, 190 °C, 101 kPa, 4 h, 100% conversion in decalin solvent.65 | ||
1,2-DMID |
55 | 8H-1,2-DMID |
5.23 | Ru/Al2O3, 160 °C, 7 MPa, 30 min, 100% conversion in 1,4-dioxane solvent.58 | Pd/Al2O3, 200 °C, 101 kPa, 60 min, 100% conversion in decalin solvent.58 |
In fact, we have published a number of hydrogen storage molecular articles, including carbazole series, indoles series, etc. The purpose of this work is to build a database of organic hydrogen storage molecules and to obtain a certain construction rule by studying the influence of molecular structure (such as the number of side groups, types and number of aromatic rings) on the dehydrogenation performance of organic molecules. In this work, the disubstituted 2,3-dimethylindole (2,3-DMID) was well studied as a new LOHC candidate. The influences of temperature and hydrogen pressure on the hydrogen uptake rate of 2,3-DMID were investigated. Complete hydrogenation of 2,3-DMID can be realized at the temperature of 190 °C within 240 min. The dehydrogenation reaction rate of 8H-DMID was first order for 8H-DMID concentration. The apparent activation barrier of 8H-DMID consumption was 39.6 kJ mol−1 at temperature in the range of 180–210 °C. The dehydrogenation process of 8H-2,3-DMID was analysed by experimental and DFT calculations.
Results and discussion
The physicochemical properties of 2,3-DMID and 8H-2,3-DMID
As shown in Table 2, both of 2,3-DMID and 8H-2,3-DMID keep high stability at ambient conditions and no severe hazard to people health and environment. The melting point of 2,3-DMID is 105 °C, which can be decreased by mixing with other LOHCs to form eutectic mixtures. The hydrogenated product, 8H-2,3-DMID, was liquid at room temperature, which can be conveniently delivered by using existing gasoline-based infrastructures.Hydrogenation of 2,3-DMID
The hydrogenation reaction of 2,3-DMID was performed at 160–200 °C and 7 MPa. The hydrogen absorption curves at the selected temperatures have been displayed in Fig. 1. The hydrogenation uptake rate accelerates as the reaction temperature was increased from 160 °C to 190 °C. After reaction for 1 h, the hydrogen storage gravimetric density reaches 0.57 wt% at 160 °C, 2.91 wt% at 170 °C, 3.21 wt% at 180 °C and 4.67 wt% at 190 °C, respectively. Specially, the hydrogen uptake rate increases notably with temperature rising from 160 °C to 170 °C, which can be explained that most reactant molecules can be actived to overcome the hydrogenation reaction barrier as the temperature exceeded 160 °C. The theoretical hydrogen capacity of 2,3-DMID (5.23 wt%) can be reached at 190 °C after 4 h. However, the reaction rate decreased when the temperature was further raised to 200 °C. The reasons for the decrease may be its exothermic nature of hydrogenation reaction, which causes the equilibrium to be shifted towards the reactants with increasing temperature. In addition, high temperature led to the difficulty in dissolving more hydrogen in the liquid though the pressure was increased, which limited the hydrogen transfer at the surface of the catalyst.67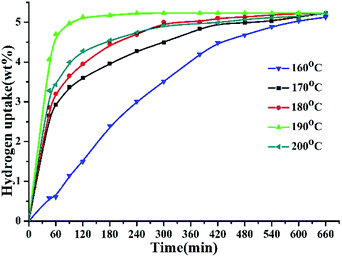 | ||
| Fig. 1 Hydrogen uptake of 2,3-DMID hydrogenation at 160–200 °C and 7 MPa over the 5 wt% Ru/Al2O3 catalyst with a ratio to 2,3-DMID of 0.72 mol%. | ||
Fig. 2 shows the evolution of product distribution with reaction time during 2,3-DMID hydrogenation over Ru/Al2O3. Only 4H-2,3-DMID was detected as the intermediate along with the fully hydrogenated product, 8H-2,3-DMID. The consumption rate of 2,3-DMID increased significantly in 170–200 °C as compared with that in 160 °C, which explained the obvious decrease of the hydrogen uptake rate (Fig. 2) in 160 °C at the beginning of the reaction. The concentration of 4H-2,3-DMID rapidly reached maximum in the initial 30 minutes at 170–200 °C. Almost 100% hydrogenation of 2,3-DMID was realized in 240 min at 190 °C, 540 min at 180 °C and 660 min at 170 °C. Increase temperature to 200 °C, the consumption of 4H-2,3-DMID become sluggish which lead to the decrease of hydrogen uptake rate compared with that of at 190 °C. No 2H- and 6H- intermediates were detected. It is likely that they were kinetic unstable and immediately further converted to the final product upon formation.
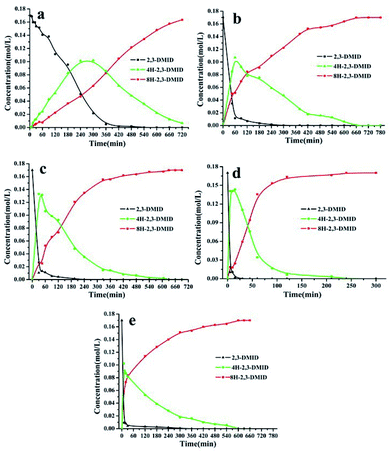 | ||
| Fig. 2 Time-dependent product distribution for 2,3-DMID hydrogenation at different temperatures. (a) 160 °C, (b) 170 °C, (c) 180 °C, (d) 190 °C, (e) 200 °C. | ||
Fig. 3 displays the hydrogen adsorption curves of 2,3-DMID under different hydrogen pressures at 190 °C over 5 wt% Ru/Al2O3. It is found that the increase of pressure is in favor of accelerating hydrogenation rates, which can be attributed to the improvement in hydrogen solubility and the shift in the direction of hydrogenation of the chemical equilibrium.
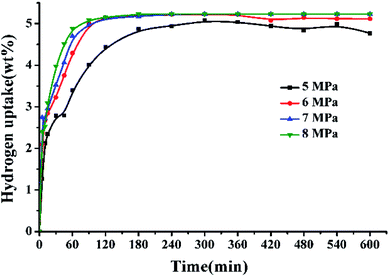 | ||
| Fig. 3 Hydrogen uptake of 2,3-DMID hydrogenation under 5–8 MPa at 190 °C over a 5 wt% Ru/Al2O3 catalyst with a ratio to 2,3-DMID of 0.72 mol%. | ||
Dehydrogenation of 8H-2,3-DMID
The dehydrogenation reactions were carried out at the temperature of 180–210 °C over 5 wt% Pd/Al2O3. The hydrogen release curves of 8H-2,3-DMID at different temperatures were shown in Fig. 4. The dehydrogenation rate accelerates obviously with the temperature raised from 180 °C to 200 °C. 96% dehydrogenation was obtained after 600 min at 200 °C. Further increase temperature to 210 °C, the time for achieving the theoretical hydrogen storage gravimetric density (5.23 wt%) was shortened to be 480 min.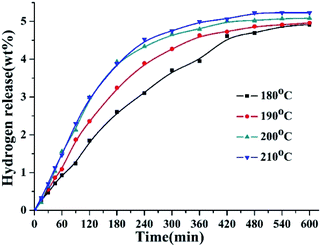 | ||
| Fig. 4 Hydrogen release of 8H-2,3-DMID dehydrogenation at 180–210 °C and 101 kPa over the 5 wt% Pd/Al2O3 with a ratio to 8H-2,3-DMID of 1.44 mol%. | ||
Fig. 5 shows the evolution of product distributions with reaction time at selected temperatures during the process of 8H-2,3-DMID dehydrogenation. 8H-2,3-DMID was consumed as soon as the reaction was started. However, the conversion of 8H-2,3-DMID was sluggish and the complete conversion of 8H-2,3-DMID was not obtained until the reaction proceeded in 8 h at 210 °C. Three intermediates, 6H-, 4H- and 2H- were detected and no other side products were found. The accumulation of 6H-2,3-DMID from 8H-2,3-DMID was converted rapidly to form 4H-2,3-DMID and 2H-2,3-DMID, resulting in the maximum concentration of 6H-2,3-DMID to be reached quickly. Obviously, the dehydrogenation of 8H-2,3-DMID was a consecutive four step reaction, sequentially forming 6H-2,3-DMID, 4H-2,3-DMID, 2H-2,3-DMID and the fully dehydrogenated product, 2,3-DMID. The conversion of 8H-2,3-DMID and selectivity to 2,3-DMID after 5 h were presented in Table 3, which were calculated by the eqn (1) and (2) bellow, respectively.
 | (1) |
 | (2) |
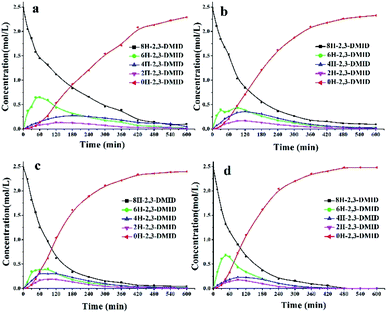 | ||
| Fig. 5 Time-dependent product distribution for 8H-2,3-DMID dehydrogenation at different temperatures. (a) 180 °C, (b) 190 °C, (c) 200 °C, (d) 210 °C. | ||
| Temperature (°C) | Conversion (%) | Selectivity (%) | Hydrogen release content (wt%) |
|---|---|---|---|
| 180 | 81.5 | 62.3 | 3.71 |
| 190 | 89.2 | 75.6 | 4.27 |
| 200 | 94.1 | 85.2 | 4.67 |
| 210 | 93.6 | 88.7 | 4.75 |
In fact, a disubstituted indole derivative, 1,2-DMID has been studied in detail previously. Only 4H-1,2-DMID was identified as the intermediate in the dehydrogenation reaction of 8H-1,2-DMID and completely dehydrogenated product can be obtained in 60 min at 200 °C with applied Pd/Al2O3. In comparison, three intermediates, 6H-, 4H- and 2H- were detected and the consumption of these intermediates were sluggish under designed conditions in 8H-2,3-DMID dehydrogenation. The reason may be that the steric hindrance produced by the methyl connected to the N atom in 1,2-DMID benefits the sorption of 1,2-DMID on the catalyst, which leads to a faster dehydrogenation rate.
The dehydrogenation kinetics of 8H-2,3-DMID were also investigated. Previous investigations on dehydrogenation of several LOHCs such as N-ethylcarbazole, 1,2-dimethylindole and 2-methylindole have shown that the reaction follows first order kinetics. Hence, the dehydrogenation of 8H-2,3-DMID was assumed to follow first order kinetics. Fig. 6(a) presents the plots of ln(C0/C8H-2,3-DMID) versus reaction time t at 180–210 °C, which indicates that the experimental points can be readily fitted to the first order reaction kinetics model. The rate constant derived from the slope of the fitting lines increases from 0.0050 mol L−1 at 180 °C to 0.0090 mol L−1 at 210 °C. Particularly, the dehydrogenation rate constants increase obviously from 180 °C to 200 °C due to its endothermic nature. Further increase temperature to 210 °C, the rate constant only increases slightly. The reason may be that the high temperature is beneficial for dehydrogenation kinetics meanwhile causes carbon deposition on the catalyst which decreases the catalytic activity. As shown in Fig. 6(b), the ln![[thin space (1/6-em)]](https://www.rsc.org/images/entities/char_2009.gif) k was plotted verse the 1/T. The estimated reaction activation barrier for 8H-2,3-DMID dehydrogenation based on the Arrhenius equation is 39.6 kJ mol−1, which is significantly lower than that of 8H-1,2-DMID dehydrogenation (111.9 kJ mol−1). Notably, the reaction activation energy obtained from the experiments was influenced by kinds of factors, such as reaction conditions, mass transfer and so on.68
k was plotted verse the 1/T. The estimated reaction activation barrier for 8H-2,3-DMID dehydrogenation based on the Arrhenius equation is 39.6 kJ mol−1, which is significantly lower than that of 8H-1,2-DMID dehydrogenation (111.9 kJ mol−1). Notably, the reaction activation energy obtained from the experiments was influenced by kinds of factors, such as reaction conditions, mass transfer and so on.68
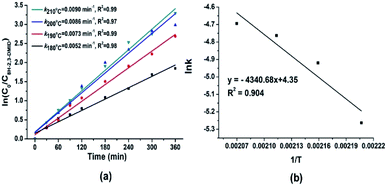 | ||
| Fig. 6 (a) First-order kinetic model fitted to the experimental data obtained for dehydrogenation of 8H-2,3-DMID. (b) Arrhenius plot obtained from 8H-2,3-DMID dehydrogenation reactions at 180–210 °C. | ||
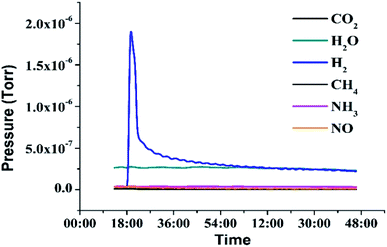
In addition, the purity of released hydrogen was tested by DSMS (Dynamic Sampling Mass Spectrometer), which can dynamically monitor the pressure of the released gas during dehydrogenation. As shown in Fig. 7, the water vapor may come from the atmosphere when the liquid was added to the dehydrogenation reactor. The result indicated that no side reactions occurred under designed dehydrogenation conditions and the hydrogen gas was in a high purity (>99%).
The catalyst stability was also tested in 2,3-DMID hydrogenation and dehydrogenation. The same Ru/Al2O3 catalyst was used to hydrogenate 2,3-DMID under 190 °C and 7 MPa for 3 times. It is found almost 100% 8H-2,3-DMID was achieved within 240 min in 3 cycles, indicating the high stability of Ru/Al2O3 catalyst in hydrogenation of 2,3-DMID. Similarly, the same Pd/Al2O3 was used to dehydrogenate 8H-2,3-DMID for 3 times. The obvious catalytic activity degradation of Pd/Al2O3 was observed. This may be because the carbon formation on the surface of the catalyst and the metal agglomeration after dehydrogenation for a long time. The study on design and preparation high activity and stability catalyst is under way (Fig. 8).
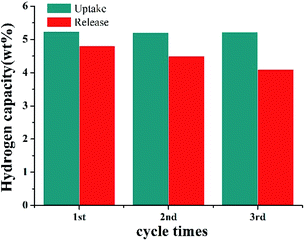 | ||
| Fig. 8 Catalyst stability test for 2,3-DMID hydrogenation with Ru/Al2O3 and dehydrogenation with Pd/Al2O3. | ||
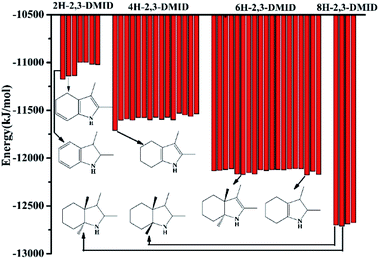
During 8H-2,3-DMID dehydrogenation, three intermediates, 2H-, 4H- and 6H-, were detected. The possible structures of the isomers were designed and the corresponding energy for each species has been displayed in Fig. 9.
The binding energy can indicate the stability of the structure to a certain extent. It can be seen that the C![[double bond, length as m-dash]](https://www.rsc.org/images/entities/char_e001.gif) C double band was firstly formed in five membered ring, leading to the 6H-2,3-DMID and 4H-2,3-DMID production. Subsequently, the further dehydrogenation occurs in the six membered ring with releasing another H2 molecule to form 2H-2,3-DMID. Hence, the pathway for 8H-2,3-DMID dehydrogenation can be expressed as follows (Scheme 1):
C double band was firstly formed in five membered ring, leading to the 6H-2,3-DMID and 4H-2,3-DMID production. Subsequently, the further dehydrogenation occurs in the six membered ring with releasing another H2 molecule to form 2H-2,3-DMID. Hence, the pathway for 8H-2,3-DMID dehydrogenation can be expressed as follows (Scheme 1):
Experimental
Materials
2,3-dimethylindole (AR) and Mesitylene (AR) were provided by Energy Chemical Company and Sinopharm Chemical Reagent Company Limited, respectively. 5 wt% Ru/Al2O3 and 5 wt% Pd/Al2O3 catalysts were purchased from Shanxi Kaida Chemical Engineering Company Limited. The BET surface areas and pore sizes of the Ru/Al2O3 and Pd/Al2O3 are 85.24 m2 g−1, 13.41 nm and 68.35 m2 g−1, 11.89 nm, which are measured by ASAP 2020. Ultra-high purity H2 gas was obtained from Sichuan Ally High-Tech Company. Gas chromatography and mass spectrometry (Agilent 7890/5975C GC-MS) was used to analyse the reaction liquid samples regularly. The test method was same as described in ref. 59.Hydrogenation reaction of 2,3-dimethylindole
The hydrogenation reaction was performed in a 250 ml autoclave batch reactor (Shanghai LABE Instrument LB250) over 5 wt% Ru/Al2O3 by controlling the reaction temperatures and hydrogen pressures. The reactor was loaded with 1 g of 2,3-dimethylindole and 0.1 g of Ru/Al2O3 in a 40 ml of mesitylene before being sealed. The air in the reactor was purged by charging and discharging of hydrogen for 3 times. Afterwards, the autoclave was pressurized to the desired hydrogen pressure and heated to the designed temperature. As the reaction proceeds, small amount of the mixture liquid sample was collected and analysed regularly by GC-MS.Dehydrogenation reaction of 8H-2,3-dimethylindole
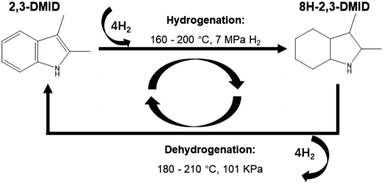
The 8H-2,3-DMID produced by complete hydrogenation was used as initial reactant in dehydrogenation. The reaction was performed at 180–210 °C in a 50 ml three-necked flask reactor which was connected with a condenser. 5 g of 8H-2,3-DMID was injected into the reactor. Then the reactor was heated to the required temperature following by adding 1 g of 5 wt% Pd/Al2O3 catalyst. The reaction time was recorded as soon as stirring was started. Liquid mixtures were taken out regularly and analysed with GC-MS. The hydrogenation and dehydrogenation experiment process for 2,3-DMID was described as below (Fig. 10).DFT calculations
The binding energies of all structural isomers were calculated by DFT (density functional theory), which were conducted by Material Studio DMol.3 The detailed calculation method was the same as mentioned in ref. 58.Conclusions
Indole-based derivatives have been selected as attractive LOHCs recently. These indole-based compounds exhibit different hydrogenation and dehydrogenation kinetics, which can be strongly influenced by the steric hindrance which were created by the different substituted alkin chains. 2,3-DMID was studied as another new LOHC in detail in this report. Fully hydrogenated product can be obtained within 4 h at 190 °C and 7 MPa. Dehydrogenation of 8H-2,3-DMID fits first order kinetics model. The apparent activation barrier of 8H-DMID dehydrogenation was estimated to be 39.6 kJ mol−1 at 180–210 °C. The dehydrogenation process can be written as: 8H-2,3-DMID → 6H-2,3-DMID → 4H-2,3-DMID → 2H-2,3-DMID → 2,3-DMID.Conflicts of interest
There are no conflicts to declare.Acknowledgements
The authors gratefully acknowledge the financial support from the National Key Research and Development Program of China (No. 2018YFB1502903), the Zhejiang Provincial Natural Science Foundation of China (Grant no. LGG20B030001), the National Natural Science Foundation of China (No. 21875225), Major project of technical innovation of Hubei Province (No. 2019AAA163), and China University of Geosciences (Wuhan) for the program of Center for Advanced Energy Research and Technologies.Notes and references
- J. O. Abe, A. P. I. Popoola, E. Ajenifuja and O. M. Popoola, Int. J. Hydrogen Energy, 2019, 44, 15072–15086 CrossRef CAS
.
- J. Wang, H. Zhong, Z. Ma, Q. Xia and C. Kang, Appl. Energy, 2017, 202, 772–782 CrossRef
.
- F. Piraino, M. Genovese and P. Fragiacomo, Energy Convers. Manage., 2021, 228 Search PubMed
.
- R. Moradi and K. M. Groth, Int. J. Hydrogen Energy, 2019, 44, 12254–12269 CrossRef CAS
.
- M. Niermann, S. Timmerberg, S. Drunert and M. Kaltschmitt, Renewable Sustainable Energy Rev., 2021, 135 Search PubMed
.
- J. Andersson and S. Grönkvist, Int. J. Hydrogen Energy, 2019, 44, 11901–11919 CrossRef CAS
.
- Y. Balali and S. Stegen, Renewable Sustainable Energy Rev., 2021, 135 Search PubMed
.
- J. Kurtz, S. Sprik and T. H. Bradley, Int. J. Hydrogen Energy, 2019, 44, 12010–12023 CrossRef CAS
.
- P. Preuster, A. Alekseev and P. Wasserscheid, in Annual Review of Chemical and Biomolecular Engineering, ed. J. M. Prausnitz, 2017, vol. 8, pp. 445–471 Search PubMed
.
- A. Amiri and R. Shahbazian-Yassar, J. Mater. Chem. A, 2021, 9, 782–823 RSC
.
- J. Q. Li, N. S. Myoung, J. T. Kwon, S. J. Jang, T. Lee and Y. H. Lee, Adv. Mech. Eng., 2020, 12, 1687814020971920 Search PubMed
.
- J. Bellosta von Colbe, J.-R. Ares, J. Barale, M. Baricco, C. Buckley, G. Capurso, N. Gallandat, D. M. Grant, M. N. Guzik, I. Jacob, E. H. Jensen, T. Jensen, J. Jepsen, T. Klassen, M. V. Lototskyy, K. Manickam, A. Montone, J. Puszkiel, S. Sartori, D. A. Sheppard, A. Stuart, G. Walker, C. J. Webb, H. Yang, V. Yartys, A. Züttel and M. Dornheim, Int. J. Hydrogen Energy, 2019, 44, 7780–7808 CrossRef CAS
.
- P. Murray, K. Orehounig, D. Grosspietsch and J. Carmeliet, Appl. Energy, 2018, 231, 1285–1306 CrossRef
.
- P. Preuster, C. Papp and P. Wasserscheid, Acc. Chem. Res., 2017, 50, 74–85 CrossRef CAS PubMed
.
- K. Wang, X. Zhang, Y. F. Liu, Z. H. Ren, X. L. Zhang, J. J. Hu, M. X. Gao and H. G. Pan, Chem. Eng. J., 2021, 406 Search PubMed
.
- N. Thaweelap, P. Plerdsranoy, Y. Poo-arporn, P. Khajondetchairit, S. Suthirakun, I. Fongkaew, P. Hirunsit, N. Chanlek, O. Utke, A. Pangon and R. Utke, Fuel, 2021, 288 Search PubMed
.
- U. Ryu, S. Jee, P. C. Rao, J. Shin, C. Ko, M. Yoon, K. S. Park and K. M. Choi, Coord. Chem. Rev., 2021, 426 Search PubMed
.
- M. Witman, S. Ling, A. Gladysiak, K. C. Stylianou, B. Smit, B. Slater and M. Haranczyk, J. Phys. Chem. C, 2017, 121, 1171–1181 CrossRef CAS PubMed
.
- V. N. Emel’yanenko, M. A. Varfolomeev, S. P. Verevkin, K. Stark, K. Müller, M. Müller, A. Bösmann, P. Wasserscheid and W. Arlt, J. Phys. Chem. C, 2015, 119, 26381–26389 CrossRef
.
- Y. J. Kwak, S. H. Lee and M. Y. Song, J. Nanosci. Nanotechnol., 2018, 18, 6040–6046 CrossRef CAS PubMed
.
- M. Naseem, M. Usman and S. Lee, Int. J. Hydrogen Energy, 2021, 46, 4100–4115 CrossRef CAS
.
- M. Yang, X. Xing, T. Zhu, X. Chen, Y. Dong and H. Cheng, J. Energy Chem., 2020, 41, 115–119 CrossRef
.
- M. Niermann, A. Beckendorff, M. Kaltschmitt and K. Bonhoff, Int. J. Hydrogen Energy, 2019, 44, 6631–6654 CrossRef CAS
.
- T. Rüde, A. Bösmann, P. Preuster, P. Wasserscheid, W. Arlt and K. Müller, Energy Technol., 2018, 6, 529–539 CrossRef
.
- P. Preuster, Q. Fang, R. Peters, R. Deja, V. N. Nguyen, L. Blum, D. Stolten and P. Wasserscheid, Int. J. Hydrogen Energy, 2018, 43, 1758–1768 CrossRef CAS
.
- P. M. Modisha, C. N. M. Ouma, R. Garidzirai, P. Wasserscheid and D. Bessarabov, Energy Fuels, 2019, 33, 2778–2796 CrossRef CAS
.
- A. N. Kalenchuk, V. I. Bogdan, S. F. Dunaev and L. M. Kustov, Fuel Process. Technol., 2018, 169, 94–100 CrossRef CAS
.
- F. B. Juangsa, L. A. Prananto, Z. Mufrodi, A. Budiman, T. Oda and M. Aziz, Appl. Energy, 2018, 226, 31–38 CrossRef CAS
.
- J. Yan, W. Wang, L. Miao, K. Wu, G. Chen, Y. Huang and Y. Yang, Int. J. Hydrogen Energy, 2018, 43, 9343–9352 CrossRef CAS
.
- Y. Han, Z. Wang, R. Xu, W. Zhang, W. Chen, L. Zheng, J. Zhang, J. Luo, K. Wu, Y. Zhu, C. Chen, Q. Peng, Q. Liu, P. Hu, D. Wang and Y. Li, Angew. Chem., Int. Ed. Engl., 2018, 57, 11262–11266 CrossRef CAS PubMed
.
- J. V. Pande, A. B. Bindwal, Y. B. Pakade and R. B. Biniwale, Int. J. Hydrogen Energy, 2018, 43, 7411–7423 CrossRef CAS
.
- T. Zhu, M. Yang, X. Chen, Y. Dong, Z. Zhang and H. Cheng, J. Catal., 2019, 378, 382–391 CrossRef CAS
.
- N. Boufaden, R. Akkari, B. Pawelec, J. L. G. Fierro, M. Said Zina and A. Ghorbel, Appl. Catal., A, 2015, 502, 329–339 CrossRef CAS
.
- X. Li, Y. Tuo, H. Jiang, X. Duan, X. Yu and P. Li, Int. J. Hydrogen Energy, 2015, 40, 12217–12226 CrossRef CAS
.
- A. Nakano, S. Manabe, T. Higo, H. Seki, S. Nagatake, T. Yabe, S. Ogo, T. Nagatsuka, Y. Sugiura, H. Iki and Y. Sekine, Appl. Catal., A, 2017, 543, 75–81 CrossRef CAS
.
- M. Williams, B. Fonfe, C. Sievers, A. Abraham, J. Vanbokhoven, A. Jentys, J. Vanveen and J. Lercher, J. Catal., 2007, 251, 485–496 CrossRef CAS
.
- B. F. M. F. Williams, A. Jentys, C. Breitkopf, J. A. R. van Veen and J. A. Lercher, J. Phys. Chem. C, 2010, 114, 10 Search PubMed
.
- G. P. Pez, A. R. Scott, A. C. Cooper, H. Cheng, US Pat., 20040223907, 2004 Search PubMed
.
- G. P. Pez, A. R. Scott, A. C. Cooper, H. Cheng, US Pat., 20050002857, 2005 Search PubMed
.
- P. J. Li, Y. Dong, Y. H. Ding, H. S. Zhang, M. Yang and H. S. Cheng, Int. J. Hydrogen Energy, 2021, 46, 3945–3953 CrossRef CAS
.
- J. Jung, B. S. Shin, J. W. Kang and W. S. Han, Catalysts, 2021, 11 CAS
.
- C. Li, M. Yang, Z. Liu, Z. Zhang, T. Zhu, X. Chen, Y. Dong and H. Cheng, Catal. Sci. Technol., 2020, 10, 2268–2276 RSC
.
- H. Yu, X. Yang, Y. Wu, Y. Guo, S. Li, W. Lin, X. Li and J. Zheng, J. Energy Chem., 2020, 40, 188–195 CrossRef
.
- B. Wang, T.-y. Chang, Z. Jiang, J.-j. Wei, Y.-h. Zhang, S. Yang and T. Fang, Int. J. Hydrogen Energy, 2018, 43, 7317–7325 CrossRef CAS
.
- C. Papp, P. Wasserscheid, J. Libuda and H.-P. Steinrueck, Chem. Rec., 2014, 14, 879–896 CrossRef CAS PubMed
.
- B. Wang, T. Yan, T. Chang, J. Wei, Q. Zhou, S. Yang and T. Fang, Carbon, 2017, 122, 9–18 CrossRef CAS
.
- M. Yang, Y. Dong, S. Fei, H. Ke and H. Cheng, Int. J. Hydrogen Energy, 2014, 39, 18976–18983 CrossRef CAS
.
- Y. Wu, Y. Guo, H. Yu, X. Jiang, Y. Zhang, Y. Qi, K. Fu, L. Xie, G. Li, J. Zheng and X. Li, CCS Chem., 2021, 3, 974–984 CrossRef
.
- Y. Dong, M. Yang, T. Zhu, X. Chen, G. Cheng, H. Ke and H. Cheng, ACS Appl. Energy Mater., 2018, 1, 4285–4292 CrossRef CAS
.
- K. Stark, V. N. Emel’yanenko, A. A. Zhabina, M. A. Varfolomeev, S. P. Verevkin, K. Müller and W. Arlt, Ind. Eng. Chem. Res., 2015, 54, 7953–7966 CrossRef CAS
.
- K. Stark, P. Keil, S. Schug, K. Müller, P. Wasserscheid and W. Arlt, J. Chem. Eng. Data, 2016, 61, 1441–1448 CrossRef CAS
.
- N. Bruckner, K. Obesser, A. Bosmann, D. Teichmann, W. Arlt, J. Dungs and P. Wasserscheid, Chemsuschem, 2014, 7, 229–235 CrossRef PubMed
.
- A. Leinweber and K. Müller, Energy Technol., 2018, 6, 513–520 CrossRef CAS
.
- H. Jorschick, P. Preuster, S. Dürr, A. Seidel, K. Müller, A. Bösmann and P. Wasserscheid, Energy Environ. Sci., 2017, 10, 1652–1659 RSC
.
- P. Bachmann, M. Schwarz, J. Steinhauer, F. Spath, F. Dull, U. Bauer, T. N. Silva, S. Mohr, C. Hohner, M. Scheuermeyer, P. Wasserscheid, J. Libuda, H. P. Steinruck and C. Papp, J. Phys. Chem. C, 2018, 122, 4470–4479 CrossRef CAS
.
- C. N. M. Ouma, P. M. Modisha and D. Bessarabov, Appl. Surf. Sci., 2019, 471, 1034–1040 CrossRef CAS
.
- M. Yang, G. E. Cheng, D. D. Xie, T. Zhu, Y. Dong, H. Z. Ke and H. S. Cheng, Int. J. Hydrogen Energy, 2018, 43, 8868–8876 CrossRef CAS
.
- Y. Dong, M. Yang, L. Li, T. Zhu, X. Chen and H. Cheng, Int. J. Hydrogen Energy, 2019, 44, 4919–4929 CrossRef CAS
.
- Z. Chen, M. Yang, T. Zhu, Z. Zhang, X. Chen, Z. Liu, Y. Dong, G. Cheng and H. Cheng, Int. J. Hydrogen Energy, 2018, 43, 12688–12696 CrossRef CAS
.
- W. Z. Aditya Kulkarni and B. Torok, Org. Lett., 2011, 13, 4 CrossRef PubMed
.
- D. Clarisse, B. Fenet and F. Fache, Org. Biomol. Chem., 2012, 10, 6587–6594 RSC
.
- M. Y. Yuan Dong, T. Zhu, X. Chen, C. Li, H. Ke and H. Cheng, Energy Technol., 2018, 6, 5 Search PubMed
.
- Y. Dong, M. Yang, Z. Yang, H. Ke and H. Cheng, Int. J. Hydrogen Energy, 2015, 40, 10918–10922 CrossRef CAS
.
- H. Bernas, N. Kumar, A. Aho, R. Leino and D. Y. Murzin, Catal. Commun., 2014, 56, 41–44 CrossRef CAS
.
- L. Li, M. Yang, Y. Dong, P. Mei and H. Cheng, Int. J. Hydrogen Energy, 2016, 41, 16129–16134 CrossRef CAS
.
- R. Xu, S. Chakraborty, H. Yuan and W. D. Jones, ACS Catal., 2015, 5, 6350–6354 CrossRef CAS
.
- X. F. Ye, Y. An and G. H. Xu, J. Alloys Compd., 2011, 509, 152–156 CrossRef CAS
.
- F. Sotoodeh, L. Zhao and K. J. Smith, Appl. Catal., A, 2009, 362, 155–162 CrossRef CAS
.
| This journal is © The Royal Society of Chemistry 2021 |


