 Open Access Article
Improved liquid–liquid extraction by modified magnetic nanoparticles for the detection of eight drugs in human blood by HPLC-MS†
Feiyu Yang *,
Ke Ma,
Yu Cao and
Chunfang Ni
Shanghai Key Laboratory of Crime Scene Evidence, Shanghai Research Institute of Criminal Science and Technology, Shanghai 200083, China. E-mail: yangfyhit@sina.com; Fax: +86 021 22028363; Tel: +86 021 22028362
First published on 2nd June 2021
Abstract
Magnetic nanoparticles modified with porous titanium dioxide were used as clean-up nanospheres for the detection of eight drug poisons in human blood by high-performance liquid chromatography-mass spectrometry. The magnetic clean-up nanospheres (Fe3O4@mTiO2) with a mesoporous structure were successfully synthesized and characterized by scanning electron microscopy/energy dispersive spectroscopy, transmission electron microscopy, X-ray diffractometry, vibrating sample magnetometry, infrared spectroscopy, and Brunauer–Emmett–Teller techniques. Lipid co-extractives, such as phosphatidic acid and fatty acids, which are major interferences in HPLC-MS analysis causing ion suppression in the MS spectra of blood, could be efficiently removed by Fe3O4@mTiO2 based on the Lewis acid–Lewis base interactions. Following the optimization of the quantities of Fe3O4@mTiO2, the method was applied to the determination of eight drugs in spiked blood. The analytical ranges typically extended from 2 to 500 ng mL−1, and the recoveries ranged from 79.5–99.9% at different concentrations of blood. The limits of quantitation for drug poisons were 0.14–1.03 ng mL−1, which makes the method a viable tool for drug poison monitoring in blood.
1. Introduction
In recent years, various types of drugs, including estazolam, zolpidem, clozapine, triazolam, alprazolam, nimetazepam, meperidine and methadone, have become widely distributed, and are now causing social problems throughout many parts of the world. Nowadays, these drugs seem to have become more widespread than before and sometimes even cause death.1–5 Blood is the primary biological fluid of choice for toxicology analysts to work in criminal cases; however, other matrices are often tested to either substantiate the concentrations found in blood or in instances of a limited sample. So sample pretreatment, including the extraction and purification of analytes, is one of the most important processes in the determination of trace-level drugs and metabolites in biological samples.6 Sample pretreatment often requires time-consuming and labor-intensive handling, and inappropriate processing can lead to incorrect results. Also, it represents a bottleneck especially for the trace analysis of complex blood matrices.In general, blood sample preparation consists of extraction, clean-up, and the pre-concentration of target compounds from human blood. Today, the most popular blood pretreatment methods, such as, liquid–liquid extraction (LLE), solid-phase extraction (SPE), and protein precipitation, have been used in the analysis of drugs in human blood. Nevertheless, these traditional methods are laborious, time-consuming, and require large volumes of samples and toxic organic solvents, and it is sometime easy to lose analytes in the process. Therefore developing quicker and simpler sample preparation may help save time and ensure little loss of the target. Recently, “Quick, Easy, Cheap, Effective, Rugged, Safe (QuEChERS)” protocols, which emerged in 2003, offering the determination of pesticide residues in fruits and vegetables,7 were also adopted in the analysis of the drugs of forensic interest in blood, including benzodiazepines and abused drugs,8–10 as well as in the study of designer drugs in the postmortem samples of fatal cases.11–14 This method can effectively purify blood from various contaminants. One of the main advantages of this new technique with respect to liquid/liquid extraction is that it gives cleaner extract, also facilitated due to the ease of isolating the organic layer and the absence of emulsions.15–18 Roughly speaking, QuEChERS consists of adding salts to the analyzed matrix, previously mixed in a polar solvent (acetonitrile), and then performing a dispersive clean-up by adding some adsorbant, such as octadecyl bonded silica (C18), primary secondary amine (PSA), and graphitized carbon black (GCB) materials.19
Although in the original QuEChERS method, the samples were extracted by two different steps, we developed a simplified and similar QuEChERS method without the first step of adding salts, instead using non-aqueous solution ethyl acetate, which we here call the improved liquid–liquid extraction by modified magnetic nanoparticles for blood samples. This simplified method only makes use of functional magnetic clean-up nanospheres to purify the impurities from the blood matrix without the need for a centrifugal step. In recent decades, the application of magnetic nanomaterials as a sorbent in the clean-up or SPE procedure has attracted remarkable interest due to their high adsorption capacity as a consequence of the high surface area-to-volume ratio of the sorbent.20 Due to their simple-phase separation in extraction, magnetic Fe3O4 nanoparticles as well as magnetic Fe3O4 nanoparticles modified with 3-(N,N-diethylamino)propyltrimethoxysilane or ZrO2 were synthesized and utilized as clean-up adsorbents to determine the multipesticides residue in blood, vegetables, fruits, grains, and earthworms.21,22 In addition to Fe(III) and Zr(IV), metal oxides may also be applied to selectively concentrate phosphopeptides from complex samples, because analytes possessing phosphate functional groups can self-assemble onto the surfaces of metal oxide particles. Especially, nanocrystalline titanium dioxide has been employed for the extraction of phosphates, phospholipids, and phosphopeptides for better coordination between the phosphate and metal ions.23
In this study, we used mesoporous TiO2-modified Fe3O4 to further improve the affinity and capacity of adsorbants, because mesoporous materials possess regular pore structures, which are useful for material adsorption, storage, and selection based on the enhanced surface area.24 A rapid method to detect and quantify eight commonly used drugs in blood is presented herein involving improved liquid–liquid extraction by modified magnetic nanoparticles. The magnetic clean-up nanospheres were successfully synthesized and utilized to extract the blood species, obtaining acceptable recoveries. This simple extraction procedure minimized the matrix effects, such as the lipid co-extractives phosphatidic acid and fatty acids, which are major interferences in HPLC-MS analysis by causing ion suppression. The method was validated using an internal standard to evaluate the linearity, intra- and interday reproducibility, and for recovery the studies of 55 blood samples. The matrix effects (MEs) were also evaluated with good results for the target compounds. To the best of our knowledge, this work represents the first approach for the analysis of drugs in blood using modified mesoporous magnetic particles, thus providing a rapid, sensitive, and selective analytical methodology for forensic toxicological measurements.
2. Materials and methods
2.1 Reagents and equipment
1.0 mg mL−1 of estazolam, 1.0 mg mL−1 of zolpidem, 1.0 mg mL−1 of clozapine, 1.0 mg mL−1 of triazolam, 1.0 mg mL−1 of alprazolam, 1.0 mg mL−1 of nimetazepam, 1.0 mg mL−1 of meperidine, 1.0 mg mL−1 of methadone were obtained from the National Institute for Food and Drug control (Beijing, China) and Cerilliant Corporation (Darmstadt, Germany). The acetone, methanol, ethanol, acetonitrile, ethyl acetate, ethylene glycol, sodium acetate, ferric chloride, trisodium citrate, dimethylformamide, isopropanol, and titanium butoxide were purchased from Beijing Chemicals Corporation (Beijing, China). The syringe filters were purchased from Xingya (Shanghai). All other chemicals were used as received without further purification.Scanning electron microscopy (SEM) images were recorded on a S3400N scanning electron microscope (Hitachi, Japan) operating at 20 kV. Energy dispersive spectroscopy (EDS) analysis was performed on the surface of the nanomaterials to obtain the composition. A thin gold film was sprayed on the sample before measurement. Transmission electron microscopy (TEM) images were taken with a JEOL 2011 microscope (Japan) operated at 200 kV. Samples were first dispersed in ethanol and then collected using carbon-film-covered copper grids for analysis. Infrared spectra were recorded by a Nicolet 6700 FT-IR spectrophotometer (Nicolet, USA) using KBr pellets. The magnetic properties were analyzed through a vibrating sample magnetometer (Quantum Design, USA). The Quantachrome Quadrasorb SIII instrument was used to examine the specific surface area of the samples by Brunauer–Emmett–Teller (BET) measurements of the N2 adsorption–desorption isotherms.
2.2 Preparation of the standard solutions
Stock solutions of estazolam, zolpidem, clozapine, triazolam, alprazolam, nimetazepam, meperidine, and methadone were diluted with acetonitrile to 100 μg mL−1. The mixed working solutions were prepared in methanol at 10 μg mL−1. The blood samples obtained from the subjects in the cases accepted by Shanghai Institute of Forensic Science of 100 μL containing estazolam, zolpidem, clozapine, triazolam, alprazolam, nimetazepam, meperidine, and methadone at 20 and 100 ng mL−1 were prepared. The internal standard working solutions for blood samples containing benzoylecgonine-d3(BE-d3) and norcocaine-d3 (NC-d3) were prepared in methanol at 100 ng mL−1. All the solutions were stored at 4 °C.2.3 Chromatography conditions
Chromatographic separation was performed on an Agilent HPLC 1200 system with a C18 column (Agilent Eclipse XDB C18, 4.5 mm × 150 mm, 5 μm) equipped with a guard column (Agilent Eclipse XDB C18, 4.5 mm × 12.5 mm, 5 μm), a G1311A quaternary pump, a G1329A autosampler, and a G1316A column oven.The mobile phase was composed of solvent A (2 mM ammonium formate and 0.05% formic acid in water) and solvent B (2 mM ammonium formate and 0.05% formic acid in acetonitrile). The column was maintained at 45 °C and eluted with a gradient of 10% B (0–1 min), 10–30% B (1–2 min), 30–50% B (2–6 min), 50–70% B (6–13 min), and 70–95% B (13–13.5 min), and the column was then flushed with 95% B (13.5–16.5 min), 95–10% B (16.5–18 min). The total run time was 18 min at a flow rate of 0.20 mL min−1. The temperature of the auto–sampler prior to analysis was maintained at 8 °C. The injection volume was fixed at 5 μL in the partial loop with the needle overfill mode.
2.4 Mass spectrometric conditions
Mass spectrometry was performed on an AB SCIEX API 4000 linear ion QTRAP quadrupole mass spectrometer (USA) equipped with an electrospray ionization (ESI) interface in the positive ion mode. The tandem mass spectrometer was operated under the multiple reaction monitoring mode, Q1 and Q3. Diluted stock solutions of each analyte and the internal standards were prepared in order to obtain the appropriate multiple reaction monitoring mode parameters. The optimal parameters were as follows: ion spray voltage, 5500 V; entrance potential, 10 V; collision cell exit potential, 10 V; curtain gas flow, 30 psi; nebulizer gas and heating gas pressures (GS1 and GS2), 50 and 60 psi, respectively, the collisional activated dissociation gas setting was medium, and the source temperature was set at 600 °C. The cone voltage (CV) was optimized to get the maximum intensity of the protonated molecular species [M + H]+. The specific parameters for each analyte are shown in Table 1.| Compound | [M + H]+ (m/z) | Retention time (min) | Collision energy (eV) | Quantitation (m/z) | Scan time (s) |
|---|---|---|---|---|---|
| Estazolam | 295.1 | 9.41 | 35 | 267.4 | 0.3 |
| 55 | 205.1 | ||||
| Zolpidem | 308.2 | 8.02 | 36 | 263.2 | 0.3 |
| 51 | 235.2 | ||||
| Clozapine | 327.1 | 8.17 | 33 | 270.2 | 0.3 |
| 63 | 192.1 | ||||
| Triazolam | 344.1 | 9.62 | 37 | 308.3 | 0.3 |
| 60 | 239.2 | ||||
| Alprazolam | 309.2 | 9.54 | 58 | 205.2 | 0.3 |
| 37 | 281.2 | ||||
| Nimetazepam | 296.1 | 10.34 | 36 | 250.1 | 0.3 |
| 31 | 268.1 | ||||
| Meperidine | 248.2 | 8.00 | 31 | 220.1 | 0.3 |
| 30 | 174.3 | ||||
| Methadone | 310.5 | 8.85 | 22 | 265.4 | 0.3 |
| 42 | 105.2 |
2.5 Synthesis of the magnetic clean-up nanospheres
The superparamagnetic Fe3O4 particles were prepared according to a solvothermal reaction.25 Typically, FeCl3 (1.65 g, 10.0 mmol) and trisodium citrate (0.40 g, 1.36 mmol) were first dissolved in ethylene glycol (40 mL), and afterward, sodium acetate (2.40 g) was added with stirring. The mixture was stirred vigorously for 30 min and then sealed in a Teflon-lined stainless-steel autoclave (50 mL capacity). The autoclave was heated at 200 °C and maintained for 10 h, and then allowed to cool to room temperature. The black products were washed with ethanol and water three times.The preparation procedure of Fe3O4@mTiO2 included the following steps. First, the as-synthesized Fe3O4 (200 mg) was dispersed in dimethylformamide (45 mL) and isopropanol (130 mL) under ultrasonication for 10 min. Then, titanium butoxide (10 mL) was added to the above mixture. The mixture was stirred vigorously for 10 min and then sealed in a Teflon-lined stainless-steel autoclave (200 mL capacity). The autoclave was heated at 200 °C and maintained for 10 h, and then allowed to cool to room temperature. The final products were washed with ethanol and water, and then dried overnight at 60 °C.
2.6 Sample preparation and preprocessing process
For the present study, standard solutions were added into 100 μL anticoagulant blood samples in glass centrifuge tubes, which were then stored at 4 °C in the dark. Consequently, 10 mg magnetic clean-up nanospheres, 100 μL of 5% ammonium hydroxide–ammonium acetate solution (pH 12.0), and 1 mL ethyl acetate were accordingly mixed into the blood samples solutions for about 10 min. Subsequently, a strong magnet was placed at the bottom of the centrifuge tube so that ∼900 μL supernatant was carefully transferred and dried with nitrogen and then redissolved in 100 μL of methanol. Finally, 5 μL of this solution was injected into the HPLC-MS system for analysis.2.7 Method validation
The working standard mixture solution at a concentration of 10 μg mL−1 was prepared by appropriate dilution of the stock standard solutions with methanol. These solutions were stored at 4 °C in the dark. Spiked recoveries for assessing the method precision and accuracy and matrix effects were performed at concentrations of 20 and 100 ng mL−1 for 8 drugs in anticoagulant blood samples. The spiked samples were homogenized in a tube and stored at 4 °C for about 24 h. The method was evaluated by linearity, LOD and LOQ, precision, and accuracy. Calibration standards in acetonitrile with concentrations of 2.0, 5.0, 10.0, 20.0, 50.0, 100.0, 200.0, 300.0, and 500.0 ng mL−1 were prepared for the calibration curves. The limit of detection (LOD) and the limit of quantification (LOQ) were determined based on a signal-to-noise ratio of 3 (S/N = 3) and 10 (S/N = 10), respectively.2.8 Precision and accuracy
Three validation batches were assayed to assess the accuracy and precision of the method. Each batch included a set of calibration standards and four replicates of spiked samples at two concentration levels (20.0 and 100.0 ng mL−1), and was processed on three separate days. Intra-assay precision was evaluated by replicate (n = 5) analysis of the spiked samples in one run. Inter-assay precision was evaluated by replicate analysis of the spiked samples in the experiments performed on three different days. The accuracy of the assay was expressed by comparing the calculated concentrations of the spiked samples to their respective nominal values × 100% and the precision was evaluated by the relative standard deviation (RSD).3. Results and discussion
3.1 Characterization of the magnetic clean-up sorbent
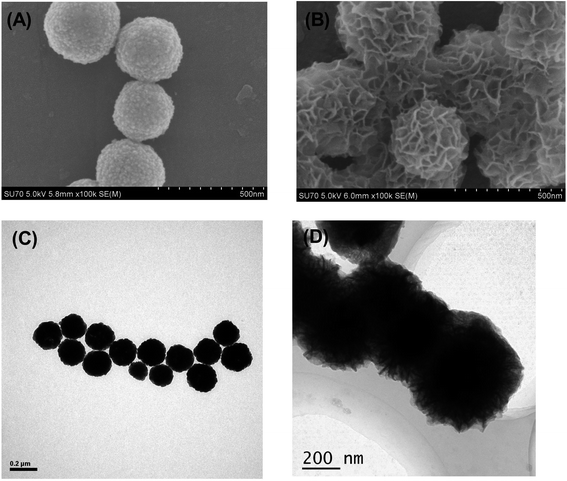
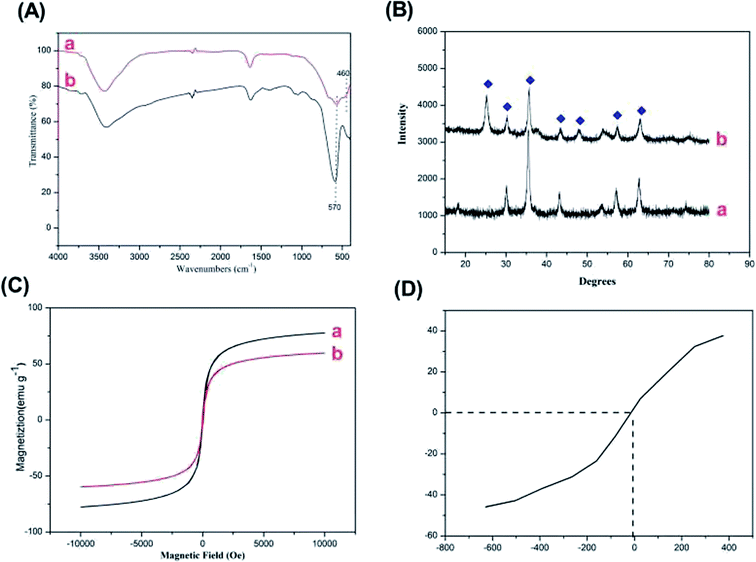
The N2 adsorption–desorption measurements were carried out for the activated Fe3O4@TiO2 particles samples in order to evaluate the permanent porosity. The particles exhibits reversible type IV isotherms (Fig. S2†), which is one of the main characteristics of mesoporous materials. The surface area and pore diameter were calculated to be 38.735 m2 g−1 and 3.933 nm. Specifically, the Fe3O4@TiO2 particles in the aqueous solutions had electric charges due to the (de)protonation of the acid–base surface hydroxyl groups by the dissociative chemisorption of water molecules. The charges adsorbed anions and cations from the phosphatidic acid and fatty acids to maintain electric neutrality, resulting in ion exchange.26 TiO2 can be expressed as a Lewis acid in solution for its cation-exchange tendency and can absorb Lewis base groups from phosphatidic acid and fatty acid compounds under alkaline conditions.27 Notably, the mesoporous shell structure of the Fe3O4@mTiO2 microspheres not only possessed a high specific surface and amount of affinity sites to ensure the high loading capacity of phosphatidic acid and fatty acids but also provided large pores for protein and other matrix interferences to ingress and small pores to allow diffusion of the reactants and resulting digests.
3.2 Optimization of the magnetic Fe3O4@mTiO2 improved the liquid–liquid extraction conditions
3.3 Removal of the matrix interference
3.4 Recycling and reproducibility of Fe3O4@mTiO2
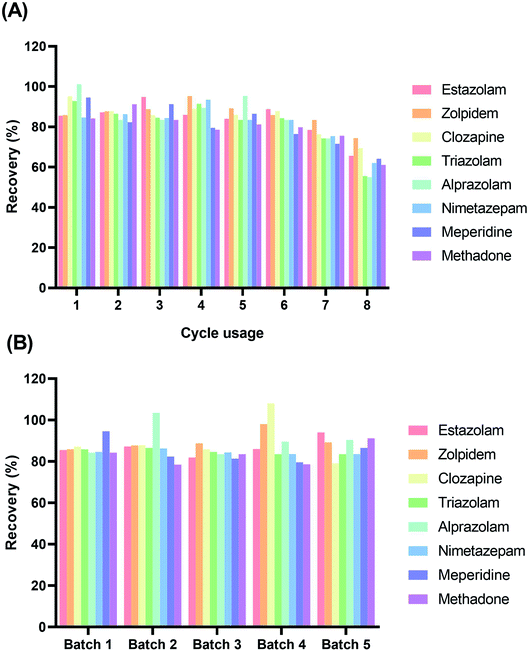
The Fe3O4@mTiO2 could be regenerated by treating the adsorbents sequentially by ultrasonic washing with acetone, ethanol, and water. The Fe3O4@mTiO2 was dried at 60 °C again in vacuum for its next use. In our study, the effectiveness of the regeneration of Fe3O4@mTiO2 on the blood samples was evaluated by spiking eight drugs at a concentration of 100.0 ng mL−1 and two internal standard working solutions. The results are shown in Fig. 5A. The Fe3O4@mTiO2 could be reused at least six times without much sacrificing the recoveries (>77.9%). Furthermore, the batch stability of the Fe3O4@mTiO2 was also evaluated. Fig. 5B displays the recoveries of the eight drugs by the five batches of Fe3O4@mTiO2, which indicated that the absolute deviation in the recovery of each drug from the five batches was <12.5%. All the results demonstrated that the preparation of the Fe3O4@mTiO2 had satisfactory reproducibility and repeatability.3.5 Verification of the proposed method
For the analysis of anticoagulant blood samples, the linearity of calibration curves made by peak area (y) versus concentration (x, ng mL−1) was studied using calibration standards in anticoagulant blood samples at nine concentrations of 2.0, 5.0, 10.0, 20.0, 50.0, 100.0, 200.0, 300.0, and 500.0 ng mL−1. Under the optimized condition, the linearities for eight drugs in the anticoagulant blood samples were in the range of 2–500 ng mL−1 with correlation coefficients (r) of more than 0.9944, as shown in Table 2. The LOD and LOQ, which were calculated on the analysis of the eight drugs in blank extracts spiked at a low level (0.01, 0.05, 0.1, 0.25, 0.5, and 1.0 ng mL−1) in blank samples that yielded an S/N ratio of 3 and 10, were in the range of 0.04–0.33 and 0.14–1.03 ng mL−1, respectively. The stability, accuracy, and precision were assessed based on the analysis of the eight drugs spiked at 20.0 and 100.0 ng mL−1 in blank blood samples. Table 2 shows that the majority of the mean recoveries were in the range of 79.5–99.9% at the two spiking levels, wherein the associated intraday RSDs varied from 2.2% to 9.9% and the interday RSDs varied from 6.4% to 11.2%.| Analytes | Linear range ng mL−1 | r | LOD (ng mL−1) | LOQ (ng mL−1) | Intra-day/inter-day variation (%) | Recoverya (%) 20 ng mL−1 (%RSD) | Recoveryb (%) 100 ng mL−1 (%RSD) |
|---|---|---|---|---|---|---|---|
| a Spiked at 20 ng mL−1.b Spiked at 100 ng mL−1. | |||||||
| Estazolam | 2–500 | 0.9974 | 0.05 | 0.15 | 3.4/8.1 | 96.8 (9.8) | 88.6 (2.4) |
| Zolpidem | 2–500 | 0.9981 | 0.06 | 0.19 | 4.1/6.4 | 98.3 (2.8) | 95.6 (3.9) |
| Clozapine | 2–500 | 0.9969 | 0.21 | 0.62 | 2.2/8.6 | 99.3 (4.3) | 99.9 (1.3) |
| Triazolam | 2–500 | 0.9944 | 0.14 | 0.45 | 5.1/6.4 | 89.3 (5.8) | 85.3 (4.7) |
| Alprazolam | 2–500 | 0.9962 | 0.33 | 1.03 | 4.5/7.4 | 81.1 (2.4) | 98.3 (9.9) |
| Nimetazepam | 2–500 | 0.9992 | 0.08 | 0.32 | 3.3/11.2 | 93.3 (5.6) | 95.3 (10.4) |
| Meperidine | 2–500 | 0.9983 | 0.04 | 0.14 | 9.9/8.2 | 80.3 (5.7) | 89.1 (4.6) |
| Methadone | 2–500 | 0.9946 | 0.10 | 0.34 | 5.3/7.6 | 79.5 (6.1) | 87.2 (7.1) |
Furthermore, a comparison study among different methods in the literature for blood sample preparation was also picked out, and the results are shown in Table 3. Comparing the proposed procedure with other procedures, the improved liquid–liquid extraction does not need to be packed into the SPE cartridge but can be dispersed in the sample extraction instead. The proposed method gives a faster way for cleaning blood samples and provides a relatively lower LOD. This good performance was due to the larger specific surface area and selective absorption ability of the absorbent.
| Sample | Extraction method | Adsorbent | Detecting instrument | Pretreatment time | Method LOD, (ng mL−1) recoveries | Reference |
|---|---|---|---|---|---|---|
| Blood | SPE | Oasis MCX | UHPLC-QTOF-MS/MS | 90 min | 0.2–16 | 28 |
| 41–114.3% | ||||||
| Blood | Automated SPE | Hysphere MM anion | LC-MS/MS | ∼30 min | 3–16 | 29 |
| — | ||||||
| Hair | SPE | MCX, Oasis, | LC-ESI-MS/MS | 80 min | 5–30 | 30 |
| — | ||||||
| Urine | SPE | Unkown | GC-MS | 60 min | ∼1 | 31 |
| >80% | ||||||
| Plasma | SPE | C18, HLB | LC-MS/MS | 65 min | — | 32 |
| 71–92/4% | ||||||
| Blood | Magnetic-LLE | Magnetic adsorbents | HPLC-MS | 15 min | 0.14–1.03 | This work |
| 79.5–113.2% |
3.6 Application to real case samples
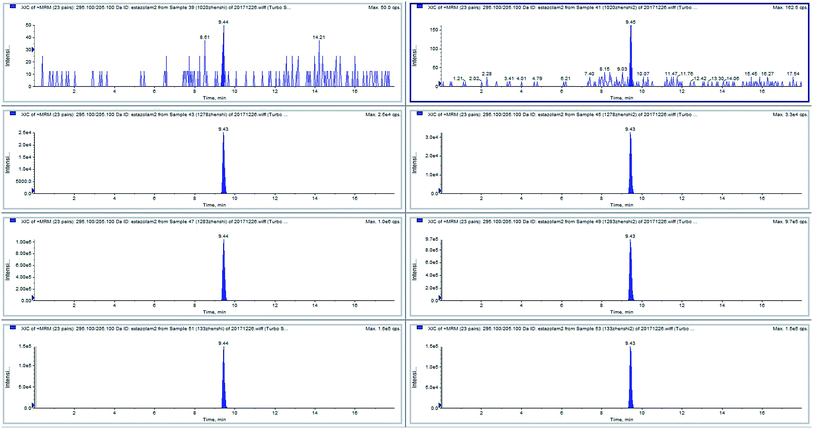
Some positive samples and negative samples were selected (n = 55, stored at −20 °C) during the four years period of 2017–2020. The traditional method used liquid–liquid extraction pre-processing, which was cumbersome. Using our improved magnetic liquid–liquid extraction pre-processing method, the pre-processing of multiple samples could be performed in one experiment, and the drug residues in trace blood samples could be quantitatively analyzed. The data showed that the quantitative value of the positive sample was slightly different from that of the previous positive sample. It may be that the sample had been stored for too long and the target analyte had degraded, but the composite rate of the positive sample and negative sample were highly consistent, which indicated the robustness of this method. The test results of samples 39 and 41 (two parallel samples from the same person) were negative for estazolam. Samples 43 and 45 (two parallel samples from the same person), samples 47 and 49 (two parallel samples from the same person), and samples 51 and 53 (two parallel samples from the same person) were positive for estazolam (Fig. 6).4. Conclusion
The development, optimization, and validation of an analytical methodology for the determination of eight drugs through cleaning up blood samples with Fe3O4@mTiO2 adsorbents were the main objectives of this study. For this purpose, the improved liquid–liquid extraction procedure with Fe3O4@mTiO2 magnetic nanoparticles followed by HPLC-MS was successfully applied for the target analytes' analysis. This simple extraction procedure could not only minimize the blood matrix effects, such as the lipid co-extractives phosphatidic acid and fatty acids, which are major interferences in HPLC-MS analysis in causing ion suppression, but also possessed many advantages, including a high adsorption capacity, low solvent consumption, low cost, and easy operation. Simultaneously, acceptable recoveries for the studied eight drugs ranged from 79.5–99.9% and the accuracy and precision of the proposed Fe3O4@mTiO2 improved liquid–liquid extraction method coupled with the HPLC-MS method were satisfactory. Furthermore, the present work provides a promising application for the analysis of other persistent drugs in complex biological samples.Conflicts of interest
There are no conflicts to declare.Acknowledgements
This research was supported by the Ministry of Public Security of the People's Republic of China (Grant No. 2019YYCXSHSJ052), Scientific and Innovative Action Plan of Shanghai (CN) (Grant No. 20dz1200103), Ministry of Public Security of the People's Republic of China (Grant No. 2018GABJC32) and Natural Science Foundation of Shanghai (Grant No. 18ZR1435000).References
- G. Heide, K. Hjelmeland, G. W. Brochmann, R. Karinen and G. Høiseth, The appearance, taste, and concentrations of zolpidem dissolved in still water and carbonated beverages, J. Forensic Sci., 2018, 63, 911–914 CrossRef CAS PubMed.
- S. P. Elliott and L. E. Hernandez, A series of deaths involving Carfentanil in the UK and associated post-mortem blood concentrations, J. Anal. Toxicol., 2018, 42, e41–e45 CrossRef CAS PubMed.
- F. Lin, J. Li, T. Li, X. H. Zhu and S. Wang, Rapid determination of 18 psychoactive drugs illegally added in health food by ultra-high performance liquid chromatography with photodiode array detector, Food Sci. Technol., 2013, 38, 303–308 CAS.
- H. Ashrafi, A. Mobed, M. Hasanzadeh, P. Babaie, K. Ansarin and A. Jouyban, Monitoring of five benzodiazepines using a novel polymeric interface prepared by layer by layer strategy, Microchem. J., 2019, 146, 121–125 CrossRef CAS.
- T. Chen and S. Wu, The detection of multiple illicit street drugs in liquid samples by direct analysis in real time (DART) coupled to Q-orbitrap tandem mass spectrometry, Forensic Sci. Int., 2016, 267, 1–6 CrossRef CAS PubMed.
- S. Matsuta, K. Nakanishi, A. Miki, K. Zaitsu, N. Shima, T. Kamata, H. Nishioka, M. Katagi, M. Tatsuno and K. Tsuboi, Development of a simple one-pot extraction method for various drugs and metabolites of forensic interest in blood by modifying the QuEChERS method, Forensic Sci. Int., 2013, 232, 40–45 CrossRef CAS PubMed.
- M. Anastassiades, S. J. Lehotay, D. Stajnbaher and F. J. Schenck, Fast and easy multiresidue method employing acetonitrile extraction/partitioning and dispersive solid-phase extraction for the determination of pesticide residues in produce, J. AOAC Int., 2003, 86, 412–431 CrossRef CAS PubMed.
- L. Anzillotti, S. Odoardi and S. Strano-Rossi, Cleaning up blood samples using a modified “QuEChERS” procedure for the determination of drugs of abuse and benzodiazepines by UPLC-MSMS, Forensic Sci. Int., 2014, 243, 99–106 CrossRef CAS PubMed.
- P. D. DeArmond, M. K. Brittain, G. E. J. Platoff and D. T. Yeung, QuEChERS-based approach toward analysis of two insecticides methomyl & aldicarb in blood and brain tissue, Anal. Methods, 2015, 7, 321–328 RSC.
- K. Hasegawa, A. Wurita, K. Minakata, K. Gonmori, H. Nozawa, I. Yamagishi, K. watanable and O. Suxuki, Postmortem distribution of flunitrazepam and its metabolite 7-aminoflunitrazepam in body fluids and solid tissues in an autopsy case: Usefulness of bile for their detection, Leg. Med., 2015, 17, 394–400 CrossRef CAS PubMed.
- K. Hasegawa, A. Wurita, K. Minakata, K. Gonmori, H. Nozawa, I. Yamagishi, K. watanable and O. Suxuki, Postmortem distribution of MAB-CHMINACA in body fluids and solid tissues of a human cadaver, Forensic Toxicol., 2015, 33, 380–387 CrossRef CAS PubMed.
- K. Usui, T. Aramaki, M. Hashiyada, Y. Hayashizaki and M. Funayama, Quantitative analysis of 3,4-dimethylmethcathinone in blood and urine by liquid chromatography-tandem mass spectrometry in a fatal case, Leg. Med., 2014, 16, 222–226 CrossRef CAS PubMed.
- A. Wurita, K. Hasegawa, K. Minakata, K. Gonmori, H. Nozawa, I. Yamagishi, O. Suzuki and K. Watanabe, Postmortem distribution of α-pyrrolidinobutiophenone in body fluids and solid tissues of a human cadaver, Leg. Med., 2014, 16, 241–246 CrossRef CAS PubMed.
- K. Kudo, Y. Usumoto, H. R. Kikura, N. Sameshima, A. Tsuji and N. Ikeda, A fatal case of poisoning related to new cathinone designer drugs, 4-methoxy PV8, PV9, and 4-methoxy PV9, and a dissociative agent, diphenidine, Leg. Med., 2015, 17, 421–426 CrossRef CAS PubMed.
- M. P. Dybowski and A. L. Dawidowicz, Application of the QuEChERS procedure for analysis of Δ9-tetrahydrocannabinol and its metabolites in authentic whole blood samples by GC-MS/MS, Forensic Toxicol., 2018, 36, 415–423 CrossRef CAS PubMed.
- A. Pouliopoulos, E. Tsakelidou, A. Krokos, H. G. Gika, G. Theodoridis and N. Raikos, Quantification of 15 psychotropic drugs in serum and postmortem blood samples after a modified mini-QuEChERS by UHPLC-MS-MS, J. Anal. Toxicol., 2018, 42, 337–345 CrossRef CAS PubMed.
- J. E. Ferrari and E. D. Caldas, Simultaneous determination of drugs and pesticides in postmortem blood using dispersive solid-phase extraction and large volume injectionprogrammed temperature vaporization-gas chromatography-mass spectrometry, Forensic Sci. Int., 2018, 290, 318–326 CrossRef PubMed.
- A. Luca, O. Sara and S. R. Sabina, Cleaning up blood samples using a modified “QuEChERS” procedure for the determination of drugs of abuse and benzodiazepines by UPLC–MSMS, Forensic Sci. Int., 2014, 243, 99–106 CrossRef PubMed.
- K. Pascal, Bioanalytical procedures for detection of chemical agents in hair in the case of drug-facilitated crimes, Anal. Bioanal. Chem., 2007, 388, 1467–1474 CrossRef PubMed.
- P. S. Cai, X. Xiong, D. Li, Y. Zhou and C. M. Xiong, Magnetic solid-phase extraction coupled with UHPLC–MS/MS for four antidepressants and one metabolite in clinical plasma and urine samples, Bioanalysis, 2020, 12(1), 35–52 CrossRef CAS PubMed.
- Y. H. Sun, P. P. Qi, T. Cang, Z. W. Wang, X. Y. Wang, X. W. Yang, L. D. Wang, X. H. Xu, Q. Wang, X. Q. Wang and C. S. Zhao, High-throughput multipesticides residue analysis in earthworms by the improvement of purification method: Development and application of magnetic Fe3O4-SiO2 nanoparticles based dispersive solid-phase extraction, J. Sep. Sci., 2018, 41(11), 2419–2431 CrossRef CAS PubMed.
- T. X. Yu, T. Wang, Z. L. Huang, N. S. Huang, H. Zhang, Z. H. Luo, H. Li, S. J. Ding and W. L. Feng, Determination of multiple pesticides in human blood using modified QuEChERS method with Fe3O4 Magnetic nanoparticles and GC–MS, Chromatographia, 2017, 80, 165–170 CrossRef CAS.
- T. Chen and Y. C. Chen, Fe3O4/TiO2 core/shell nanoparticles as affinity probes for the analysis of phosphopeptides using TiO2 surface-assisted laser desorption/ionization mass spectrometry, Anal. Chem., 2005, 77, 5912–5919 CrossRef PubMed.
- K. Ariga, A. Vinu, Y. Yamauchi, Q. Ji and J. P. Hill, Nanoarchitectonics for mesoporous materials, Bull. Chem. Soc. Jpn., 2012, 85(1), 1–32 CrossRef CAS.
- J. B. Zhang, N. Gan, M. Y. Pan, S. C. Lin, Y. T. Cao, D. Z. Wu and N. B. Long, Separation and enrichment of six indicator polychlorinated biphenyls from real waters using a novel magnetic multiwalled carbon nanotube composite absorbent, J. Sep. Sci., 2015, 38(5), 871–882 CrossRef CAS PubMed.
- K. Tamura, Acid-base and charge characteristics of metal oxide particle surface and oxide affinity of ion, Resources Processing, 1998, 45(4), 276–281 CrossRef.
- M. Haghighi and K. Nikoofar, Nano TiO2/SiO2: An efficient and reusable catalyst for the synthesis of oxindole derivatives, J. Saudi Chem. Soc., 2016, 20(1), 101–106 CrossRef CAS.
- L. J. Xiong, R. Wang, C. Liang, F. Q. Cao, Y. L. Rao, X. Wang, L. B. Zeng, C. F. Ni, H. Y. Ye and Y. R. Zhang, Determination of ecgonine and seven other cocaine metabolites in human urine and whole blood by ultra-high-pressure liquid chromatography–quadrupole time-of-flight mass spectrometry, Anal. Bioanal. Chem., 2013, 405, 9805–9816 CrossRef CAS PubMed.
- E. Jagerdeo, M. A. Montgomery, M. A. LeBeau and M. S. ibum, An automated SPE/LC/MS/MS method for the analysis of cocaine and metabolites in whole blood, J. Chromatogr. B: Anal. Technol. Biomed. Life Sci., 2008, 874, 15–20 CrossRef CAS PubMed.
- L. Imbert, S. Dulaurent, M. Mercerolle, J. Morichon, G. Lachatre and J. M. Gaulier, Development and validation of a single LC-MS/MS assay following SPE for simultaneous hair analysis of amphetamines, opiates, cocaine and metabolites, Forensic Sci. Int., 2014, 234, 132–138 CrossRef CAS PubMed.
- W. L. Wang, W. D. Darwin and E. J. Cone, Simultaneous assay of cocaine, heroin and metabolites in hair, plasma, saliva and urine by gas chromatography-mass spectrometry, J. Chromatogr. B: Biomed. Sci. Appl., 1994, 660, 279–290 CrossRef CAS PubMed.
- D. S. Popa, L. Vlase, S. E. Leucuta and F. Loghin, Determination of cocaine and benzoylecgonine in human plasma by LC-MS/MS, Farmacia, 2009, 57, 301–308 CAS.
Footnote |
| † Electronic supplementary information (ESI) available. See DOI: 10.1039/d1ra01530c |
| This journal is © The Royal Society of Chemistry 2021 |

