DOI:
10.1039/D1RA01345A
(Paper)
RSC Adv., 2021,
11, 11804-11812
Optical and structural properties of the Fe3+-doped Lu3Al5O12:Ce3+ garnet phosphor
Received
18th February 2021
, Accepted 17th March 2021
First published on 23rd March 2021
Abstract
A novel series of Lu3Al5−xFexO12:Ce3+ (0.00 ≤ x ≤ 0.45) garnets were obtained by the solid-state reaction method at 1200 °C. The obtained materials were characterized by X-ray diffraction, Rietveld refinement, UV-Vis diffuse reflectance spectroscopy, absorption spectroscopy, and photoluminescence spectroscopy. Fe3+ doping allowed obtaining pure-phase materials at temperatures and times below those reported up to now. On the other hand, the materials reached an improved blue absorption and a tunable emission from green to orange. These optical properties are attributable to a red-shift phenomenon due to an increase of the crystal field splitting in the Ce3+ energy-levels. Moreover, the obtained phosphors exhibited a high quantum yield (55–67%), excellent thermal photoluminescence stability (up to 200 °C), and high color conversion, making the obtained phosphors promising candidates for w-LEDs.
1 Introduction
The structural and optical properties of garnets can be easily modified by changes in their chemical composition. The versatility in composition and the different methods to obtain garnets make them relevant materials in a wide variety of applications for new-generation devices.1 Among garnet-type materials, those constituted by rare-earth elements exhibit remarkable properties such as high thermal stability, optical isotropy, and high thermal conductivity.2–4 Due to the tunability of luminescence properties, garnets are promising materials for optical applications. For instance, Ce3+-doped yttrium aluminum garnet (YAG:Ce) is the most widely used phosphor in w-LED fabrication.5 Similarly, Ce3+-doped lutetium aluminum garnet (LuAG:Ce) exhibits remarkable optical properties, which allow its potential application in light-emitting diodes (LEDs), scintillators, and cathodoluminescent lamps.6–8
In recent years, white light-emitting diodes (w-LEDs) have become an important alternative to reduce energy expenditure, through the substitution of conventional light sources. The most common method for white light generation is the partial conversion of the blue light from the transmitter chip by the quantum cutting phenomenon or down-conversion.9 Therefore, phosphors with high thermal stability and quantum yield are an essential part of w-LEDs. Although the blue light conversion is an economic and efficient route for white light generation, it can lead to a poor color rendering due to the absence of the red component, limiting the domestic lighting applications.10 This led to the development of new orange-yellow-emitting phosphors that show a blue absorption and a broad emission with intense red component.11
Even though high Fe3+ concentrations in the rare-earth materials have quenched the photoluminescence properties because the samples turn dark, decreasing the quantum yield. Recently, an yttrium aluminum garnet (YAG) doped with Fe3+ (concentrations equal or less than 9%) exhibited a broad emission centered at 785 nm under 280 nm excitation. Similarly, the contribution of the Fe3+ impurities on the red component of the PL spectra was also reported for the YAG, YAG:Ce, and YAG:Ce,Cr phosphors.12 Then, this research focused on obtaining a novel series of Ce3+ and Fe3+ co-doped aluminum lutetium garnets (Lu3Al5−xFexO12:Ce3+) through the solid-state reaction method. The Fe3+ doping in octahedral and tetrahedral sites was performed to evaluate the effect on the structural and optical properties of the host garnet.
2 Experimental
2.1 Synthesis of the materials
Fe3+ doped Lu3Al5O12:Ce3+ garnets were prepared by a solid-state reaction method, using high purity (≥99.99%) precursors in powder: Lu2O3, Fe2O3, Al(OH)3 and CeO2. The precursors were previously calcined at 800 °C for 2 hours to eliminate volatile impurities, them stoichiometric mixtures according to the garnet composition Lu3−3yCe3yAl5−xFexO12 with y = 0.045, and x = 0.00, 0.05, 0.10, 0.15, 0.20, 0.25, 0.30, 0.35, 0.40 and 0.45 were ground, pressed into pellets under axial pressure of 2.5 MPa and sintered at 1200 °C for 20 hours.13 In addition, active carbon was used to provide a reducing atmosphere.
2.2 Characterization
The X-ray diffraction (XRD) patterns were recorded in a PANalytical X'Pert PRO-MPD equipment with Bragg–Brentano configuration, using CuKα radiation (λ = 1.5406 Å), and a scanning step of 0.02° in the 2θ range 15–75°. The structural analysis was made through the Rietveld refinement method, using the GSAS14 and PCW15 software suites. 3D visualization of the resultant unit cell was performed with the VESTA16 software package. Diffuse reflectance and optical absorption spectra were obtained using a Cary 5000 UV-Vis-NIR spectrophotometer. Photoluminescence spectra at room temperature and temperature-dependent photoluminescence were measured by a Hitachi F-7000 Spectrophotometer, using a Xe lamp of 150 W as the light source. The external quantum efficiency was measured using a barium sulfate coated integration sphere as a reflectance standard on the same spectrophotometer.
3 Results and discussion
3.1 Structural characterization
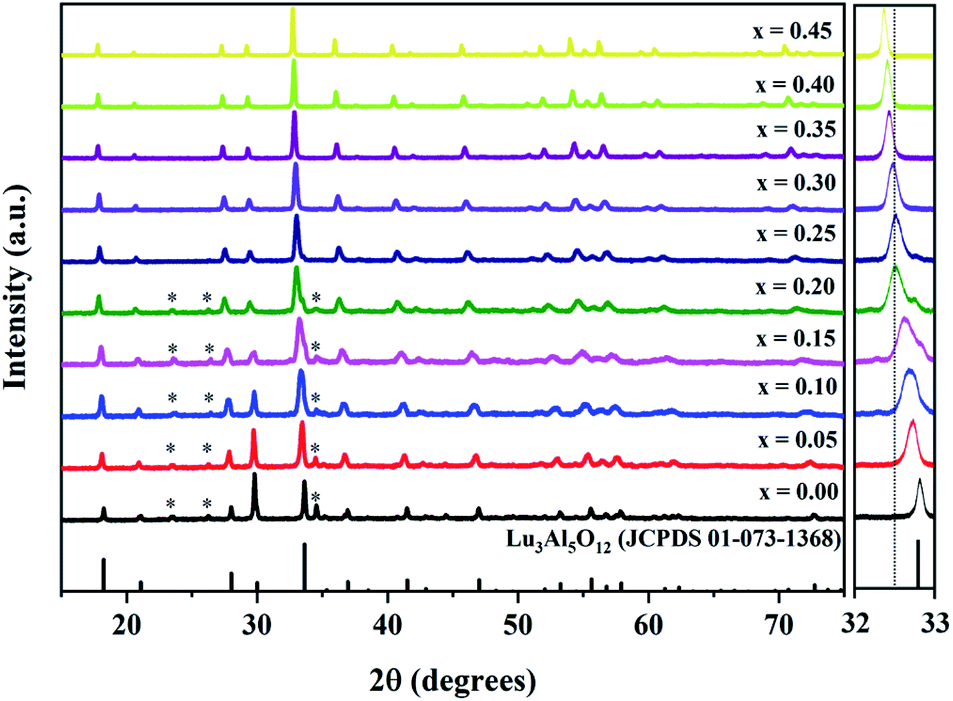
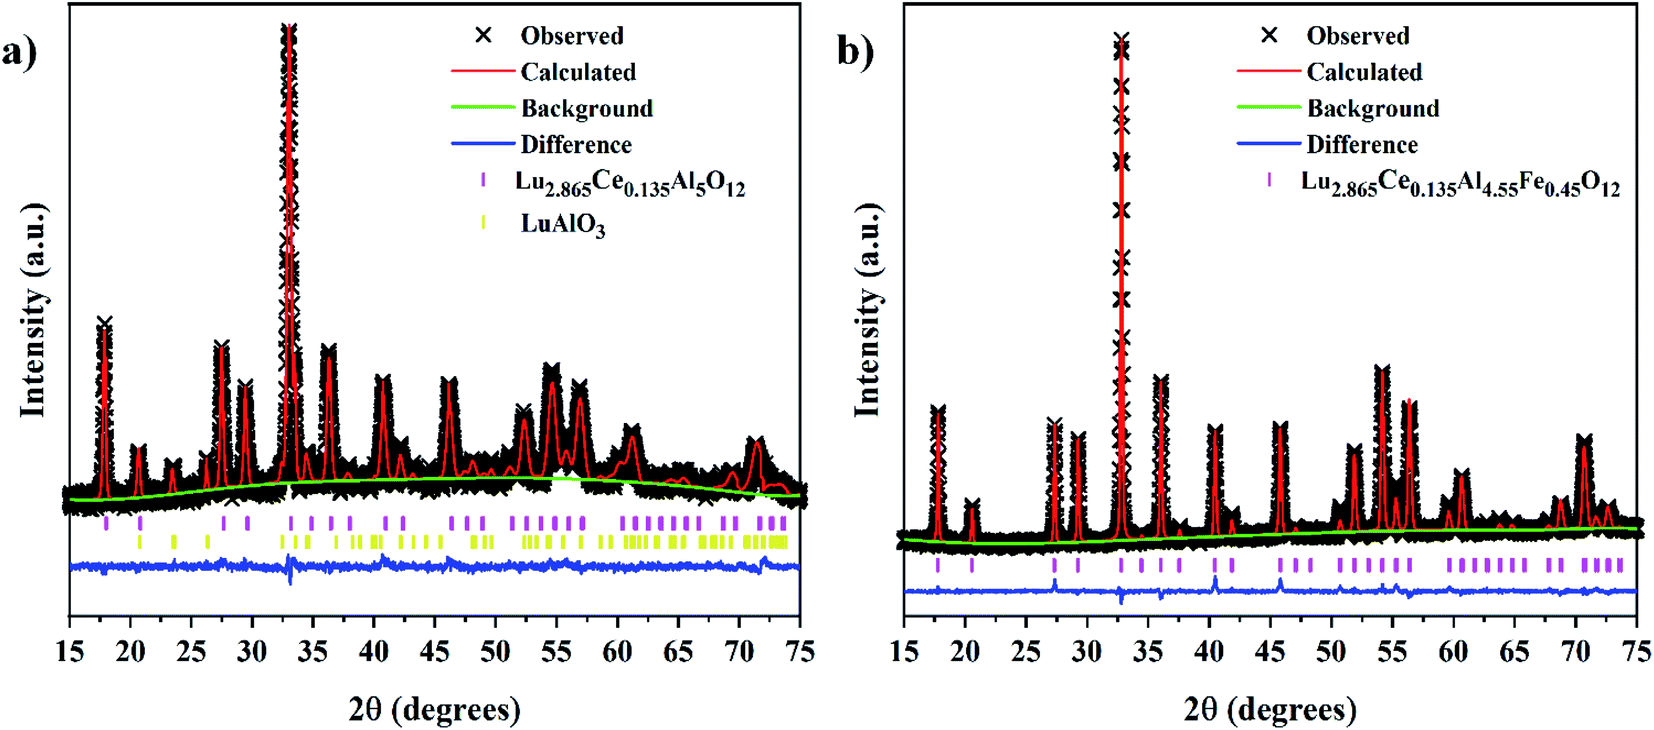
The XRD patterns of the Lu3Al5−xFexO12:Ce3+ samples (0.00 ≤ x ≤ 0.45) are shown in Fig. 1. By increasing the Fe3+ concentration, a slight shift of the diffraction peaks toward lower 2θ angles concentration was observed (right panel of Fig. 1). This is attributed to the larger ionic radius of Fe3+ (r = 6.75 Å) regard Al3+ (r = 5.85 Å). On the other hand, XRD peaks from secondary crystal phases (*) were observed in samples with x ≤ 0.20. Rietveld refinement was performed to determine the structural parameters and the composition for all samples produced. The refined XRD patterns for Lu3Al5−xFexO12:Ce3+ (x = 0.00 and 0.45) samples are shown in Fig. 2. The experimental pattern is identified as x symbol, the Bragg positions of each identified phase are shown in bars; red, green, and blue lines are the calculated pattern, background, and experimental difference, respectively. Structural data and residual factors of each sample are shown in Table 1. The samples exhibited a predominant crystal phase corresponding to Lu3Al5O12 garnet (JCPDS 01-073-1368) with cubic structure and space-group Ia![[3 with combining macron]](https://www.rsc.org/images/entities/char_0033_0304.gif) d (230). At low Fe3+ concentrations (0.00 ≤ x ≤ 0.20), LuAlO3 (JCPDS 00-024-0690) was identified as a secondary crystal phase. Nevertheless, single-phase materials were obtained with x values ≥ 0.25, which can be attributed to the fact that Fe3+ precursor has a lower melting point than the Al3+ precursor, favoring the ionic diffusion and the consolidation of garnet phase. The increase in the Fe3+ concentration led to the expansion of the unit cell, which is consistent with the shift of the XRD peaks and confirms the suitable Fe3+ insertion in the host structure (Fig. 3a). Fig. 3b displays a 3D view of the unit cell obtained from the refinement results for the Lu3Al5−xFexO12:Ce3+ (x = 0.00 and 0.45) garnet system. In the unit cell, Lu3+ and Ce3+ cations occupy 24(c) sites in dodecahedral coordination, Al3+ and Fe3+ cations occupy 24(d) sites in tetrahedral coordination, and 16(a) sites in octahedral coordination.
d (230). At low Fe3+ concentrations (0.00 ≤ x ≤ 0.20), LuAlO3 (JCPDS 00-024-0690) was identified as a secondary crystal phase. Nevertheless, single-phase materials were obtained with x values ≥ 0.25, which can be attributed to the fact that Fe3+ precursor has a lower melting point than the Al3+ precursor, favoring the ionic diffusion and the consolidation of garnet phase. The increase in the Fe3+ concentration led to the expansion of the unit cell, which is consistent with the shift of the XRD peaks and confirms the suitable Fe3+ insertion in the host structure (Fig. 3a). Fig. 3b displays a 3D view of the unit cell obtained from the refinement results for the Lu3Al5−xFexO12:Ce3+ (x = 0.00 and 0.45) garnet system. In the unit cell, Lu3+ and Ce3+ cations occupy 24(c) sites in dodecahedral coordination, Al3+ and Fe3+ cations occupy 24(d) sites in tetrahedral coordination, and 16(a) sites in octahedral coordination.
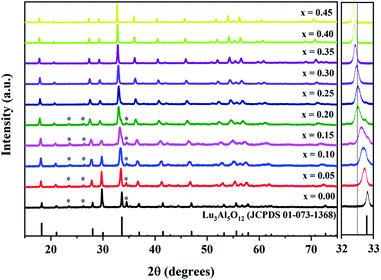 |
| | Fig. 1 XRD patterns of the Lu3Al5−xFexO12:Ce3+ (0.00 ≤ x ≤ 0.45) samples; * indicates the XRD peaks from the secondary crystal phase (LuAlO3). Right panel: magnified XRD peak in the 2θ range 32–33°. | |
 |
| | Fig. 2 Refined XRD patterns for the Lu3Al5−xFexO12:Ce3+ samples with x = 0.00 (a) and 0.45 (b). | |
Table 1 Structural data and residual factors of the Lu3Al5−xFexO12:Ce3+ (0.00 ≤ x ≤ 0.45) samples
| x Value |
Phase |
% phase |
Space group |
χ2 |
% Rf |
| 0.00 |
Lu2.865Ce0.135Al5O12 |
77.54 |
Iad (230) |
1.22 |
7.05 |
| LuAlO3 |
16.46 |
Pbnm (62) |
| 0.05 |
Lu2.865Ce0.135Al4.95Fe0.05O12 |
83.82 |
Iad (230) |
1.31 |
6.65 |
| LuAlO3 |
12.17 |
Pbnm (62) |
| 0.10 |
Lu2.865Ce0.135Al4.90Fe0.1O12 |
91.03 |
Iad (230) |
1.37 |
7.78 |
| LuAlO3 |
8.97 |
Pbnm (62) |
| 0.15 |
Lu2.865Ce0.135Al4.85Fe0.15O12 |
92.08 |
Iad (230) |
1.12 |
7.93 |
| LuAlO3 |
5.92 |
Pbnm (62) |
| 0.20 |
Lu2.865Ce0.135Al4.80Fe0.20O12 |
94.05 |
Iad (230) |
1.10 |
7.36 |
| LuAlO3 |
3.95 |
Pbnm (62) |
| 0.25 |
Lu2.865Ce0.135Al4.75Fe0.25O12 |
100 |
Iad (230) |
1.12 |
6.98 |
| 0.30 |
Lu2.865Ce0.135Al4.70Fe0.30O12 |
100 |
Iad (230) |
1.09 |
5.45 |
| 0.35 |
Lu2.865Ce0.135Al4.65Fe0.35O12 |
100 |
Iad (230) |
1.04 |
5.35 |
| 0.40 |
Lu2.865Ce0.135Al4.60Fe0.40O12 |
100 |
Iad (230) |
1.04 |
5.92 |
| 0.45 |
Lu2.865Ce0.135Al4.55Fe0.45O12 |
100 |
Iad (230) |
1.03 |
5.31 |
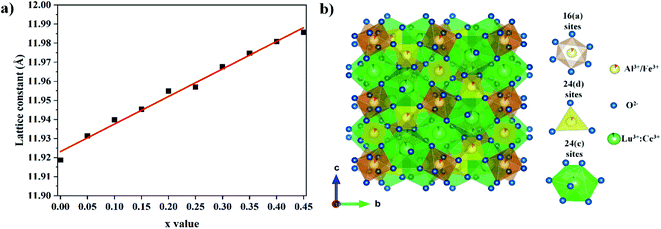 |
| | Fig. 3 Lattice constant as a function of the Fe3+ concentration (a) and 3D view of unit cell for the Lu3Al5−xFexO12:Ce3+ garnet system (b). | |
Absorption spectra in the near-infrared (NIR) region were recorded to verify the modification of the electronic and vibrational bands, generated by the Fe3+ insertion in the host structure. Fig. 4 shows the NIR spectra for the Lu3Al5−xFexO12:Ce3+ (x = 0.00 and 0.45) samples. The spectra can be separated into three main regions, which are attributed to: electronic absorption due to oxygen–metal charge transfer (I), and vibrational absorptions attributed to stretching (ν) and bending (δ) of the metal–oxygen bond in octahedral (II) and tetrahedral (III) configurations. The bands attributable to the oxygen–metal charge transfer are located in the spectral range 800–1100 nm.17 By increasing the Fe3+ concentration, the bands exhibited a shift toward longer wavelengths (decrease in energy), this is attributable to the decrease of the separation energy because of variations in the local polyhedrons and the mixing of excited states.18 Trivalent cations exhibit a larger effective ionic radius when they are in octahedral configuration, and there is more electrostatic repulsion from the six oxygen atoms surrounding. Then, the bands attributed to vibrational absorption of the octahedral configuration are located at shorter wavelengths than those from the tetrahedral configuration.17 The wavelength of the vibrational absorptions is proportional to the polarizing power of the cation in an octahedral or tetrahedral configuration. Fe3+ cation has a lower polarizing power (4.76) than Al3+ (5.66),19 therefore, higher Fe3+ concentration in the garnets led to a progressively decreasing in the wavelength of the vibrational absorptions.
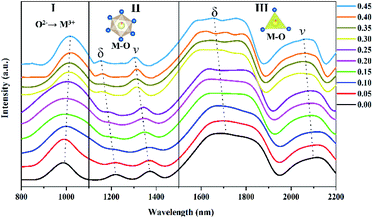 |
| | Fig. 4 Absorption spectra in the NIR region for the Lu3Al5−xFexO12:Ce3+ (0.00 ≤ x ≤ 0.45) samples. | |
3.2 Optical characterization
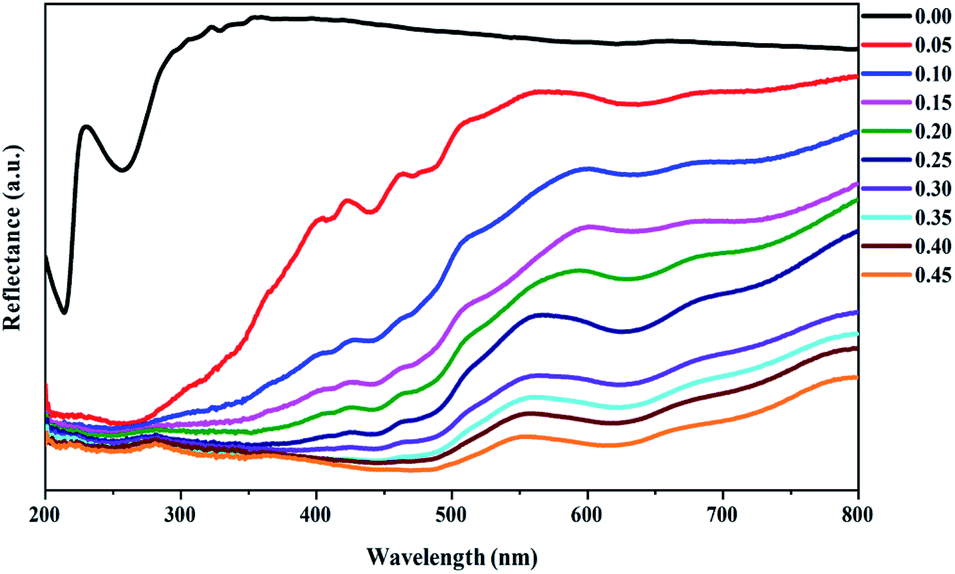
3.2.1 Diffuse reflectance. Fig. 5 shows the diffuse reflectance spectra of the Lu3Al5−xFexO12:Ce3+ samples. The host structure (x = 0.00) showed an intense reflectance in the visible region (300–800 nm), and lower intensity in the ultraviolet region (200–300 nm). The increase of Fe3+ concentration generated a progressive decrease of the reflectance in the ultraviolet and visible regions as well as a red-shift phenomenon, which is attributed to the reduction of the energy band structure.20
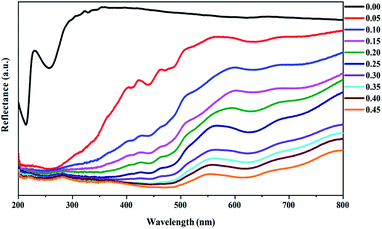 |
| | Fig. 5 Diffuse reflectance spectra of the Lu3Al5−xFexO12:Ce3+ (0.00 ≤ x ≤ 0.45) samples. | |
The band-gap (Eg) values of the samples were estimated by linear extrapolation from the Tauc plots,21 which were determined using eqn (1):22
| | |
[F(R)hv]n = A(hv − Eg)
| (1) |
where
A is a proportional constant,
hv is the photon energy, the
n coefficient denotes the nature of the transition, and
F(
R) is the Kubelka–Munk function
23 (see
eqn (2)), in which
R in the reflectance.
| |
 | (2) |
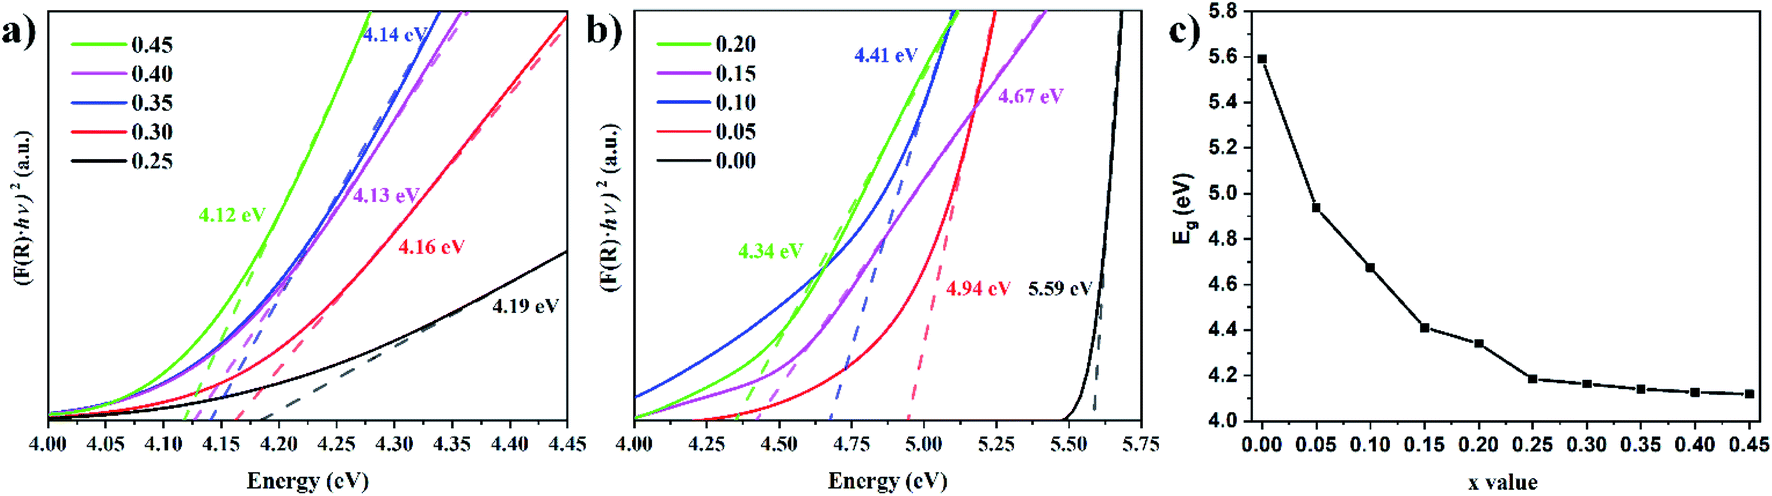
Fig. 6a and b shows the Tauc plots for the Lu3Al5−xFexO12:Ce3+ samples. The experimental data were well fitted with n = 2, indicating the existence of direct allowed transitions in the materials. Eg decreased progressively by increasing the Fe3+ concentration (Fig. 6c), this is due to the expansion of the lattice constant. In a cubic semiconductor, the Eg proportionally decreases to the square of lattice constant,24 this can be attributed to the binding energy of the valence decrease by increasing the interatomic distance, requiring less energy to release the electrons from the conduction band.
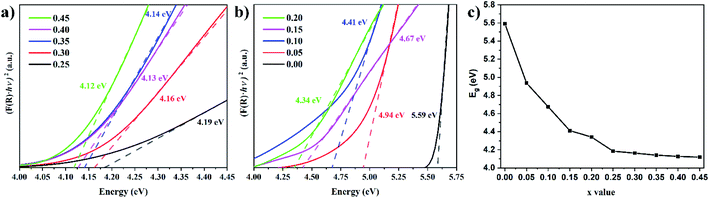 |
| | Fig. 6 Tauc plots of the Lu3Al5−xFexO12:Ce3+ (0.00 ≤ x ≤ 0.45) samples (a and b) and Eg as a function of the Fe3+ concentration (c). | |
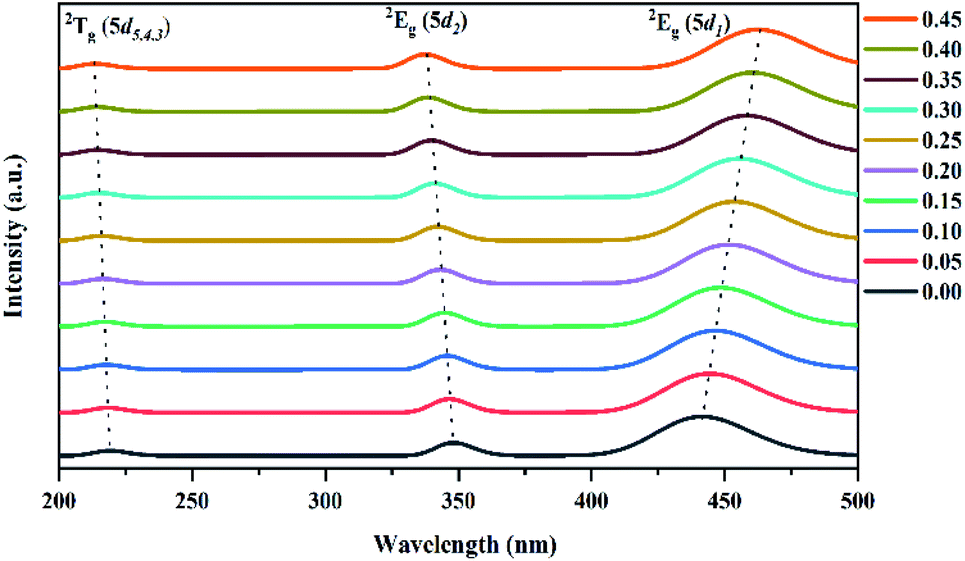
3.2.2 Absorption spectra. In the garnet structure, Ce3+ cations are located in the dodecahedral sites, generating a doublet state (2Eg) and a triplet state (2Tg), with a usual crystal field splitting (ε0) between the lowest (5d1) level and the highest (5d5) level. Nevertheless, the 5d1 and 5d2 levels from the 2Eg state are more splitting than those in cubic or octahedral coordination, leading to an additional crystal field splitting25 (Δ1–2). As a result, all of the samples exhibited tree adsorption bands in the UV-Vis region (Fig. 7). The bands located in the spectral range 200–230 nm are attributable to the overlapped 4f (2F5/2) → 2Tg (5d5,4,3) transitions and the remaining bands located around 350 and 450 nm correspond to the 4f (2F5/2) → 2Eg (5d2) and 4f (2F5/2) → 2Eg (5d1) transitions, respectively.26
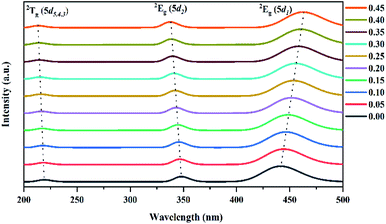 |
| | Fig. 7 Absorption spectra in the UV-Vis region for the Lu3Al5−xFexO12:Ce3+ (0.00 ≤ x ≤ 0.45) samples. | |
By increasing the Fe3+ concentration in samples, the bands associated to 4f (2F5/2) → 2Tg (5d5,4,3) and 4f (2F5/2) → 2Eg (5d1) transitions exhibited a shift toward longer wavelengths (red-shift). By contrast, the band associated to 4f (2F5/2) → 2Eg (5d1) transition exhibited a shift toward shorter wavelengths (blue-shift). The energy of the 5d levels is very sensitive to variations in the local coordination,27 and the crystal field energy.28 The Fe3+ doping generated the intensification of the ε0 and Δ1–2 energies, increasing the energy of the 2Tg (5d5,4,3) and the 2Eg (5d2) levels, but decreasing the energy of the 2Eg (5d1) level. The wavelength of the absorption bands and the values of the ε0 and Δ1–2 energies are shown in Table 2. Based on theoretical calculations, Chen et al. established that the insertion of larger cations generates a strong comprehensive effect in the garnet structure, leading to the generation of hybrid molecular orbitals from the d-orbitals of the metal and the 2p orbital of the oxygen.
Table 2 Wavelength (nm) and energy (eV) of the excited states for Ce3+ in Lu3Al5−xFexO12:Ce3+ materials, and energy of the crystal fields splitting ε0 and Δ1–2
| x Value |
Absorption band (nm) |
ε0 (eV) |
Δ1–2 (eV) |
| 5d5 |
5d4 |
5d3 |
5d2 |
5d1 |
| 0.00 |
209 (5.93 eV) |
219 (5.66 eV) |
228 (5.44 eV) |
348 (3.56 eV) |
442 (2.81 eV) |
2.63 |
0.75 |
| 0.05 |
208 (5.95 eV) |
218 (5.68 eV) |
227 (5.46 eV) |
347 (3.58 eV) |
444 (2.79 eV) |
2.67 |
0.79 |
| 0.10 |
208 (5.97 eV) |
218 (5.69 eV) |
227 (5.47 eV) |
346 (3.59 eV) |
446 (2.78 eV) |
2.69 |
0.81 |
| 0.15 |
207 (5.99 eV) |
217 (5.71 eV) |
226 (5.48 eV) |
345 (3.60 eV) |
448 (2.76 eV) |
2.72 |
0.83 |
| 0.20 |
206 (6.01 eV) |
216 (5.73 eV) |
225 (5.50 eV) |
343 (3.61 eV) |
452 (2.75 eV) |
2.75 |
0.87 |
| 0.25 |
206 (6.02 eV) |
216 (5.74 eV) |
225 (5.51 eV) |
342 (3.62 eV) |
454 (2.73 eV) |
2.78 |
0.89 |
| 0.30 |
205 (6.05 eV) |
215 (5.77 eV) |
224 (5.53 eV) |
341 (3.63 eV) |
456 (2.72 eV) |
2.81 |
0.91 |
| 0.35 |
205 (6.06 eV) |
215 (5.78 eV) |
224 (5.54 eV) |
340 (3.65 eV) |
458 (2.71 eV) |
2.84 |
0.94 |
| 0.40 |
204 (6.07 eV) |
214 (5.79 eV) |
223 (5.56 eV) |
339 (3.66 eV) |
460 (2.69 eV) |
2.86 |
0.97 |
| 0.45 |
204 (6.09 eV) |
214 (5.80 eV) |
223 (5.57 eV) |
338 (3.67 eV) |
462 (2.68 eV) |
2.89 |
0.99 |
This orbitals hybridization leads to a strong decrease of the band-gap (Eg) by expansion of the conduction band, the reduction in the effective mass of the electron, and an intensification of the crystal splitting energies.29
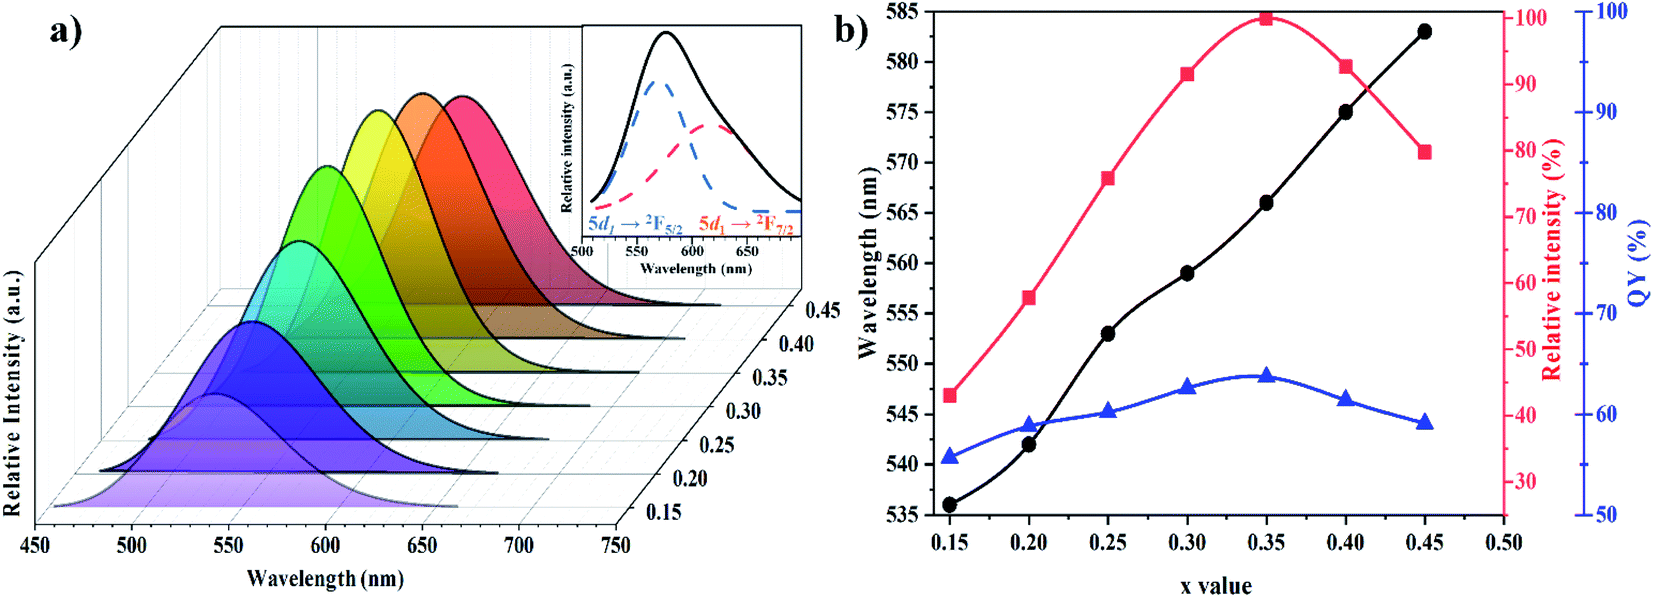
3.2.3 Photoluminescence properties. Lu3Al5−xFexO12:Ce3+ samples with x ≥ 0.15 exhibited photoluminescence (PL) under blue irradiation (436 nm), exhibiting asymmetric bands in the spectral range 450–650 nm (Fig. 8a). The emission bands were resolved into two Gaussian profiles (as shown in the inset of Fig. 8a) attributed to a transition from the lowest 2Eg level (5d1) to 2F5/2 and 2F7/2 ground states, respectively.30 Bandwidths are considerably broad because of strong phonon coupling,26,31 and indicate crystal field effects on the excited states of Ce3+.32 Moreover, the Fe3+ insertion led to a shift of the emission bands, which suggest that the bands are due to unrelaxed charge-transfer between the Ce3+ cations.33
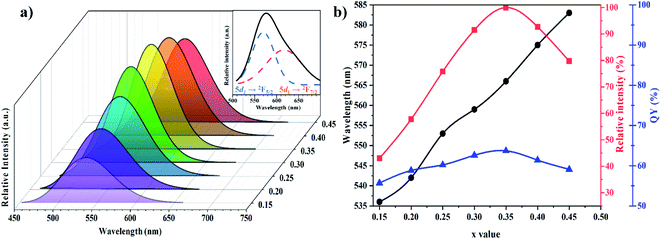 |
| | Fig. 8 PL spectra under 436 nm excitation of the Lu3Al5−xFexO12:Ce3+ samples with 0.15 ≤ x ≤ 0.45 (a). Wavelength, emission intensity and quantum yield of the emission band as a function of the x value (b). Inset: Gaussian profiles attributed to lowest 2Eg(5d1) → 2F5/2 and 2Eg(5d1) → 2F7/2 transitions of Ce3+. | |
A slight red-shift was observed by increasing Fe3+ concentration (Fig. 8b), which is attributed to the intensified Δ1–2 energy, which generated a less separation between the lowest 2Eg level (5d1) and the 4f ground states (2F5/2 and 2F7/2).29,34 As reported above, the insertion of Fe3+ led to the expansion of the unit cell, and therefore blue-shift phenomena would be expected.26,35 Nevertheless, the red-shift although uncommon is consistent with the reported in similar research works, in which larger cations are inserted in the host garnet structures.29,36,37 Besides the intensified Δ1–2 energy, the red-shift of the emission spectra can be attributable to the increase of the Stokes shift (SS) within the ground states and the lowest excited state (5d1). The Stokes shift energy is proportional to the degree of electron–phonon interaction.26 Then, the electron–phonon interaction would become stronger by increasing Fe3+ concentration, leading to an increase in the Stokes shift. The emission band of the materials and the values of the Stokes shift are summarized in Table 3.
Table 3 Emission band and Stokes shift of the Lu3Al5−xFexO12:Ce3+ materials
| x Value |
Emission band (nm) |
Stokes shift (nm) |
Stokes shift (eV) |
| 0.15 |
536 (2.31 eV) |
88 |
0.45 |
| 0.20 |
542 (2.29 eV) |
90 |
0.46 |
| 0.25 |
553 (2.24 eV) |
99 |
0.49 |
| 0.30 |
559 (2.22 eV) |
103 |
0.50 |
| 0.35 |
566 (2.19 eV) |
108 |
0.51 |
| 0.40 |
575 (2.16 eV) |
115 |
0.54 |
| 0.45 |
583 (2.13 eV) |
120 |
0.55 |
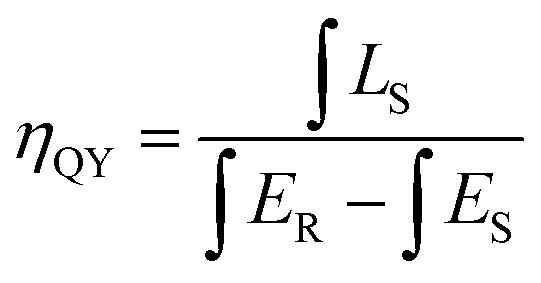
For w-LED applications, the quantum yield (QY) is an important parameter in evaluating the phosphors for w-LEDs. The QY was measured under 436 nm and calculated using the eqn (3):38
| |
 | (3) |
where
LS is the emission spectrum of the sample,
ES and
ER represent the excitation light with and without the sample in the integrating sphere, respectively.
ηQY of the materials progressively increased, reaching a maximum of 64% for the material with
x = 0.35 (
Fig. 8b). Although the
ηQY values are not as high as those of the commercial Y
3Al
5O
12:Ce
3+ garnet, they are higher than other reports and could be enhanced by tuning structural and morphological properties. The increase of the Fe
3+ concentration also generated a higher emission intensity due to the enhanced absorption at 436 nm (
Fig. 8b), reaching a maximum when
x = 0.35.
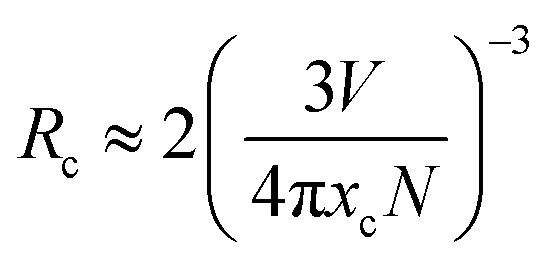
The maximum ηQY and emission intensity values when x = 0.35 can be attributable to inaccessible phonon modes due to the insertion of a large substituent such as Fe3+ into the rigid host structure.39 The subsequent luminescence quenching and the decrease in ηQY at higher Fe3+ concentrations (x = 0.40 and 0.45) are due to the fact that Fe3+ insertion in the host structure generated the expansion of the lattice constant, increasing the probability of non-radiative transfer between Ce3+ cations.40 Critical distance (Rc) between Ce3+ cations determine which mechanism is responsible for quenching, the Rc value was estimated using the eqn (4):41
| |
 | (4) |
where
V is the unit cell volume of the host lattice (
V = 1797.57 Å
3),
N is the number of dopant sites available in the unit cell (
N = 24), and
xc is the concentration of Ce
3+ cations (
xc = 0.045). The
Rc value was ∼14.70 Å, which implies concentration quenching is due to the electric multipolar interaction.
42
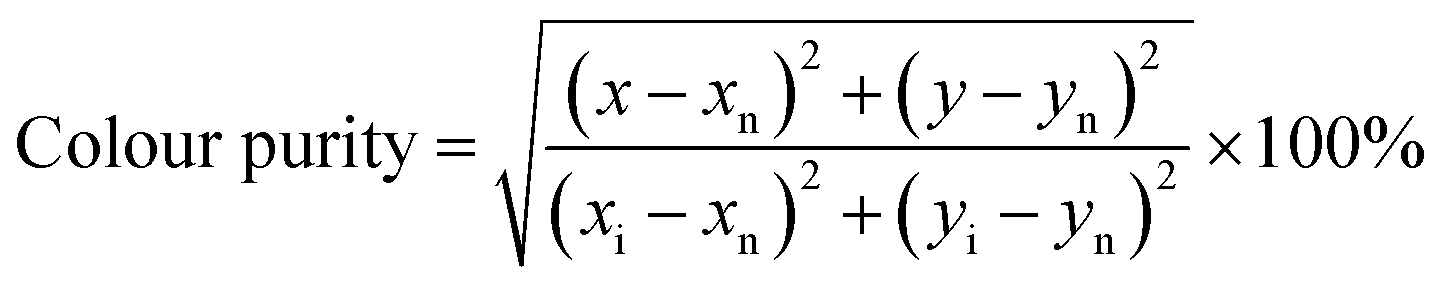
CIE chromaticity coordinates were determined from the emission spectra of samples and color purity was calculated using the eqn (5):43
| |
 | (5) |
where (
x,
y) are the CIE chromaticity coordinates; (
xn,
yn) refers to CIE chromaticity coordinates for the white point and (
xi,
yi) are the coordinates of the dominating wavelength.
Table 4 lists the CIE chromaticity coordinates and the color purity under 436 nm excitation for the Lu
3Al
5−xFe
xO
12:Ce
3+ materials. It could be observed that Fe
3+ doping allows increasing the color purity up to 95.2% (
x = 0.45). On the other hand, the CIE chromaticity diagram (
Fig. 9) shows that the emission was tuned from green to orange by the Fe
3+ doping in the garnets. The obtained garnets exhibited a great color conversion and a high color purity under blue light radiation, demonstrating their potential w-LEDs applications. In addition, according to the optical analysis,
Fig. 10 shows a schematic representation of the effect of Fe
3+ doping on the energy levels of Ce
3+in Lu
3Al
5−xFe
xO
12:Ce
3+ garnets.
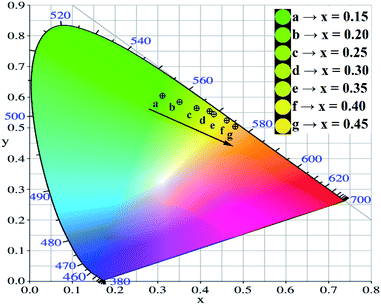 |
| | Fig. 9 CIE chromaticity diagram for the Lu3Al5−xFexO12:Ce3+ materials (0.15 ≤ x ≤ 0.45) and lighting photos under blue irradiation. | |
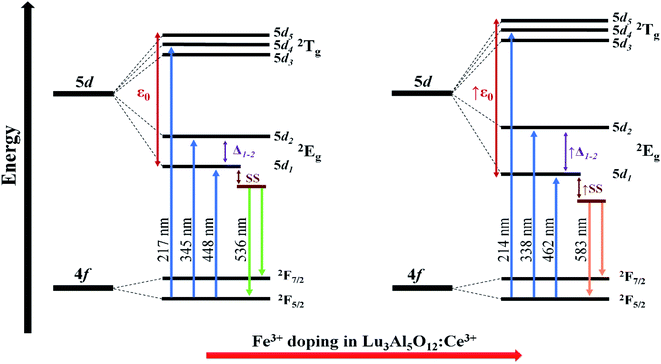 |
| | Fig. 10 Effect of Fe3+ doping on the energy-levels of Ce3+ in Lu3Al5O12:Ce3+ (0.15 ≤ x ≤ 0.45) garnets. | |
Table 4 CIE chromaticity coordinates and color purity for the Lu3Al5−xFexO12:Ce3+ (0.15 ≤ x ≤ 0.45) materials
| x Value |
CIE coordinates |
Colour purity |
| x |
y |
| 0.15 |
0.3112 |
0.6002 |
77.7% |
| 0.20 |
0.3504 |
0.5917 |
82.3% |
| 0.25 |
0.3893 |
0.5710 |
88.1% |
| 0.30 |
0.4201 |
0.5508 |
93.1% |
| 0.35 |
0.4291 |
0.5504 |
93.1% |
| 0.40 |
0.4612 |
0.5321 |
94.8% |
| 0.45 |
0.4817 |
0.510 |
95.2% |
3.2.4 Temperature-dependent PL. In working w-LEDs, the phosphor layer can reach temperatures up to 150 °C. Then, the thermal stability of phosphor is the most important parameter to evaluate its performance for w-LED applications, especially those based on blue chips. The PL spectra as a function of temperature for the Lu3Al5−xFexO12:Ce3+ (x = 0.35) phosphor under 436 nm excitation are presented in Fig. 11a. The emission intensity gradually decreased from 25 to 200 °C because of the thermal quenching (inset of Fig. 11a). At 150 °C the emission intensity was 82.36% of the initial intensity, which suggest a promising performance in the operating temperature range of w-LEDs. On the other hand, wavelength remained almost unchanged, demonstrating the high stability of the color emission. The slight blue shift is attributable to the thermally activated phonon-assisted excitation.44
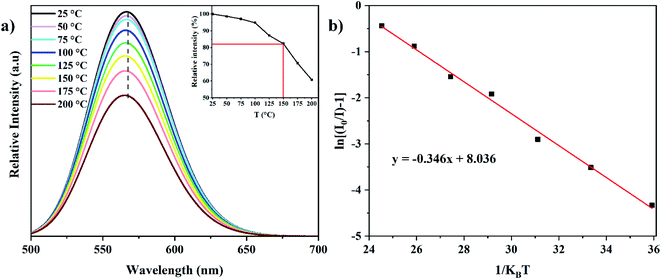 |
| | Fig. 11 Temperature-dependent PL spectra for the Lu3Al4.65Fe0.35O12:Ce3+ (x = 0.35) phosphor under 436 nm excitation (a) ln[(I0/I) − 1] vs. 1/kBT plot (b). Inset: relative emission intensity as a function of temperature. | |
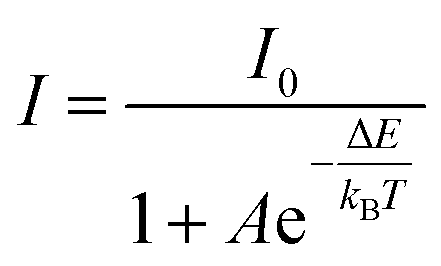
Activation energy (ΔE) was calculated using the Arrhenius equation:45
| |
 | (6) |
where
I and
I0 indicate the emission intensity at temperature
T and the initial temperature (in absolute scale), respectively.
A is a constant, and
kB is the Boltzmann constant (8.629 × 10
−5 eV
−1). Δ
E is determined by the absolute value of the slope for ln[(
I0/
I) − 1]
vs. 1/
kBT plot (
Fig. 11b). The Δ
E value was calculated to be 0.346 eV, which is relatively high and shows it outstanding thermal properties.
4 Conclusions
New Lu3Al5−xFexO12:Ce3+ garnets were produced through the solid-state reaction method at 1200 °C for 20 h. The Fe+3 doping improved the purity of the materials, obtaining pure-phase for x values ≥ 0.25. An expansion of the unit cell and modifications in the energy of the vibrational absorptions were observed by increasing the Fe3+ concentration, which confirms the suitable insertion of the Fe3+ into the host structure. The optical analysis indicated that Fe3+ doping led to a strong reduction in the band-gap and the intensification in the crystal field energy, which were attributable to the habitation of molecular orbitals. Moreover, the emission photoluminescence was tuned from green to orange due to the modifications on the Ce3+ energy levels. The obtained materials exhibited remarkable optical properties, such as high color conversion, thermal stability, quantum yield and color purity, which allow their potential applications in w-LEDs production.
Author contributions
Christian F. Varela: conceptualization, investigation, supervision, writing – original draft. Yeison D. Molina: methodology, investigation. S. Sandoval Gutiérrez: methodology, investigation. L. C. Moreno-Aldana: investigation, resources, writing – review & editing. C. A. Parra Vargas: conceptualization, investigation, writing – review & editing, project administration.
Conflicts of interest
The authors declare that there are no conflicts to declare.
Acknowledgements
The authors are thankful to Research Direction from Universidad Pedagógica y Tecnológica de Colombia for financially supporting this research (SGI 2556).
References
- M. Nikl, A. Yoshikawa, K. Kamada, K. Nejezchleb, C. R. Stanek, J. A. Mares and K. Blazek, Prog. Cryst. Growth Charact. Mater., 2013, 59, 47–72 CrossRef CAS.
- Q. Liu, J. Liu, J. Li, M. Ivanov, A. Medvedev, Y. Zeng, G. Jin, X. Ba, W. Liu, B. Jiang, Y. Pan and J. Guo, J. Alloys Compd., 2014, 616, 81–88 CrossRef CAS.
- S. Heer, M. Wermuth, K. Krämer and H. U. Güdel, Phys. Rev. B: Condens. Matter Mater. Phys., 2002, 65, 125112 CrossRef.
- M. Malinowski, R. Piramidowicz, Z. Frukacz, G. Chadeyron, R. Mahiou and M. F. Joubert, Opt. Mater., 1999, 12, 409–423 CrossRef CAS.
- J. S. Cho, K. Y. Jung and Y. Chan Kang, RSC Adv., 2015, 5, 8345–8350 RSC.
- J. Huang, S. Yi, Y. Deng, J. Xian and L. Zhang, Spectrochim. Acta, Part A, 2015, 148, 324–327 CrossRef CAS PubMed.
- J. M. Ogiegło, A. Zych, K. V. Ivanovskikh, T. Jüstel, C. R. Ronda and A. Meijerink, J. Phys. Chem. A, 2012, 116, 8464–8474 CrossRef PubMed.
- S. Witkiewicz-Lukaszek, A. Mrozik, V. Gorbenko, T. Zorenko, P. Bilski, A. Fedorov and Y. Zorenko, Crystals, 2020, 10, 189 CrossRef CAS.
- W. J. Mir, T. Sheikh, H. Arfin, Z. Xia and A. Nag, NPG Asia Mater., 2020, 12, 1–9 CrossRef.
- Y. Ohno, Opt. Eng., 2005, 44, 111302 CrossRef.
- W. Sun, Y. Jia, R. Pang, H. Li, T. Ma, D. Li, J. Fu, S. Zhang, L. Jiang and C. Li, ACS Appl. Mater. Interfaces, 2015, 7, 25219–25226 CrossRef CAS PubMed.
- X. Zhou, X. Luo, B. Wu, S. Jiang, L. Li, X. Luo and Y. Pang, Spectrochim. Acta, Part A, 2018, 190, 76–80 CrossRef CAS PubMed.
- A. M. Rivera, L. C. Aldana and C. A. Vargas, Mater. Res., 2019, 22, 1–8 Search PubMed.
- B. H. Toby and R. B. Von Dreele, J. Appl. Crystallogr., 2013, 46, 544–549 CrossRef CAS.
- W. Kraus and G. Nolze, J. Appl. Crystallogr., 1996, 29, 301–303 CrossRef CAS.
- K. Momma and F. Izumi, J. Appl. Crystallogr., 2011, 44, 1272–1276 CrossRef CAS.
- G. R. Rossman and B. L. Ehlmann, Remote Compositional Analysis, 2019, pp. 3–20 Search PubMed.
- K. Krambrock, F. S. Guimarães, M. V. Pinheiro, R. Paniago, A. Righi, A. I. Persiano, J. Karfunkel and D. B. Hoover, Phys. Chem. Miner., 2013, 40, 555–562 CrossRef CAS.
- J. L. Bishop, Remote Compositional Analysis, 2019, pp. 68–101 Search PubMed.
- Y. Zhou, W. Zhuang, Y. Hu, R. Liu, Z. Jiang, Y. Liu, Y. Li, Y. Zheng, L. Chen and J. Zhong, RSC Adv., 2017, 7, 46713–46720 RSC.
- D. Deng, H. Yu, Y. Li, Y. Hua, G. Jia, S. Zhao, H. Wang, L. Huang, Y. Li, C. Li and S. Xu, J. Mater. Chem. C, 2013, 1, 3194 RSC.
- E. A. Davis and N. F. Mott, Philos. Mag., 1970, 22, 0903–0922 CrossRef CAS.
- E. L. Simmons, Appl. Opt., 1975, 14, 1380 CrossRef CAS PubMed.
- R. Dalven, Phys. Rev. B: Solid State, 1973, 8, 6033–6034 CrossRef CAS.
- D. W. Cooke, R. E. Muenchausen, B. L. Bennett, K. J. McClellan and A. M. Portis, J. Lumin., 1998, 79, 185–190 CrossRef CAS.
- J. Ueda and S. Tanabe, Opt. Mater.: X, 2019, 1, 100018 CAS.
- J. Xu, W. Chen, R. Zeng and D. Peng, Mater. Lett., 2014, 133, 1–4 CrossRef CAS.
- P. Dorenbos, J. Lumin., 2003, 105, 117–119 CrossRef CAS.
- L. Chen, X. Chen, F. Liu, H. Chen, H. Wang, E. Zhao, Y. Jiang, T.-S. Chan, C.-H. Wang, W. Zhang, Y. Wang and S. Chen, Sci. Rep., 2015, 5, 11514 CrossRef CAS PubMed.
- R. Yu, S. Zhong, N. Xue, H. Li and H. Ma, Dalton Trans., 2014, 43, 10969–10976 RSC.
- M. Zhao, Q. Zhang and Z. Xia, Acc. Mater. Res., 2020, 1, 137–145 CrossRef CAS.
- W. J. Miniscalco, J. M. Pellegrino and W. M. Yen, J. Appl. Phys., 1978, 49, 6109–6111 CrossRef CAS.
- X. Zhang, L. Zhou, Q. Pang, J. Shi and M. Gong, J. Phys. Chem. C, 2014, 118, 7591–7598 CrossRef CAS.
- T. Hu, M. S. Molokeev, Z. Xia and Q. Zhang, J. Mater. Chem. C, 2019, 7, 14594–14600 RSC.
- P. Dorenbos, J. Lumin., 2013, 134, 310–318 CrossRef CAS.
- K. Kamada, T. Endo, K. Tsutumi, T. Yanagida, Y. Fujimoto, A. Fukabori, A. Yoshikawa, J. Pejchal and M. Nikl, Cryst. Growth Des., 2011, 11, 4484–4490 CrossRef CAS.
- S. Hu, X. Qin, G. Zhou, C. Lu, L. Guanghui, Z. Xu and S. Wang, Opt. Mater. Express, 2015, 5, 2902 CrossRef CAS.
- C. Liu, Z. Xia, Z. Lian, J. Zhou and Q. Yan, J. Mater. Chem. C, 2013, 1, 7139–7147 RSC.
- N. C. George, A. J. Pell, G. Dantelle, K. Page, A. Llobet, M. Balasubramanian, G. Pintacuda, B. F. Chmelka and R. Seshadri, Chem. Mater., 2013, 25, 3979–3995 CrossRef CAS.
- Y. B. Chen, Z. B. Tang, X. S. Xu, D. H. Feng, Z. Z. Wang and Z. Q. Liu, RSC Adv., 2016, 6, 43916–43923 RSC.
- G. Blasse, Phys. Lett. A, 1968, 28, 444–445 CrossRef CAS.
- K. Li, H. Lian and R. Van Deun, Dalton Trans., 2018, 47, 2501–2505 RSC.
- K. Kavi Rasu, D. Balaji and S. Moorthy Babu, J. Cryst. Growth, 2017, 468, 766–769 CrossRef CAS.
- Z. Xia, X. Wang, Y. Wang, L. Liao and X. Jing, Inorg. Chem., 2011, 50, 10134–10142 CrossRef CAS PubMed.
- L. Chen, R. H. Liu, W. D. Zhuang, Y. H. Liu, Y. S. Hu, X. F. Zhou, W. Gao and X. L. Ma, CrystEngComm, 2015, 17, 3687–3694 RSC.
|
| This journal is © The Royal Society of Chemistry 2021 |
Click here to see how this site uses Cookies. View our privacy policy here. 
 Open Access Article
 This Open Access Article is licensed under a Creative Commons Attribution-Non Commercial 3.0 Unported Licence
 *ac,
Yeison D. Molinaa,
S. Sandoval Gutiérrezb,
L. C. Moreno-Aldanac and
C. A. Parra Vargasa
*ac,
Yeison D. Molinaa,
S. Sandoval Gutiérrezb,
L. C. Moreno-Aldanac and
C. A. Parra Vargasa